Oxygen dissociation curve is
parabolic
hyperbolic
sigmoid
straight
Step-by-Step Solution:
1. Understanding the Question: The question asks about the shape of the oxygen dissociation curve.
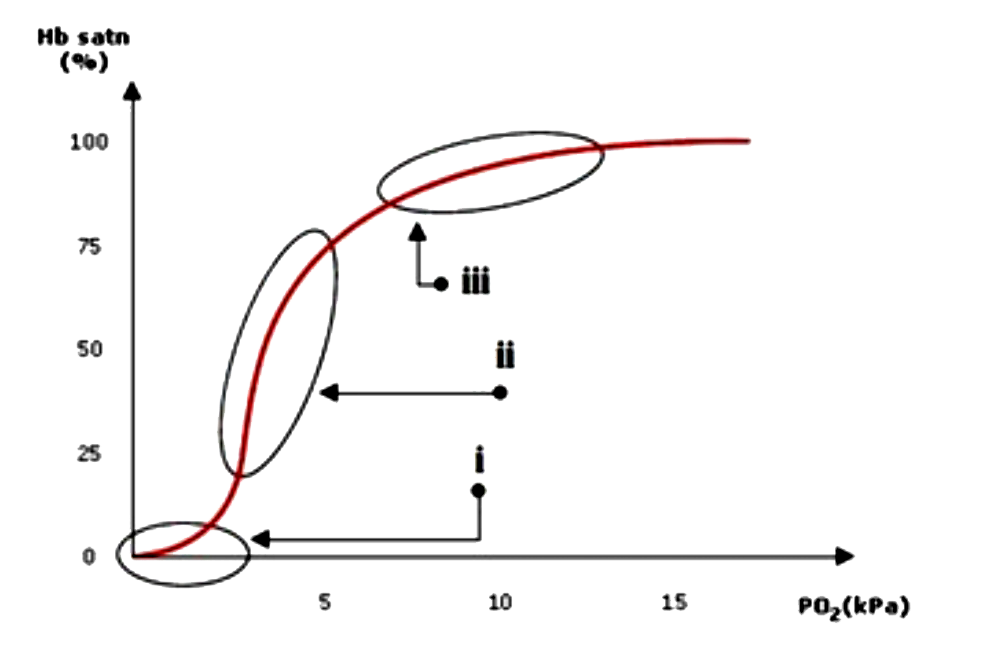
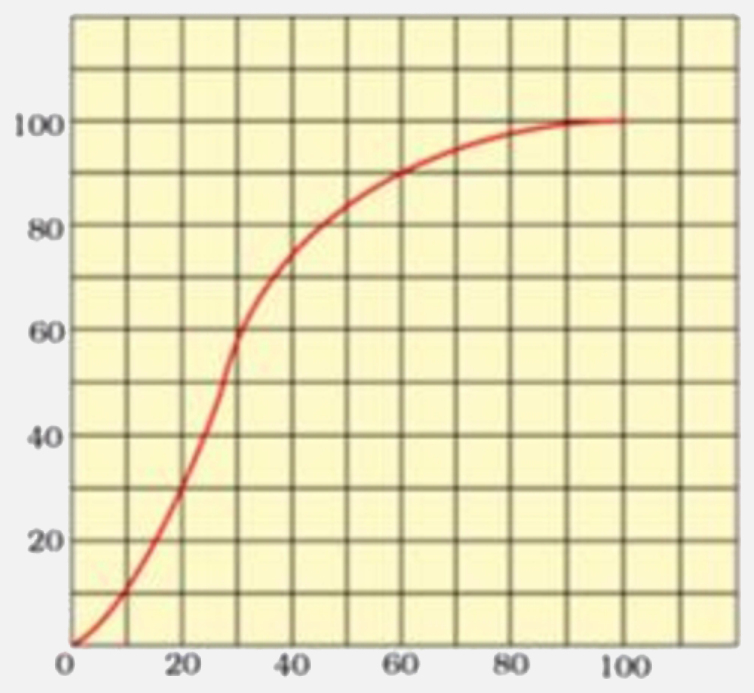
2. Definition of Oxygen Dissociation Curve: The oxygen dissociation curve is a graphical representation that shows how the saturation of hemoglobin with oxygen (y-axis) varies with the partial pressure of oxygen (x-axis).
3. Axes of the Graph:
- The horizontal axis (x-axis) represents the partial pressure of oxygen (pO2).
- The vertical axis (y-axis) represents the percentage saturation of hemoglobin with oxygen.
4. Shape of the Curve: The oxygen dissociation curve is characterized by its S-shaped (sigmoidal) curve. This means that the relationship between oxygen saturation and partial pressure of oxygen is not linear but rather has a sigmoid shape.
5. Comparison with Other Molecules: It is important to note that while the oxygen dissociation curve for hemoglobin is sigmoidal, other oxygen-carrying molecules, such as myoglobin, exhibit a hyperbolic dissociation curve.
6. Evaluating the Options:
- Parabolic: Incorrect
- Hyperbolic: Incorrect
- Sigmoid: Correct
- Straight: Incorrect
7. Conclusion: The correct answer regarding the shape of the oxygen dissociation curve is "sigmoid".
Final Answer:
The oxygen dissociation curve is sigmoid.
- The horizontal axis (x-axis) represents the partial pressure of oxygen (pO2).
- The vertical axis (y-axis) represents the percentage saturation of hemoglobin with oxygen.
- Parabolic: Incorrect
- Hyperbolic: Incorrect
- Sigmoid: Correct
- Straight: Incorrect
The oxygen dissociation curve is sigmoid.
Topper's Solved these Questions
- BREATHING AND EXCHANGE OF GASESBOOK - ICSECHAPTER - BREATHING AND EXCHANGE OF GASESEXERCISE - REVIEW QUESTIONS (FILL IN THE BLANKS)
13 Videos
- BREATHING AND EXCHANGE OF GASESBOOK - ICSECHAPTER - BREATHING AND EXCHANGE OF GASESEXERCISE - REVIEW QUESTIONS (MATCH THE FOLLOWING)
1 Videos
- BODY FLUIDS AND CIRCULATIONBOOK - ICSECHAPTER - BODY FLUIDS AND CIRCULATIONEXERCISE - DIFFRENTIATE BETWEEN
13 Videos
- CELL - THE UNIT OF LIFEBOOK - ICSECHAPTER - CELL - THE UNIT OF LIFEEXERCISE - REVIEW QUESTIONS (LONG ANSWER TYPE QUESTIONS)
14 Videos
Similar Questions
Knowledge Check
The oxygen dissociation curve will show a right shift in case of:
Ahigh PCO2Bhigh PO2Clow PCO2Dless H+ concentrationWhich of the following causes a leftward shift in the oxygen dissociation curve?
AIncreased carbon dioxide concentrationBAn increase in hydrogen ion concentrationCA decrease in pHDAll of the above
Under which condition the oxygen dissociation curve will move towards the right?
View SolutionWhat will be the effect on the oxygen dissociation curve, if the temperature is decreased ?
(a) The curve will be shifted right
(b) The curve will be shifted left
(c) The curve will became a straight line
(d) It is unpredictable
View SolutionIdentify the labelings i, ii , and iii in the hemoglobin-oxygen dissociation curve .

View SolutionThe following is an oxygen dissociation curve. The character depicted on the axes are

View SolutionIn which conditon oxygen dissociation curve of haemoglobin shift to right of normal curve ?
View SolutionDefine oxygen dissociation curve. Can you suggest any reason for its sigmoidal pattern?
View Solution
