In which conditon oxygen dissociation curve of haemoglobin shift to right of normal curve ?
decrease in pH
decrease in acidity
decrease in temperature
decrese in co2 concentration
The correct Answer is:A
To determine the conditions under which the oxygen dissociation curve of hemoglobin shifts to the right of the normal curve, we can follow these steps:
1. Understanding the Oxygen Dissociation Curve:
- The oxygen dissociation curve illustrates how readily hemoglobin binds to and releases oxygen at different partial pressures of oxygen (pO2).
- The curve is typically sigmoid in shape, indicating that hemoglobin's affinity for oxygen changes with varying pO2 levels.
2. Identifying Factors Affecting the Curve:
- Several physiological factors can influence the position of the oxygen dissociation curve, including pH, temperature, and carbon dioxide concentration.
3. Rightward Shift of the Curve:
- A rightward shift in the oxygen dissociation curve indicates that hemoglobin has a decreased affinity for oxygen, meaning it releases oxygen more readily.
- This shift occurs under certain conditions, such as:
- Increased temperature: Higher temperatures promote oxygen release.
- Decreased pH (increased acidity): A lower pH (more acidic conditions) leads to a rightward shift. This is often due to increased carbon dioxide levels, which produce carbonic acid.
- Increased carbon dioxide concentration: More CO2 in the blood results in more H+ ions, lowering pH and facilitating oxygen release.
4. Conclusion:
- The correct condition that causes the oxygen dissociation curve of hemoglobin to shift to the right is a decrease in pH (increased acidity), which is often associated with increased carbon dioxide concentration and higher temperatures.
Final Answer:
The oxygen dissociation curve of hemoglobin shifts to the right under conditions of decreased pH (increased acidity), which can occur during exercise or increased metabolic activity.
---
- The oxygen dissociation curve illustrates how readily hemoglobin binds to and releases oxygen at different partial pressures of oxygen (pO2).
- The curve is typically sigmoid in shape, indicating that hemoglobin's affinity for oxygen changes with varying pO2 levels.
- Several physiological factors can influence the position of the oxygen dissociation curve, including pH, temperature, and carbon dioxide concentration.
- A rightward shift in the oxygen dissociation curve indicates that hemoglobin has a decreased affinity for oxygen, meaning it releases oxygen more readily.
- This shift occurs under certain conditions, such as:
- Increased temperature: Higher temperatures promote oxygen release.
- Decreased pH (increased acidity): A lower pH (more acidic conditions) leads to a rightward shift. This is often due to increased carbon dioxide levels, which produce carbonic acid.
- Increased carbon dioxide concentration: More CO2 in the blood results in more H+ ions, lowering pH and facilitating oxygen release.
- The correct condition that causes the oxygen dissociation curve of hemoglobin to shift to the right is a decrease in pH (increased acidity), which is often associated with increased carbon dioxide concentration and higher temperatures.
The oxygen dissociation curve of hemoglobin shifts to the right under conditions of decreased pH (increased acidity), which can occur during exercise or increased metabolic activity.
Topper's Solved these Questions
Similar Questions
Knowledge Check
The oxygen dissociation curve is
AparabolaBslopeCsigmoidDstright line.The oxygen dissociation curve will show a right shift in case of:
Ahigh PCO2Bhigh PO2Clow PCO2Dless H+ concentration
O2 dissociation curve is:
View SolutionUnder which condition the oxygen dissociation curve will move towards the right ?
View SolutionUnder which condition the oxygen dissociation curve will move towards the right?
View SolutionOxygen haemoglobin dissociation curve will shift to right on decrease of
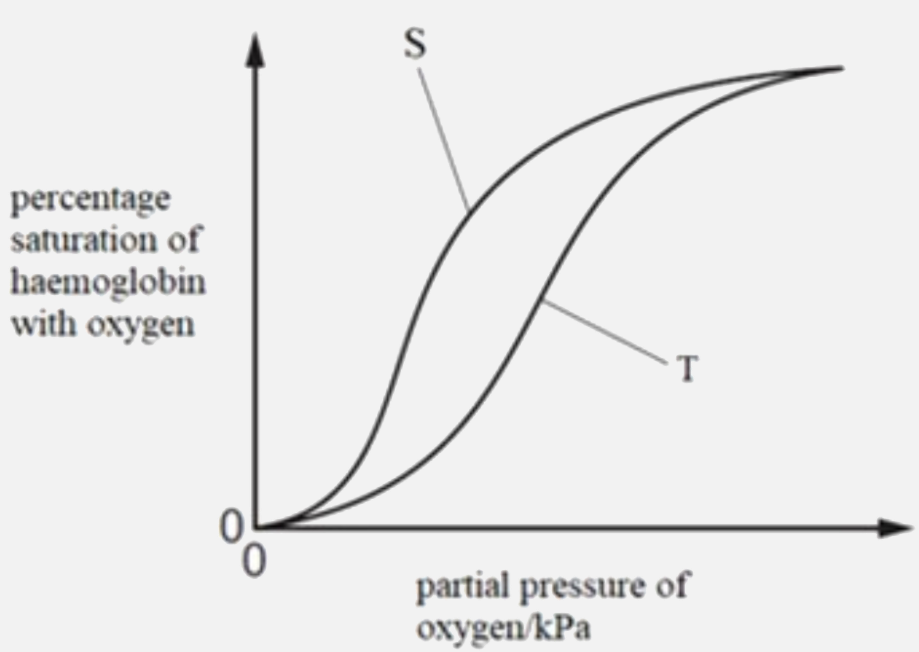
View SolutionThe graph shows the oxygen dissociation curves of haemoglobin from two species of mammals, s and T .

Which statements could explain the difference in the oxygen dissociation curves of species S and species T ?
I. Species T has higher haemoglobin concentration in its red blood cells than species S.
II. The haemoglobin in species T has a lower affinity for oxygen than the haemoglobin in species S.
III. Species T may be living at a higher altitudes than species S.
View SolutionO2 dissociation curve is shifted to right in all except
View Solution
