Read the para :

Now, fill the table with the above information.

Text Solution
|
Topper's Solved these Questions
- TRANSPORTATION - THE CIRCULATORY SYSTEMBOOK - VGS PUBLICATION-BRILLIANTCHAPTER - TRANSPORTATION - THE CIRCULATORY SYSTEMEXERCISE - 2 MARK QUESTIONS
39 Videos
- TRANSPORTATIONBOOK - VGS PUBLICATION-BRILLIANTCHAPTER - TRANSPORTATIONEXERCISE - EXERCISE
334 Videos
- URBANIZATION - EMPLOYMENT OPPERTUNITIES BOOK - VGS PUBLICATION-BRILLIANTCHAPTER - URBANIZATION - EMPLOYMENT OPPERTUNITIES EXERCISE - Fill in the blanks
10 Videos
Similar Questions
Knowledge Check
The cost of each table or each chair cannot exceed Rs. 9. If the cost of 4 table and 5 chairs cannot exceed Rs. 120, then the inequation which best represents the above information are :
Ax<9,y<9,5x+4x≥120Bx>9,y>9,4x+5y≥120C0<x≤9,0<y<9,4x+5y≤120D0<≤9,0<y≤9,5x+4y≥120The cost of each table of each chair cannot exceed Rs. 13. If the cost of 5 table and 7 chairs cannot exceed Rs . 250 , then the inequations which best represents the above information are
Ax>13,y>13,5x+7y>250Bx>0,y>0,5x+7y<250Cx<13,y<13,5x+7y≤25D0<x≤13,0<y≤13,5x+7y≤250
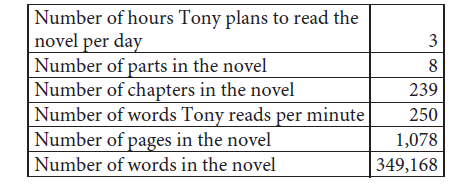
Tony is planning to read a novel. The table above shows information about the novel, Tony’s reading speed, and the amount of time he plans to spend reading the novel each day. If Tony reads at the rates given in the table, which of the following is closest to the number of days it would take Tony to read the entire novel?A6B8C23D324
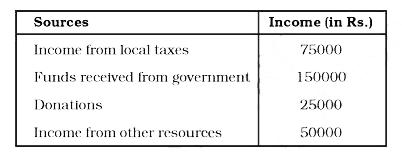
The following table represents income of a Gram Panchayat from different sources in a particular year:

Draw a bar graph to represent the above information
View SolutionThe following table shows the marks obtained by Sumit in the annual examination.

Draw a bar graph to show the above information.
View SolutionFill the blanks in the table using ‘block’ information given belowand write the corresponding number in decimal form
View SolutionFill the blanks in the table using ‘block’ information given below and write the corresponding number in decimal form

View SolutionThe table represents number of tourists visiting a zoo for 5 months.

Make a bar graph representing the above information.
View Solution


