The table represents number of tourists visiting a zoo for 5 months.

Make a bar graph representing the above information.
Step by step video & image solution for The table represents number of tourists visiting a zoo for 5 months. Make a bar graph representing the above information. by Maths experts to help you in doubts & scoring excellent marks in Class 6 exams.
Updated on:21/07/2023Topper's Solved these Questions
- DATA HANDLING BOOK - MTG IIT JEE FOUNDATIONCHAPTER - DATA HANDLING EXERCISE - Solved Examples
37 Videos
- DATA HANDLING BOOK - MTG IIT JEE FOUNDATIONCHAPTER - DATA HANDLING EXERCISE - NCERT Section (Exercise 9.1)
22 Videos
- BASIC GEOMETRICAL IDEASBOOK - MTG IIT JEE FOUNDATIONCHAPTER - BASIC GEOMETRICAL IDEASEXERCISE - OLYMPIAD/HOTS CORNER
10 Videos
- DECIMALSBOOK - MTG IIT JEE FOUNDATIONCHAPTER - DECIMALSEXERCISE - OLYMPIAD/HOTS CORNER
20 Videos
Similar Questions
The given table shows the number of tourists who visited Taj Mahal during different months. Month

Draw a bar graph to represent the above information by using appropriate scale.
View SolutionIn a botanical garden, the number of different types of plants are found as follows:
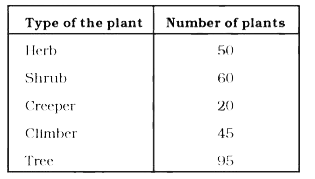
Draw a bar graph to represent the above information and answer the following question:
Which type of plant is maximum in number in the garden?
View SolutionIn a botanical garden, the number of different types of plants are found as follows:
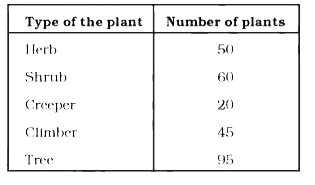
Draw a bar graph to represent the above information and answer the following question:
Which type of plant is minimum in number in the garden?
View SolutionHome appliances sold by a shop in one month are given as below:
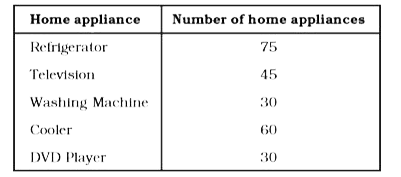
Draw a bar graph to represent the above information.
View SolutionThe lengths in km (rounded to nearest hundred) of some major rivers of India is given below:
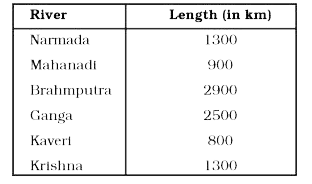
Draw a bar graph to represent the above information.
View SolutionNumber of mobile phone users in various age groups in a city is listed below:
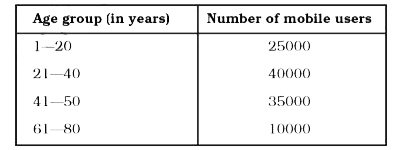
Draw a bar graph to represent the above information.
View SolutionThe number of ATMs of different banks in a city is shown below:
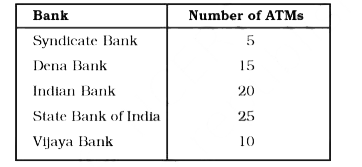
Draw a bar graph to represent the above information by choosing the scale of your choice.
View Solution0.4¯¯¯¯27 represents the rational number
View Solution70 students from a locality use different modes of transport to go to school as given below:

Draw the bar graph representing the above data.
View Solution70 students from a locality use different modes of transport to go to school as given below:
 Draw the bar graph representing the above data.
View Solution
