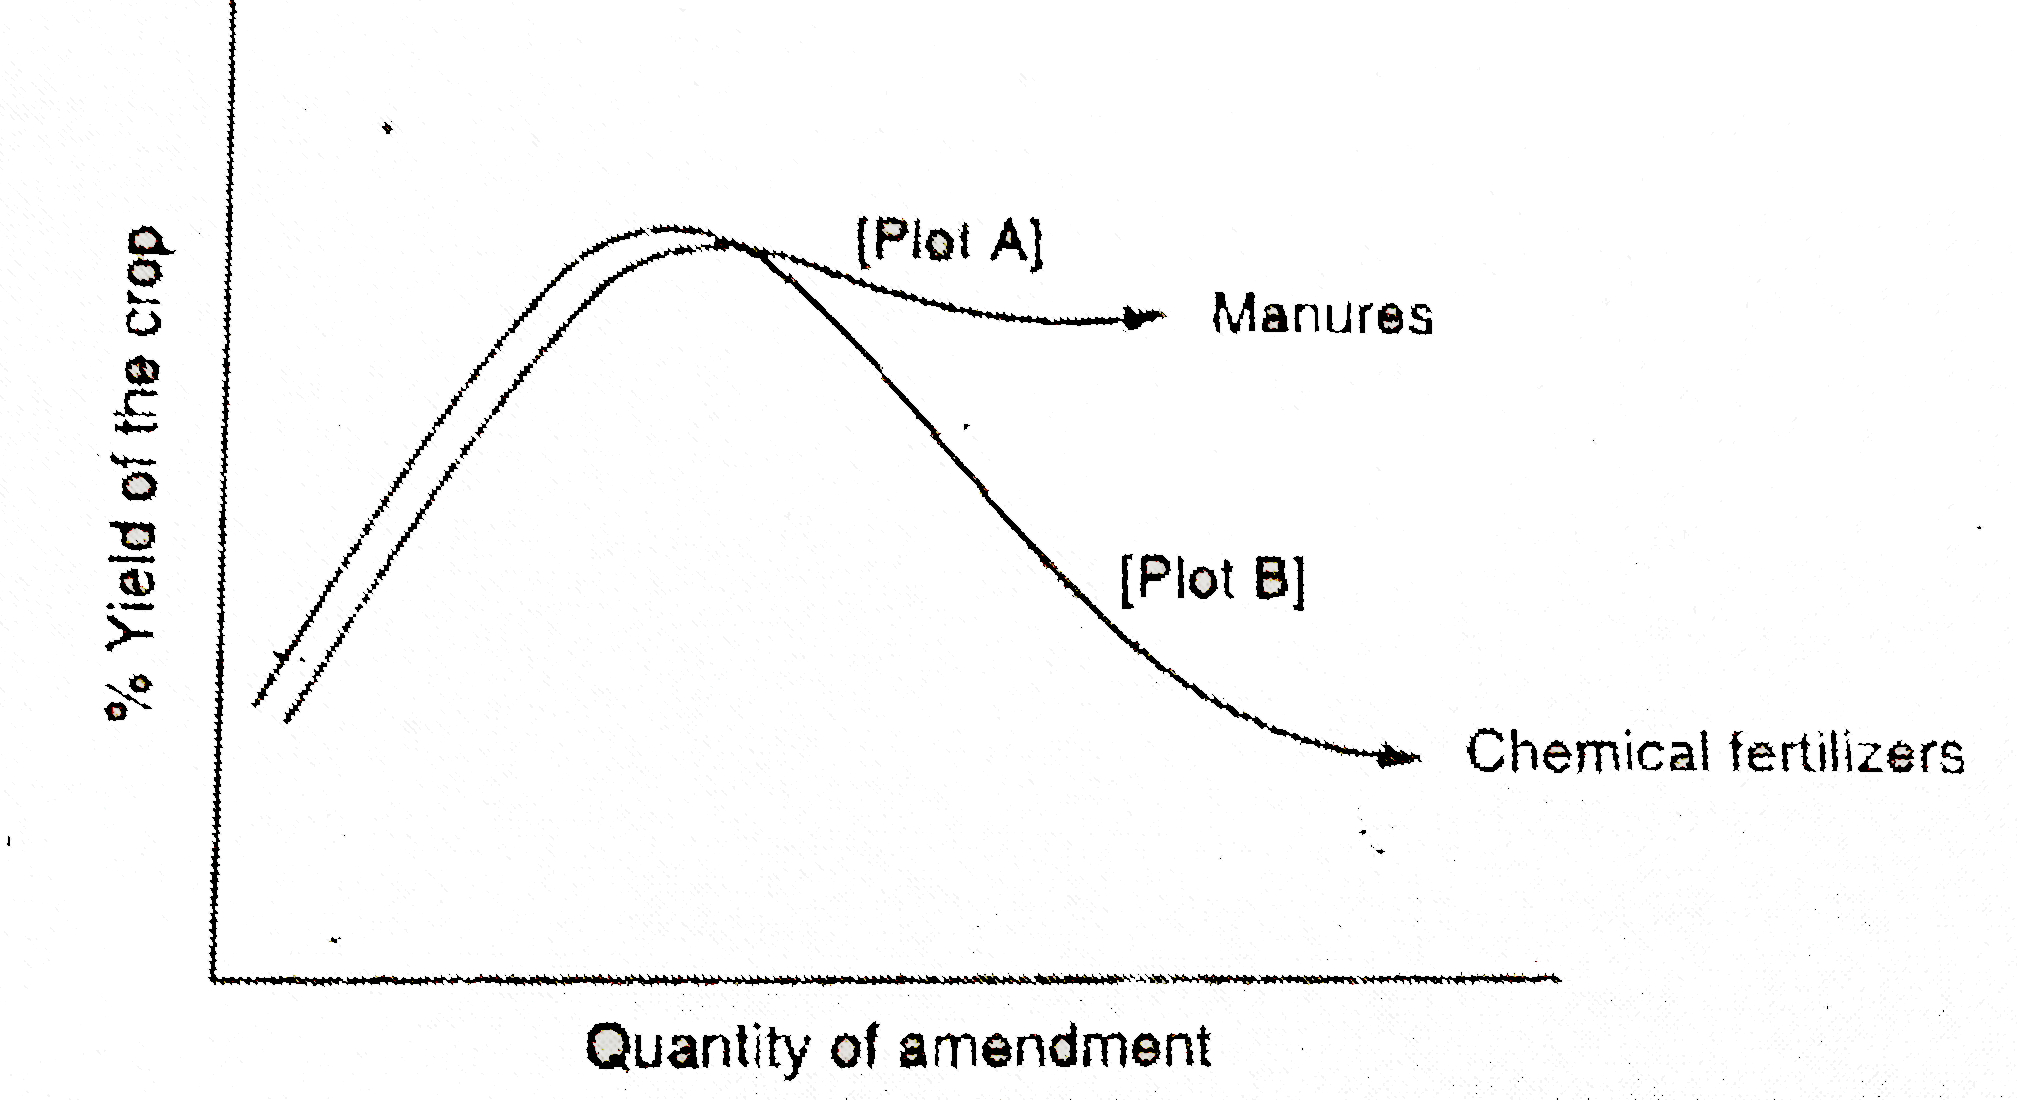
Refer to the given graph representing two crop fields X and Y that have been treated by different types of materials for nutrient replenishment, keeping other environmental factors same.

Select the incorrect statements regarding these crop fields X and Y.
Materials used for treating crop field X could be organic substances while those used for Y could be inorganic substances.
Materials used for crop field X are nutrient specific while those used for crop field Y are not nutrient specific.
Gradual decline in yield of crop field Y is due to killing of useful soil microbes.
Persistent yield of crop field X is due to replenishment of nutrients by gradual decomposition of organic matter.
The correct Answer is:B
Materials used for crop field X are nutrient specific while those used for crop field Y are not nutrient specific.
Topper's Solved these Questions
- CROP PRODUCTION AND MANAGEMENT BOOK - MTG IIT JEE FOUNDATIONCHAPTER - CROP PRODUCTION AND MANAGEMENT EXERCISE - EXERCISE (SUBJECTIVE QUESTIONS (LONG ANSWER TYPE))
5 Videos
- CONSERVATION OF PLANTS AND ANIMALS BOOK - MTG IIT JEE FOUNDATIONCHAPTER - CONSERVATION OF PLANTS AND ANIMALS EXERCISE - OLYMPIAD/ HOTS CORNER
12 Videos
- FOOTSTEPS TOWARDS CBSE BOARDBOOK - MTG IIT JEE FOUNDATIONCHAPTER - FOOTSTEPS TOWARDS CBSE BOARDEXERCISE - SECTION D
5 Videos
Similar Questions
Figure shows the two crop fields [Plots A and B ] have been treated by manures and chemical fertilisers respectively , keeping other environmental factor same . Observe the graph and answer the following question.
(i) Why does plot B show sudden increase and then gradual decrease in yield?
(ii) Why is the highest peak in plot A graph slightly delayed ?
(iii) What is the reason for the different pattern of the graphs ?

View SolutionThe figure shows two crop fields (plots A and B) have been treated by manures and chemical fertilizers, respectively, keeping other environment factors same. Observe the graph and answer the following question:
(i) Why does plot B shows sudden increase and then gradual decrease in yield ?
(ii) Why is the highest peak in plot A graph slightly delayed?
(iii) What is the reason for the different pattern of the two graphs.
View Solution
Knowledge Check
Refer to the given outline of nitrogen cycle. Identify X and Y and select the correct statement regarding them.
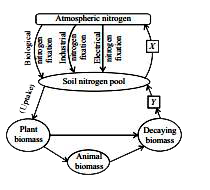 AIn the process X, protein is converted into ammonia by the action of bacteria while in the process Y, nitrates present in the decaying remains get converted into free nitrogen gas.BIn the process X, nitrates present in the soil get converted into free nitrogen gas while in the process Y, proteins are converted into ammonia by the action of bacteria.CProcess X represents the conversion of ammonia into nitrates while process Y represents the conversion of nitrates into the free nitrogen gas.DProcess X represents the conversion of ammonia into nitrites while process Y represents the conversion of complex organic compounds like proteins into ammonia.
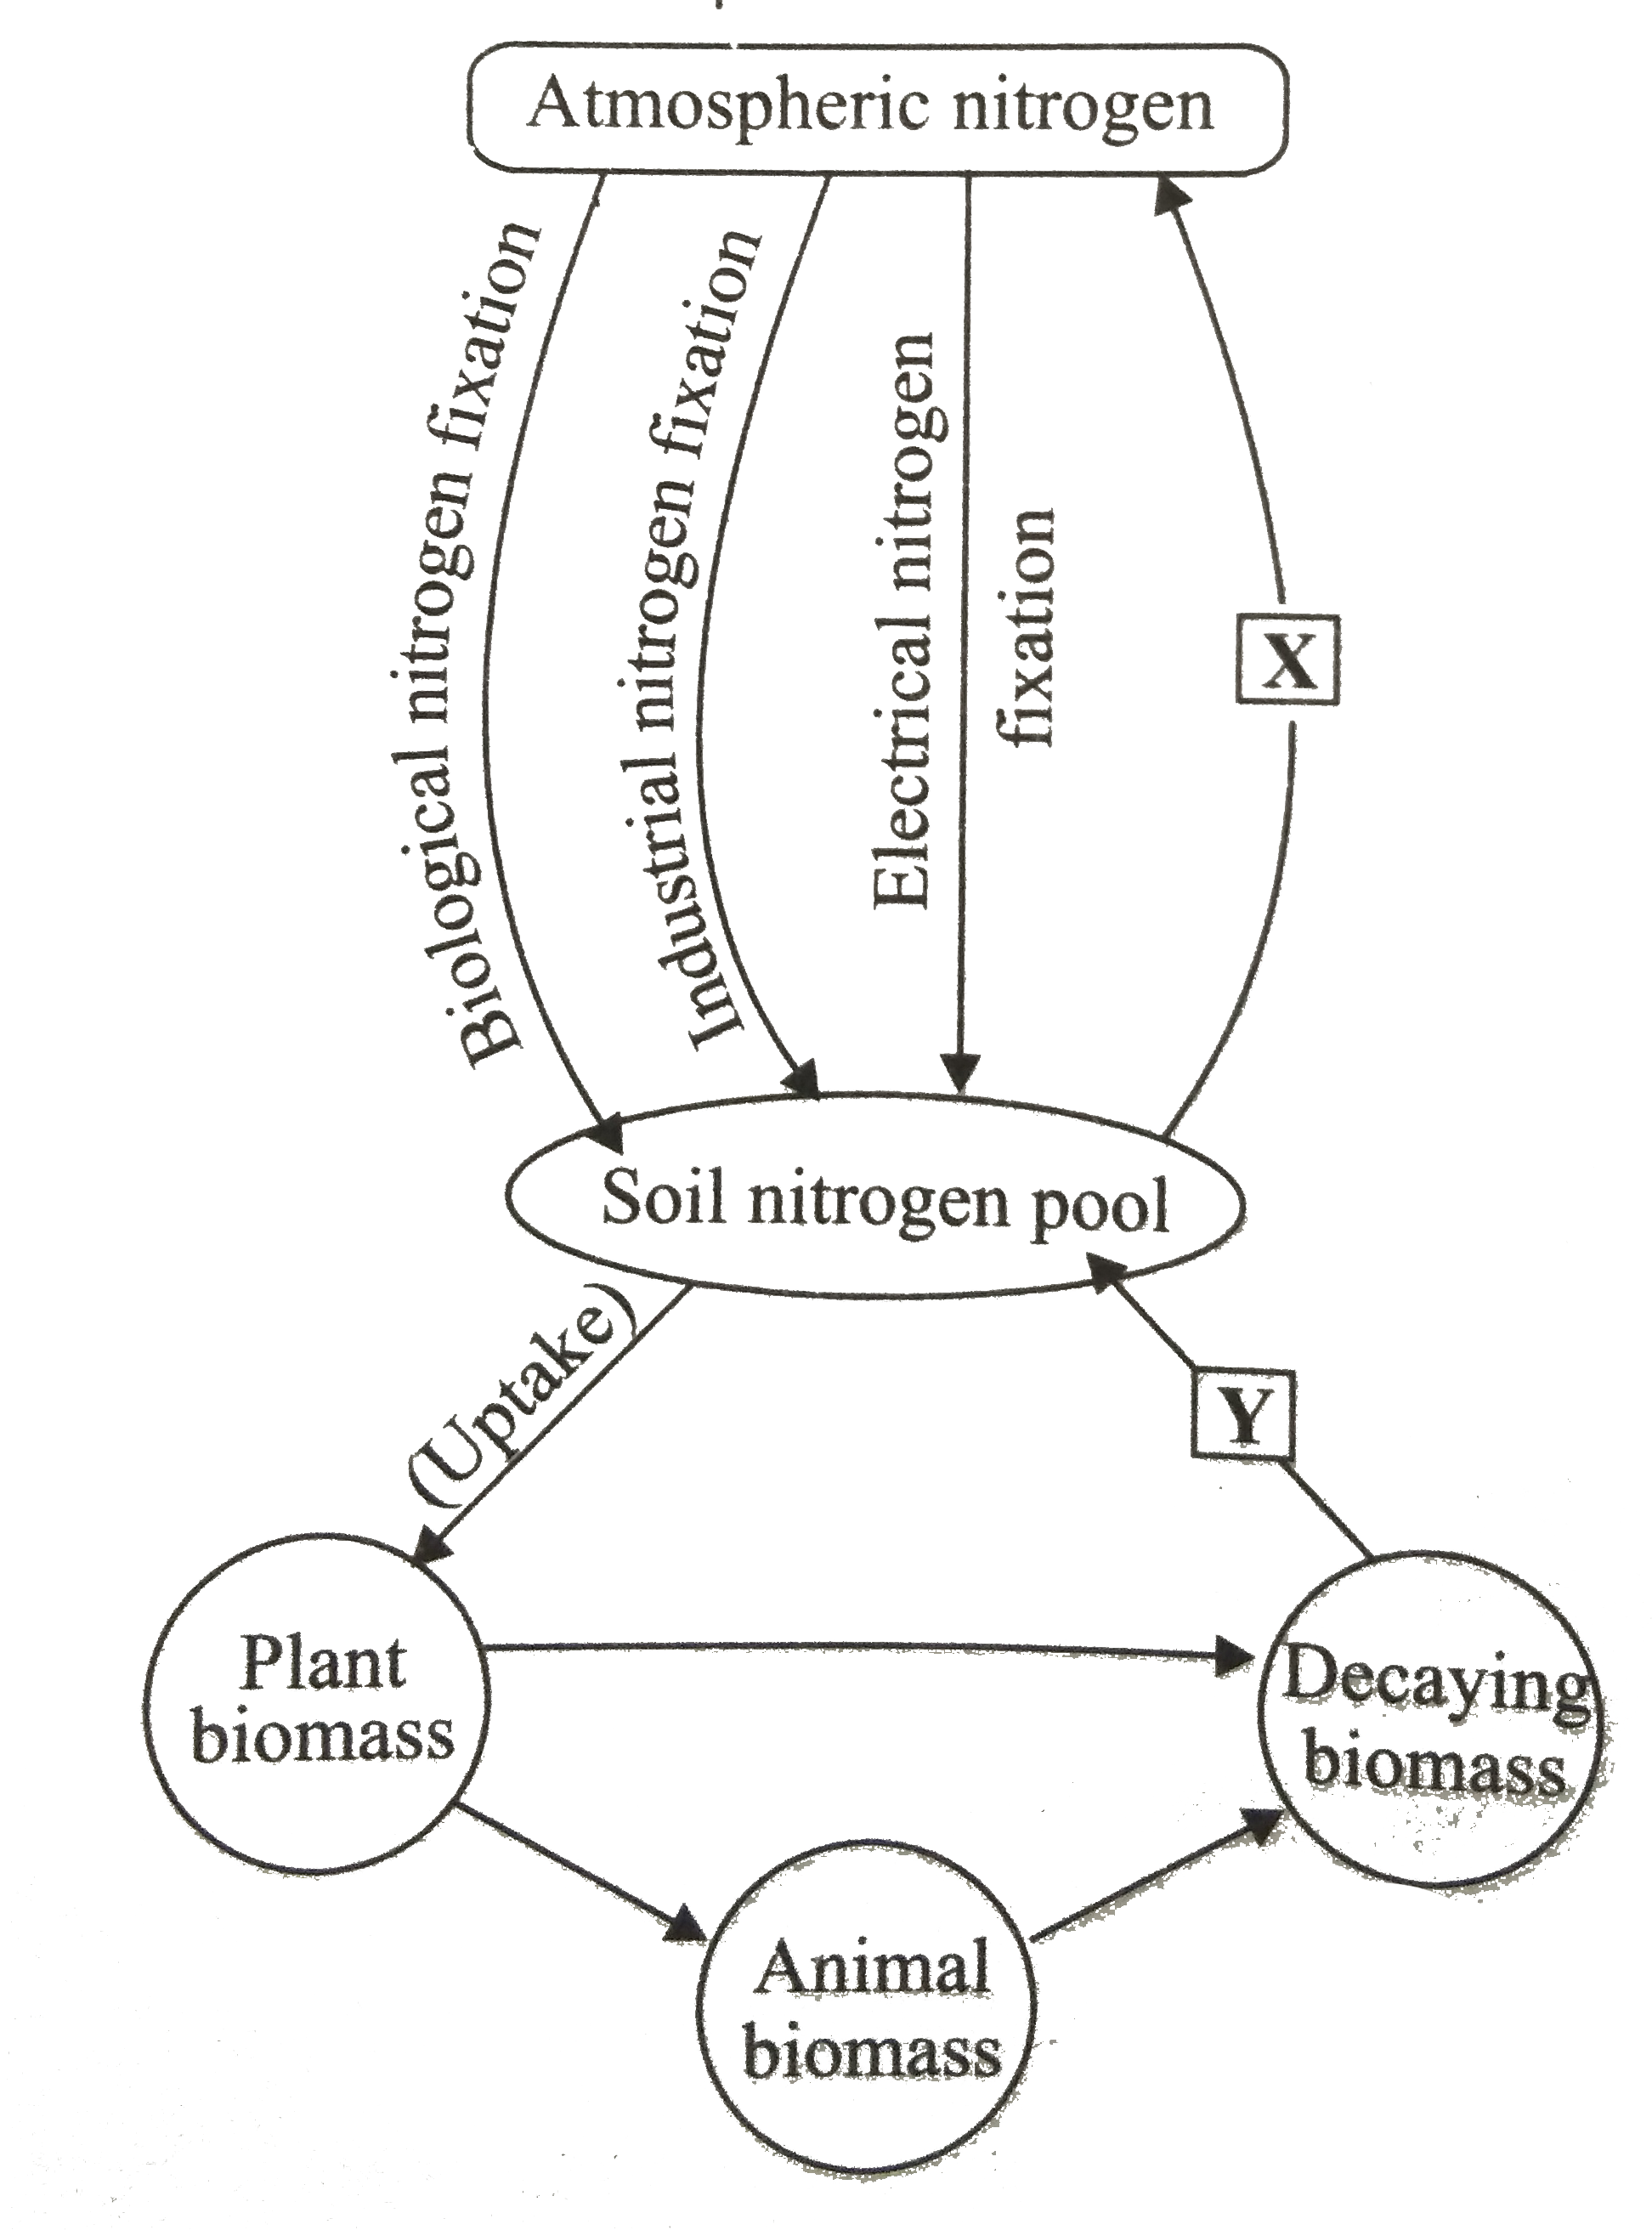
Identify the labels X and Y in the given outline of N2 cycle and select the correct option.AIn the process X, protein is converted into ammonia by the action of bacteria while in the process Y nitrates present in the decaying remains get converted into free nitrogen gas.BIn the process X, nitrates present in the soil get converted into free nitrogen gas while in the process Y, protein is converted into ammonia by the action of bacteria.CProcess X represents the conversion of ammonia into nitrates while process Y represents the conversion of nitrates into the free nitrogen gas.DProcess X represents the conversion of ammonia into nitrites while process Y represents the conversion of complex organic compound like proteins into ammonia.Refer to the given structure of a type of plant tissue. Identify its components X, Y and Z and select the correct statement regarding them.
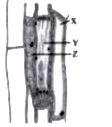
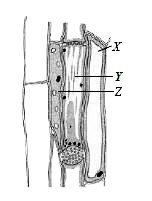 AX is a non-living thin-walled cell that helps in storage of food.BY is devoid of nucleus but mitochondria, plastids and endoplasmic reticulum are present in abundance in it.CZ is connected to X with the help of plasmodesmata.DBoth B and C
Refer to the given structure of a type of plant tissue. Identify its components X, Y and Z and select the correct statement regarding them.
View SolutionThe given graph represents how three different living organisms (X,Y and Z) cope with the external environmental conditions. Study the graph and select the correct option regarding X,Y and Z.
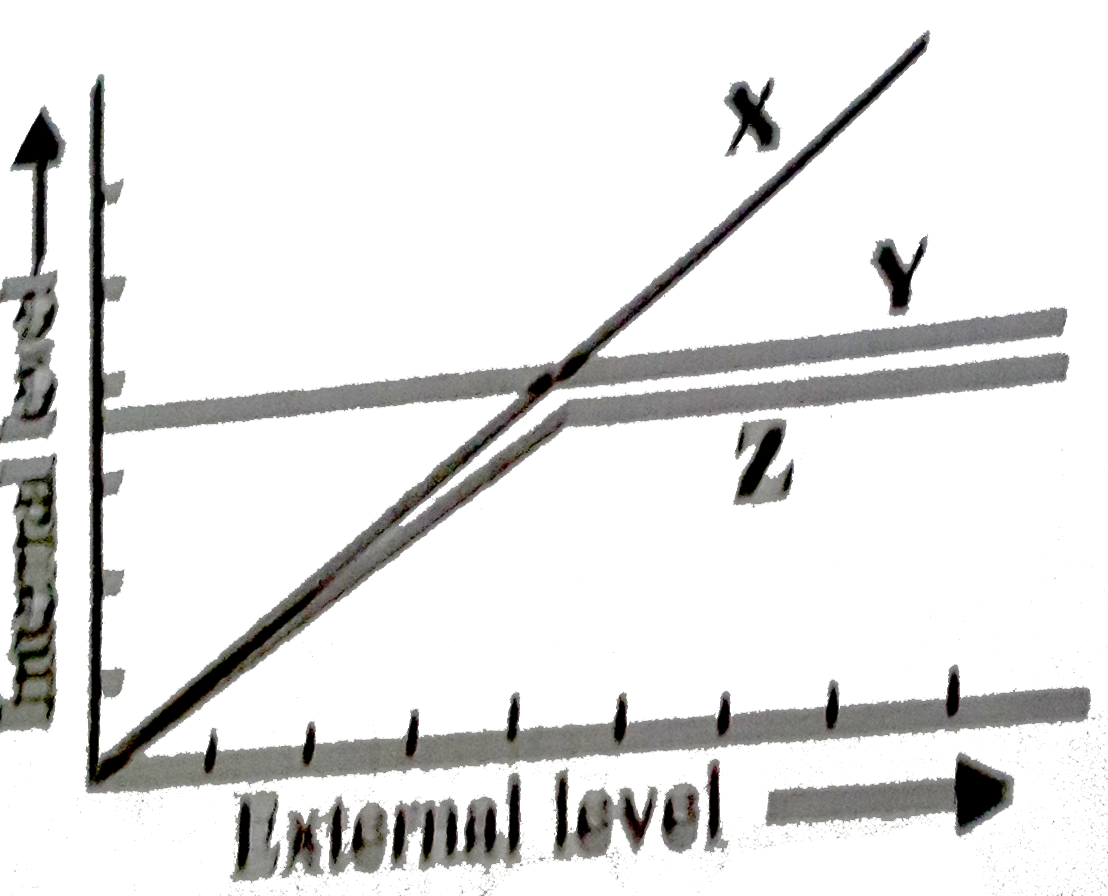
View SolutionThe given graph represents how three different living organisms (X,Y and Z) cope with the external environmental conditions. Study the graph and select the correct option regarding X,Y and Z.

View SolutionGiven figure represents the different zones of a lake or a pond.
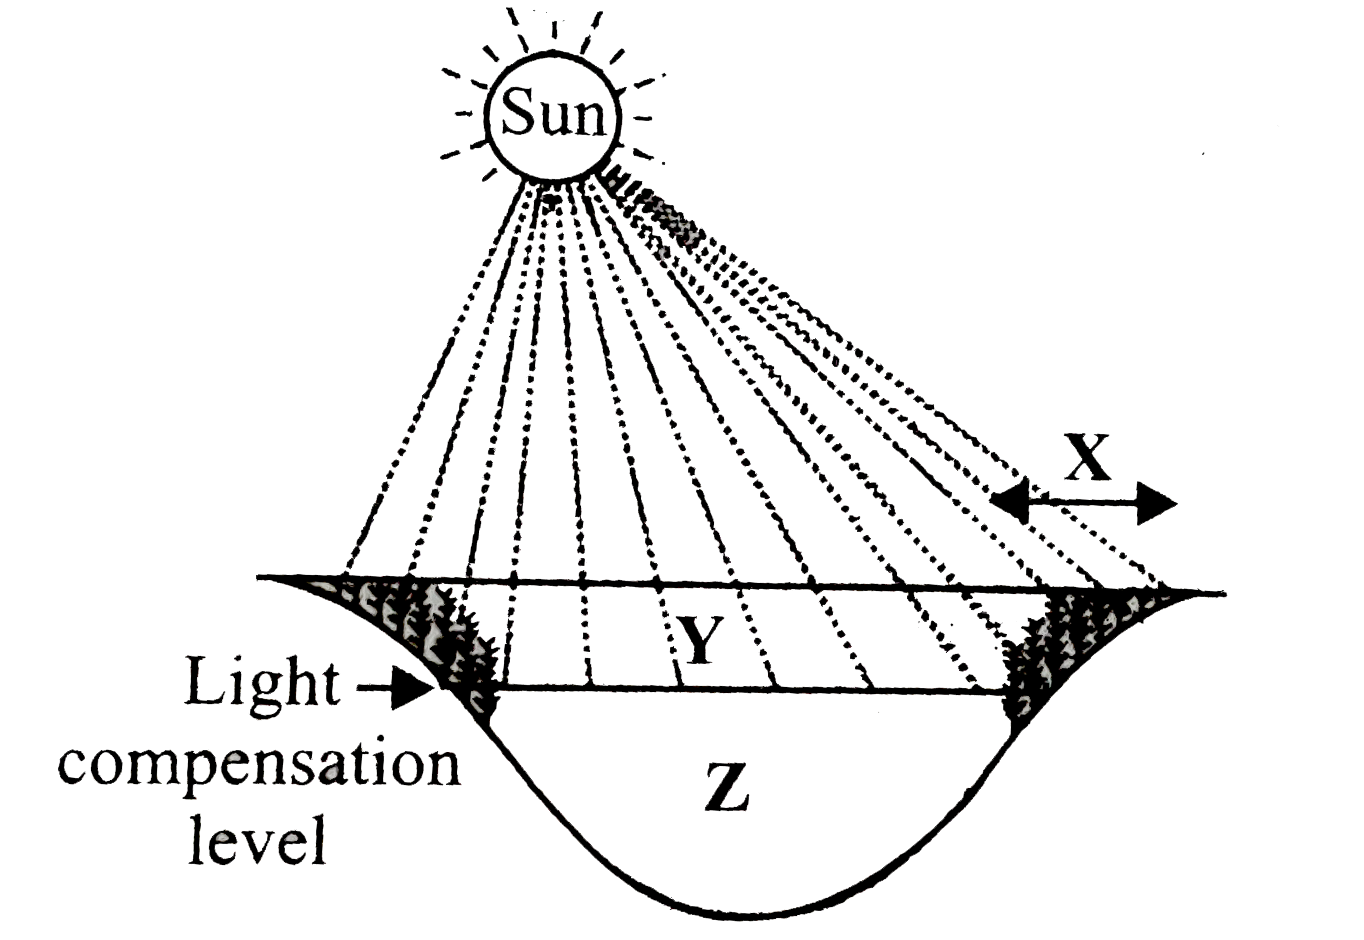
Identify the labelled parts X,Y and Z and select the correct statement.
View SolutionGiven figure represents the different zones of a lake or a pond.

Identify the labelled parts X,Y and Z and select the correct statement.
View Solution
