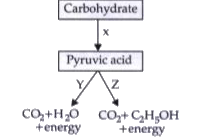
Study the given fkow chart and answer the following answers.
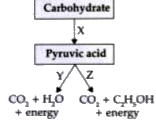
Identify X, Y and Z.
X-Glycolysis, Y-Anaerobic, Z-Aerobic
X-Krebs's cycle, Y-Aerobic, Z-Anaerobic
X-Glycolysis, Y- Aerobic, Z- Anaerobic
X-Glycolysis, Y - Aerobic, Z-Krebs's cycle
Step by step video & image solution for Study the given fkow chart and answer the following answers. Identify X, Y and Z. by Biology experts to help you in doubts & scoring excellent marks in Class 10 exams.
Updated on:21/07/2023Topper's Solved these Questions
- LIFE PROCESSESBOOK - OSWAL PUBLICATIONCHAPTER - LIFE PROCESSESEXERCISE - SELF-ASSESSMENT-1 (I. OBJECTIVE TYPE QUESTION) (C. ASSERTION AND REASON TYPE QUESTIONS)
5 Videos
- LIFE PROCESSESBOOK - OSWAL PUBLICATIONCHAPTER - LIFE PROCESSESEXERCISE - SELF-ASSESSMENT-1 (II. SHORT ANSWER TYPE QUESTIONS) (D. VERY SHORT ANSWER TYPE QUESTION)
3 Videos
- LIFE PROCESSESBOOK - OSWAL PUBLICATIONCHAPTER - LIFE PROCESSESEXERCISE - SELF-ASSESSMENT-1 (I. OBJECTIVE TYPE QUESTION) (A. MULTIPLE CHOICE QUESTION)
3 Videos
- HOW DO ORGANISMS REPRODUCE ?BOOK - OSWAL PUBLICATIONCHAPTER - HOW DO ORGANISMS REPRODUCE ?EXERCISE - CREATING BASED QUESTIONS
6 Videos
- MANAGEMENT OF NATURAL RESOURCES BOOK - OSWAL PUBLICATIONCHAPTER - MANAGEMENT OF NATURAL RESOURCES EXERCISE - CASE-BASED MCQs
15 Videos
Similar Questions
Knowledge Check
Study the diagram and answer the following
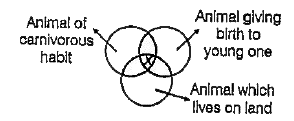
What is 'X' then?ADeerBLionCCatDNone of theseIn the given pie-chart, the comaprative study of the production or Rice, Wheat, Sugar and Tea of a country is given. Study the pie-chart and answer the following questions.
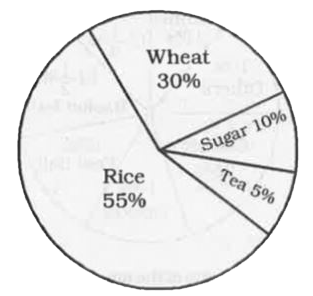
The production of rice and tea is more / greater than production of wheat byA50%B100%C75%D66.6%Observe the following flow chart and identify .X. and .Y..
 ACoal gas, coal tarBCoke, coal gasCCoke, coal tarDAmmonia, naphthalene
Study the diagram given below and answer the following questions.
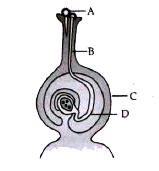
View SolutionStudy the given pedigree chart and answer the given questions :-
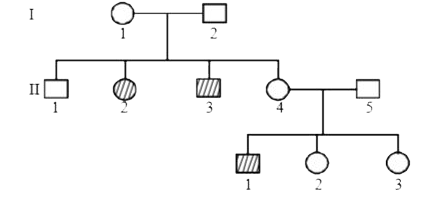
View SolutionStudy the given pedigree chart and answer the given questions :-
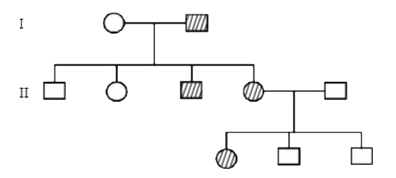
View SolutionThe following Bar chart shows the sales of a company XYZ (in Rs Crore). Study the chart and answer the following questions.
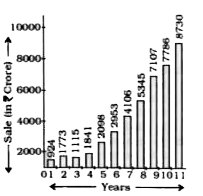
The mean of the highest and the lowest sale (in Rs Crore) is :
View SolutionIn the given pie-chart, the comaprative study of the production or Rice, Wheat, Sugar and Tea of a country is given. Study the pie-chart and answer the following questions.
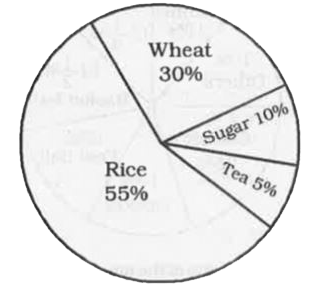
The central angle of percentage of wheat is
View Solution

