In the given pie-chart, the comaprative study of the production or Rice, Wheat, Sugar and Tea of a country is given. Study the pie-chart and answer the following questions.
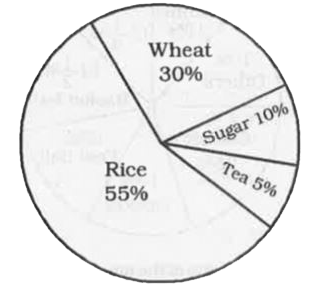
The central angle of percentage of wheat is
48∘
98∘
110∘
108∘
The correct Answer is:D
Step by step video, text & image solution for In the given pie-chart, the comaprative study of the production or Rice, Wheat, Sugar and Tea of a country is given. Study the pie-chart and answer the following questions. The central angle of percentage of wheat is by Maths experts to help you in doubts & scoring excellent marks in Class 14 exams.
Topper's Solved these Questions
- BOOK - KIRAN PUBLICATIONCHAPTER - STATISTICS AND DATA INTERPRETATIONEXERCISE - TYPE-VIII8videos
STATISTICS AND DATA INTERPRETATION
- BOOK - KIRAN PUBLICATIONCHAPTER - STATISTICS AND DATA INTERPRETATIONEXERCISE - TYPE-VI86videos
STATISTICS AND DATA INTERPRETATION
- BOOK - KIRAN PUBLICATIONCHAPTER - SIMPLIFICATIONEXERCISE - TEST YOURSELF25videos
SIMPLIFICATION
- BOOK - KIRAN PUBLICATIONCHAPTER - TIME AND DISTANCEEXERCISE - Type -XI74videos
TIME AND DISTANCE
Similar Questions
Study the pie-chart and answer the questions.
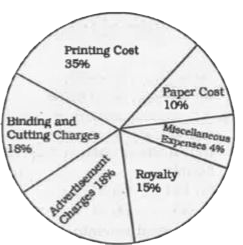
The central angle for the sector on "Paper-Cost" isView SolutionThe pie chart shows the value of the total annual production of dry fruits of a country. Study the diagram and answer the following questions.
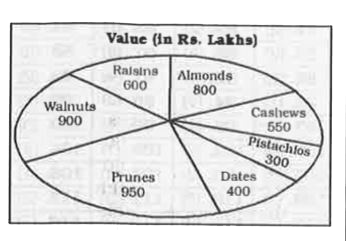
The measure of the central angle of the sector representing the annual production of dates is ______ degrees.View Solution
Knowledge Check
- Question 1 - Select One
In the given pie-chart, the comaprative study of the production or Rice, Wheat, Sugar and Tea of a country is given. Study the pie-chart and answer the following questions.
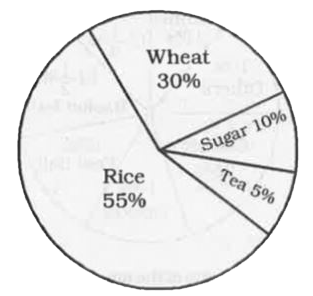
The production of rice and tea is more / greater than production of wheat byA50%B100%C75%D66.6% - Question 2 - Select One
In the given pie-chart, the comaprative study of the production or Rice, Wheat, Sugar and Tea of a country is given. Study the pie-chart and answer the following questions.
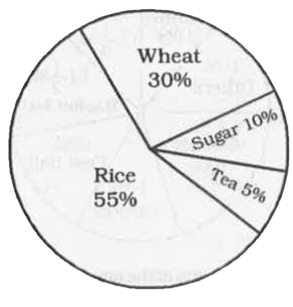
From this diagram, the ratio of sum of wheat and sugar production to difference in production of rice and tea isA4:5B5:4C6:1D1:6 - Question 3 - Select One
The following questions arfe based on the pie-chart given below. Study the pie-chart and answer the questions.
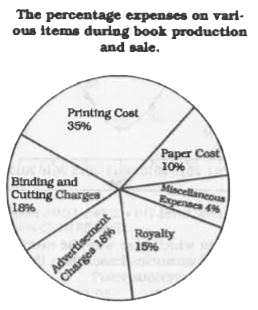
The central angle for the sector on ''Paper-Cost'' isA221(2)∘B16∘C54.8∘D36∘
The pie chart shows the value of the total annual production of dry fruits of a country. Study the diagram and answer the following questions.

The measure of the central angle of the sector representing the annual production of dates is ______ degrees.View SolutionThe pie chart shows the value of the total annual agricultural production of a country. Study the diagram and answer the following questions.
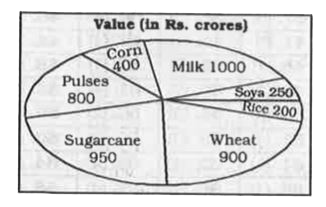
The measured of the central angle of the sector representing the production of milk is ____ degrees.View SolutionThe pie chart shows the number of tigers in all the tiger wild life santuaries in the country. Study the diagram and answer the following questions.
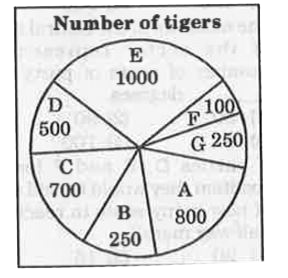
The measure of central angle of the sector representing the number of tigers in santuary E is ____ degrees.View SolutionThe pie chart shows the contribution of all the sectors towards the GDP of the economy of a certain country. Study the diagram and answer the following questions.
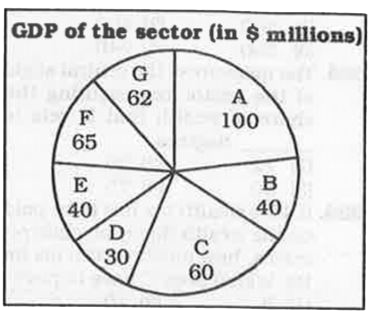
The measure of the central angle of the sector representing D is ____ degrees.View SolutionThe pie chart shows the value of the total annual agricultural production of a country. Study the diagram and answer the following questions.

The measured of the central angle of the sector representing the production of milk is ____ degrees.View Solution
