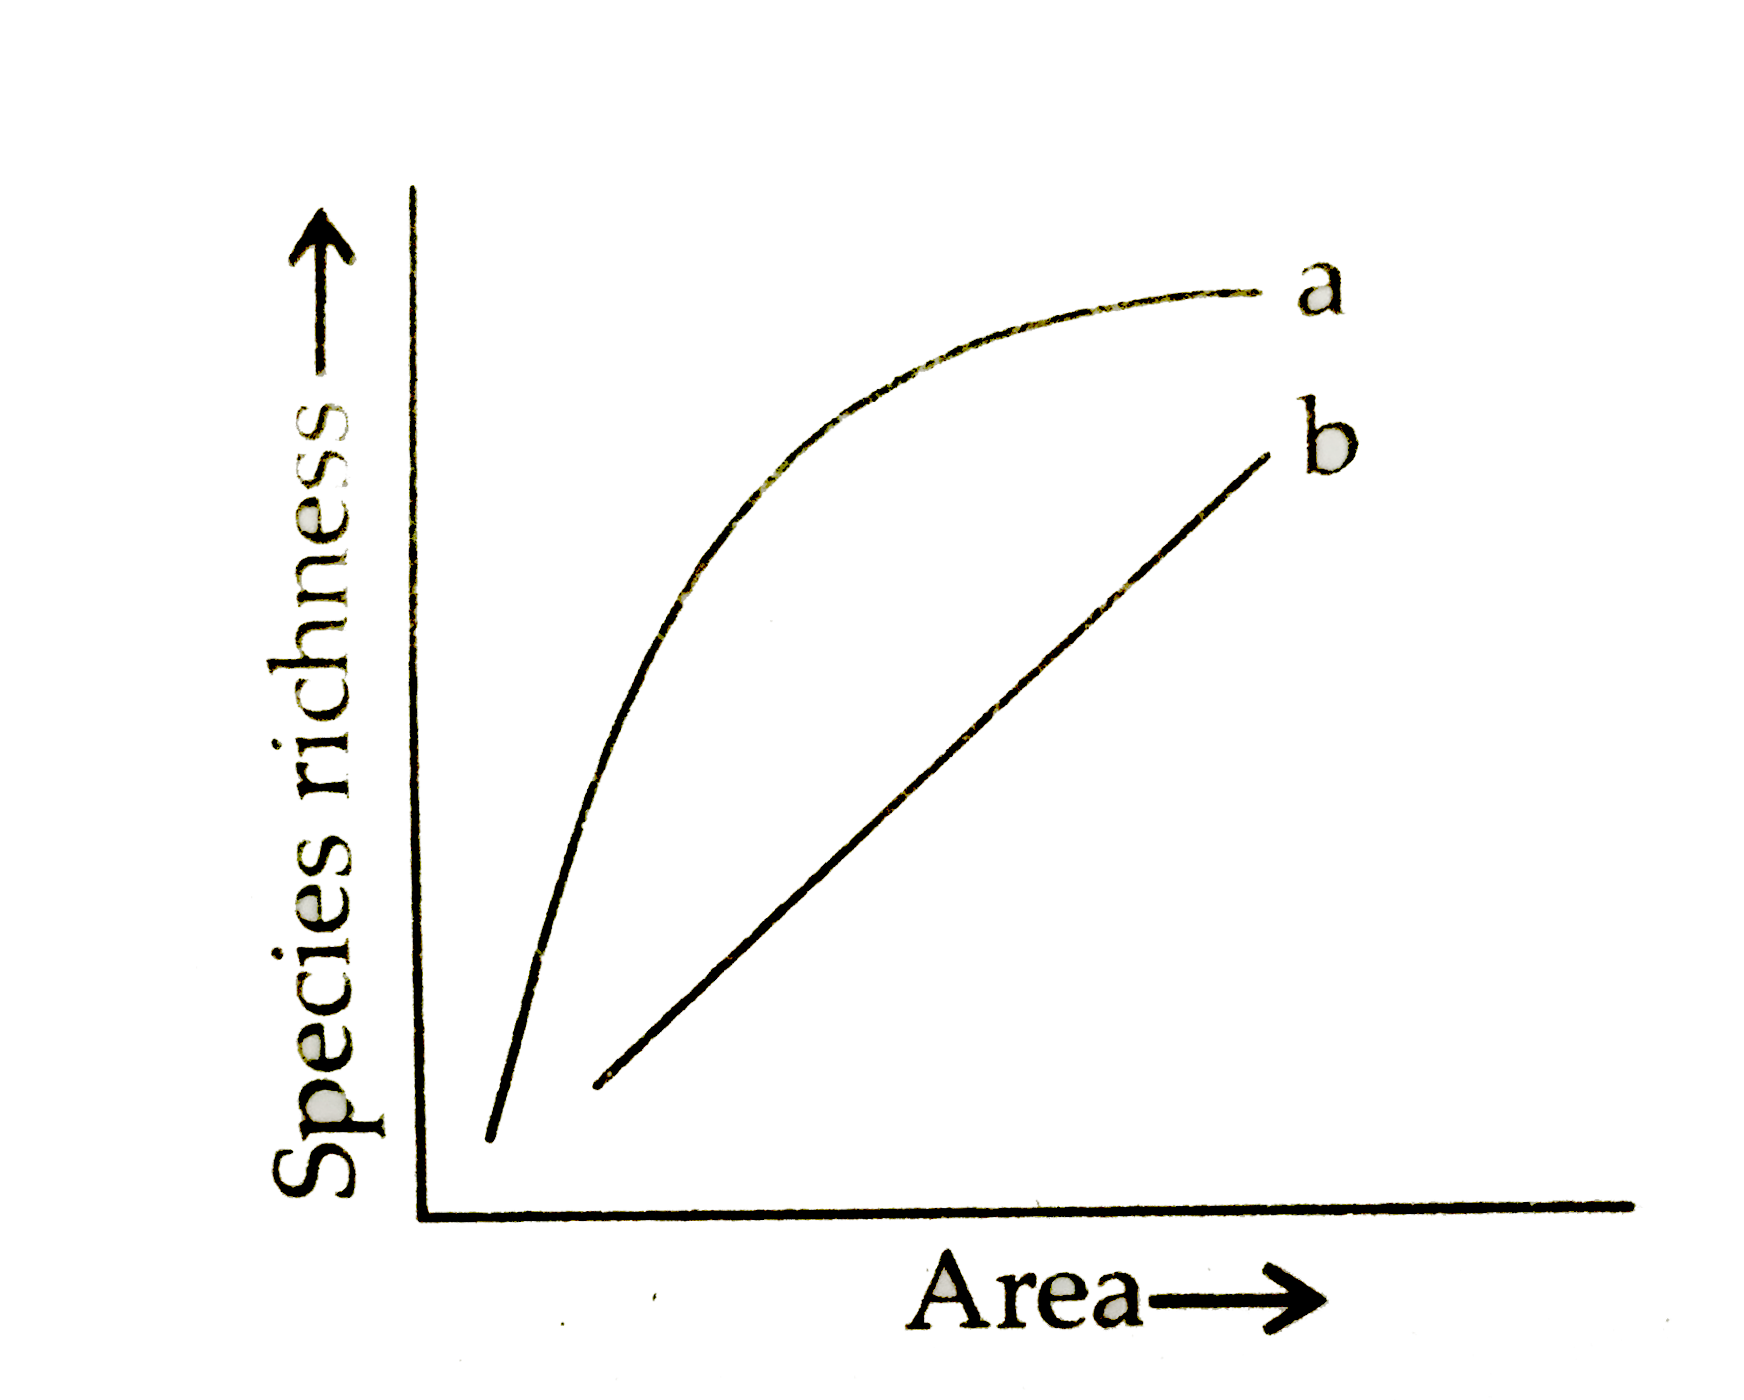
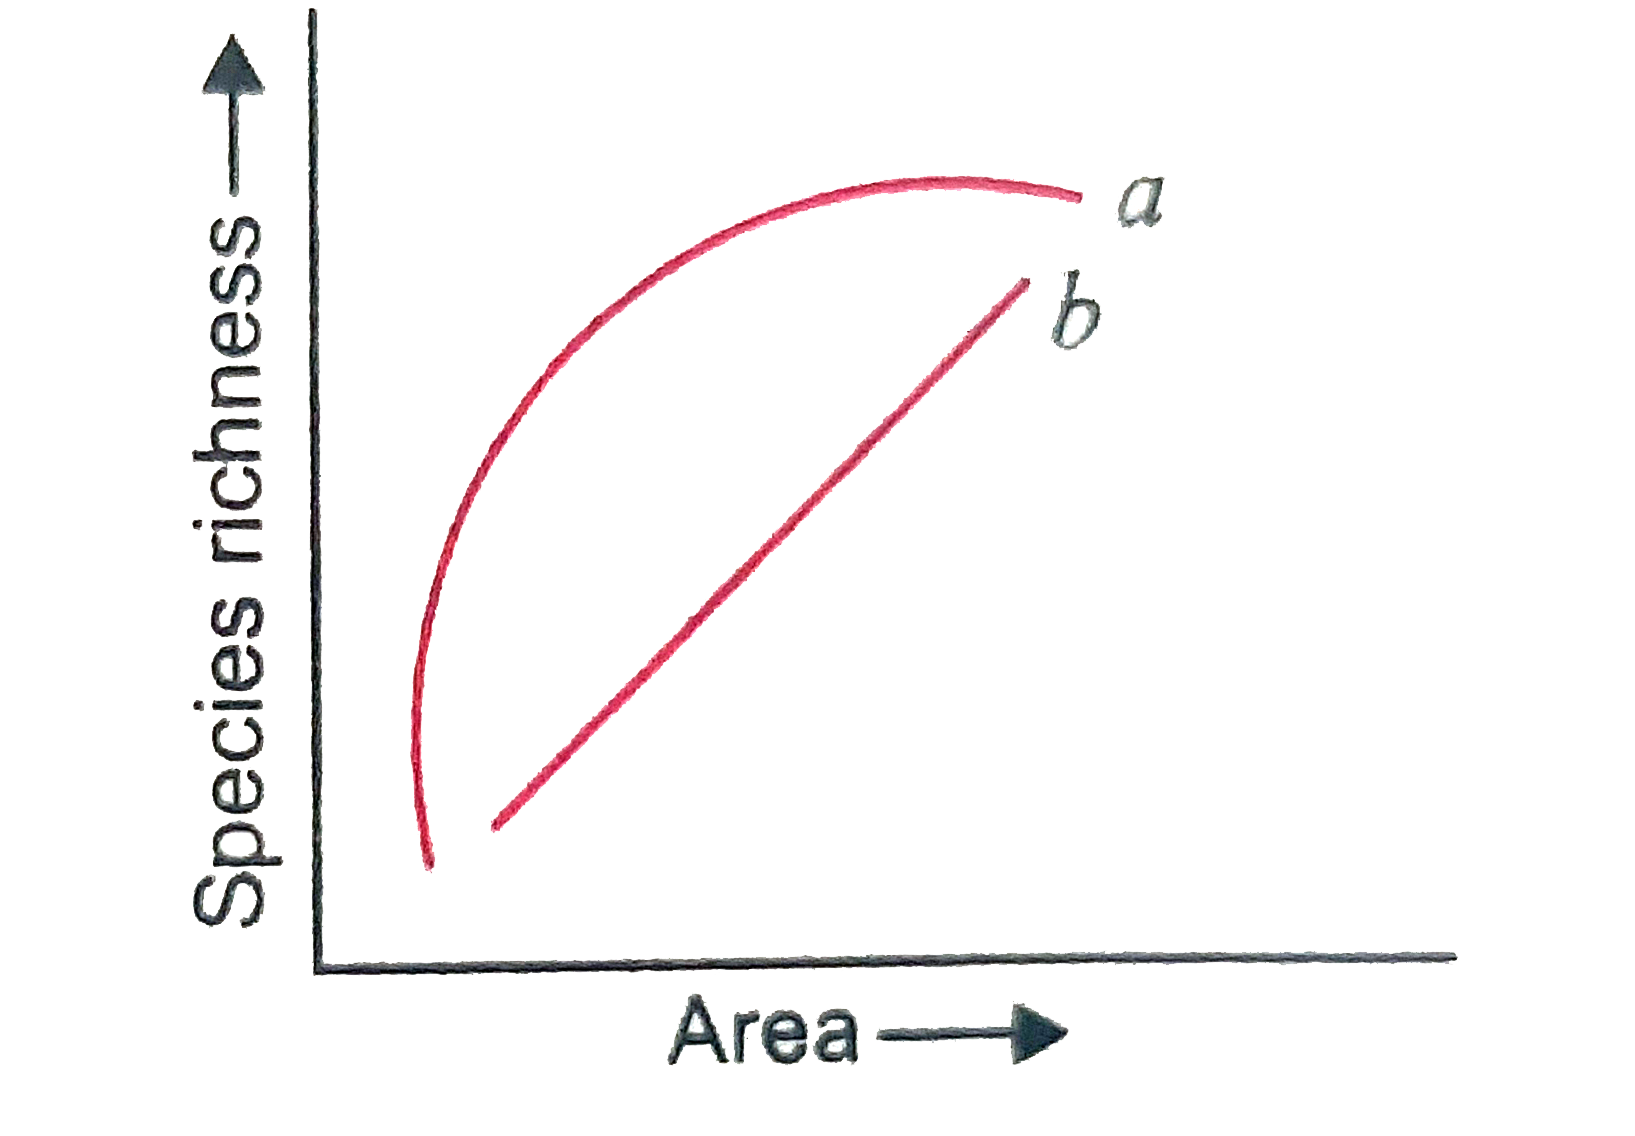
The above graph show Species-Area relationship. Write the equation of the curve a and explain.

Text Solution
On a log scale, the relationship becomes linear (Straight line) and is described equation
log S log C+Z log A
where
S = speices Richness
Z = slope of the line (regression cofficient )
A area
C= y- intercept
Ecologists have found out that the value of Z line ranges between 0.1 and 0.2 irrespective of the taxonomic group or the regio
this analysis in very large area like a continent, the Z value ranges between 0.6 and 1.2. The Z value for frugivorous birds and mammals in the tropical forest is found to be 1.15
|
Updated on:21/07/2023
Topper's Solved these Questions
- BOOK - XII BOARDS PREVIOUS YEARCHAPTER - XII BOARDSEXERCISE - SET-II44videos
XII BOARDS
- BOOK - XII BOARDS PREVIOUS YEARCHAPTER - XII BOARDSEXERCISE - SET-III57videos
XII BOARDS
- BOOK - XII BOARDS PREVIOUS YEARCHAPTER - XII BOARDSEXERCISE - C.B.S.E CLASS XII31videos
XII BOARDS
- BOOK - XII BOARDS PREVIOUS YEARCHAPTER - SAMPLE PAPER 2019EXERCISE - Section E Part B3videos
SAMPLE PAPER 2019
Similar Questions
Knowledge Check
- Question 1 - Select One
Species-Area relationship was given by
ABritish zoologist and geographer David TilmanBGerman botanist and geographer Alexander von HumboldtCGerman naturalist and geographer Alexander von HumboldtDBritish naturalist and geographer Alexander von Huboldt - Question 2 - Select One
Species area relationship was given by
AAlexander von HumboldtBPaulCMayerDBoth (a) and (b) - Question 3 - Select One
Species area relationship was given by :-
ARobert constranzaBAlexander von humboldtCAlexander flemmingDStamford ecologist Paul Ehrlich
According to the concept of species-area relationship.
View SolutionThe hyperbolic equation for the species area relationship is
View SolutionAccording to the concept of species-area relationship.
View SolutionThe hyperbolic equation for the species area relationship is
View SolutionIn the equation of species-area relationship, the letter 'C' and 'Z' represent
View Solution


