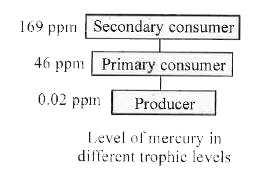
The data collected from a water body located near an industry is displayed in the figure . Analyse the data.

a. Explain the observed differences in the levels of mercury between primary and secondary consumers.
b. Mention the health problem associated with the consumption of fish captured fromd this water body.Solution in Tamil
a. Primary consumers obtain their foodi directly from the producers and they gt 46 ppm mercury level in their body . The secondary consume the primary consumers as their food, they get high level of merury , i.e., 169 ppm level in their body. A re-markable difference of mercury level , i.e., 123 ppm is observed in the secondary consumer.s body .
b. Suppose that man is the tertiary consumer here . When he eats the secondary or primary consumers , he will be affected by minamata disease ( Mercury poisoning).
Topper's Solved these Questions
- ENVIRONMENTAL ISSUES BOOK - NEW JOYTHI PUBLICATIONCHAPTER - ENVIRONMENTAL ISSUES EXERCISE - PREVIOUS ENTRANCE EXAM CORNER
30 Videos
- ENVIRONMENTAL ISSUES BOOK - NEW JOYTHI PUBLICATIONCHAPTER - ENVIRONMENTAL ISSUES EXERCISE - CBSE CORNER
8 Videos
- ENVIRONMENTAL ISSUES BOOK - NEW JOYTHI PUBLICATIONCHAPTER - ENVIRONMENTAL ISSUES EXERCISE - NEW EVALUATION TYPE QUESTIONS
20 Videos
- ECOSYSTEM BOOK - NEW JOYTHI PUBLICATIONCHAPTER - ECOSYSTEM EXERCISE - Continuous Evaluation (Project)
2 Videos
- EVOLUTION BOOK - NEW JOYTHI PUBLICATIONCHAPTER - EVOLUTION EXERCISE - Previous Year Competitive Exam Questions(MCQs)
50 Videos
Similar Questions
Sambar lake containing brackish water is located in.
View SolutionWhat would be the inpact on the environment around a thermal power plant if its electrostatic precipitator functioning ? Give a reason.
View SolutionName two important methods to control air pollution industries .
View SolutionStudy the different seral communities present in different ponds of your locality.
View SolutionWhat are the constituents of Miller's experiment?
View SolutionStatistical Data : Primary Data and Secondary Data.
View SolutionWhat are (i) primary data? (ii) secondary data? Which of the two -- the primary or the secondary data -- is more reliable and why?
View SolutionWhat are the differences between primary consumers and secondary consumers ?
View Solutionप्रग्रहण मत्स्यन, मेरी कल्चर तथा जल संवर्धन में क्या अंतर है?
View SolutionDifferentiate between primary and secondary data.
View SolutionWhy is it necessary to analyse the collected data?
View SolutionInternet primary or secondary method of data collection?
View SolutionHow do salt water fishes maintain the water and salt level in their body?
View Solutionप्राथमिक आँकड़ों एवं गौण आँकड़ों को उदाहरण देकर समझाइये।
View SolutionWhat are the differences between primary data and secondary data?
View Solution
