The diagram given here is the standard ECG of a normal person. The P-wave represents the

A
initiation of the ventricular contraction
B
beginning of the systole
C
end of systole
D
contraction of both the atria
Video Solution
Text Solution
The correct Answer is:D
|
Answer
Step by step video & image solution for The diagram given here is the standard ECG of a normal person. The P-wave represents the by Biology experts to help you in doubts & scoring excellent marks in Class 11 exams.
Updated on:21/07/2023Topper's Solved these Questions
- BODY FLUIDS AND CIRCULATIONBOOK - PRADEEPCHAPTER - BODY FLUIDS AND CIRCULATIONEXERCISE - Practice Questions (II. Assettion-Resson Type Questions)
11 Videos
- BODY FLUIDS AND CIRCULATIONBOOK - PRADEEPCHAPTER - BODY FLUIDS AND CIRCULATIONEXERCISE - Analytical Question With Answers
21 Videos
- BIOMOLECULES BOOK - PRADEEPCHAPTER - BIOMOLECULES EXERCISE - PRACTICE QUESTIONS (ASSERTION-REASON )
31 Videos
- BREATHING AND EXCHANGE OF GASES BOOK - PRADEEPCHAPTER - BREATHING AND EXCHANGE OF GASES EXERCISE - NOTABLE QUESTIONS
1 Videos
Similar Questions
Knowledge Check
In the standard ECG of a normal person, the P-wave represents the
Aatrial depolarisationBventricular depolarisationCatrial repolarisationDventricular repolarisationThe diagram given here is the representation of
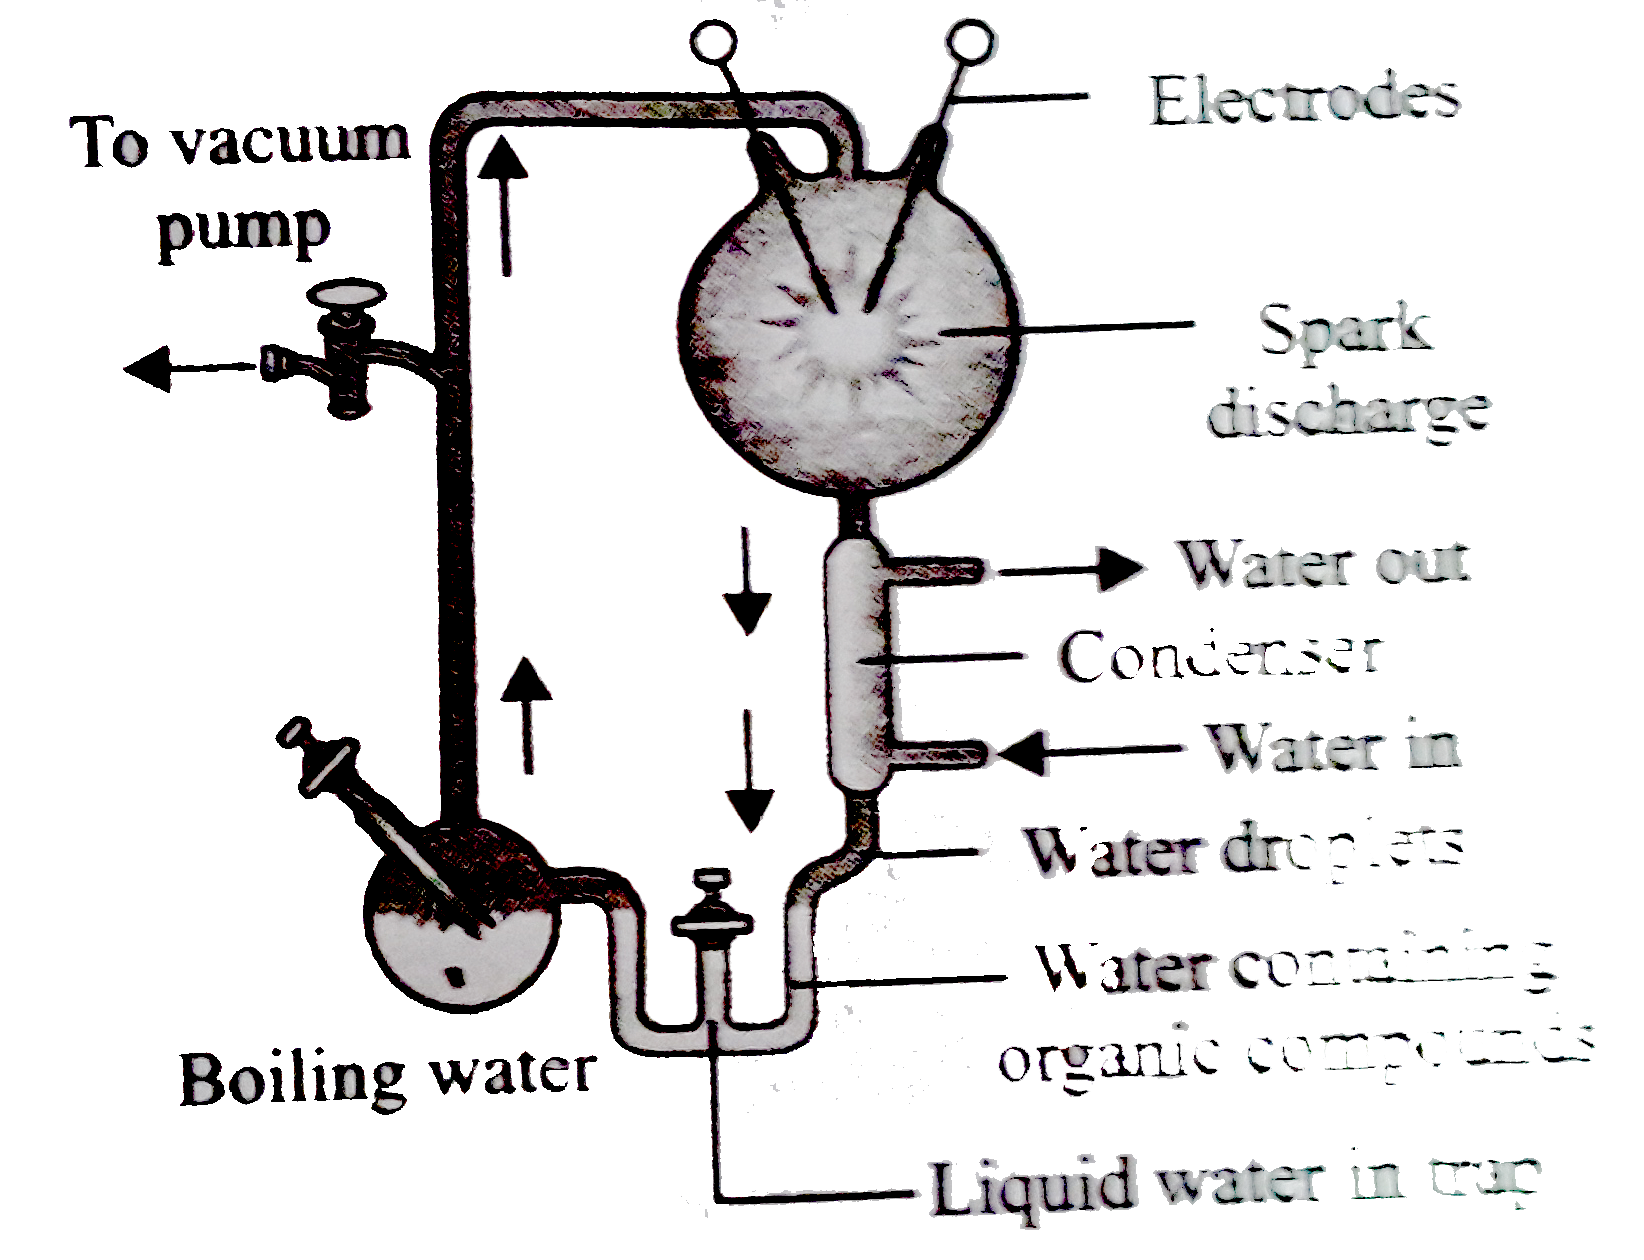
 AMiller's experimentBRedi's experimentCLouis pasteur's experimentDSpallanzani's experiment
The diagram given below represents
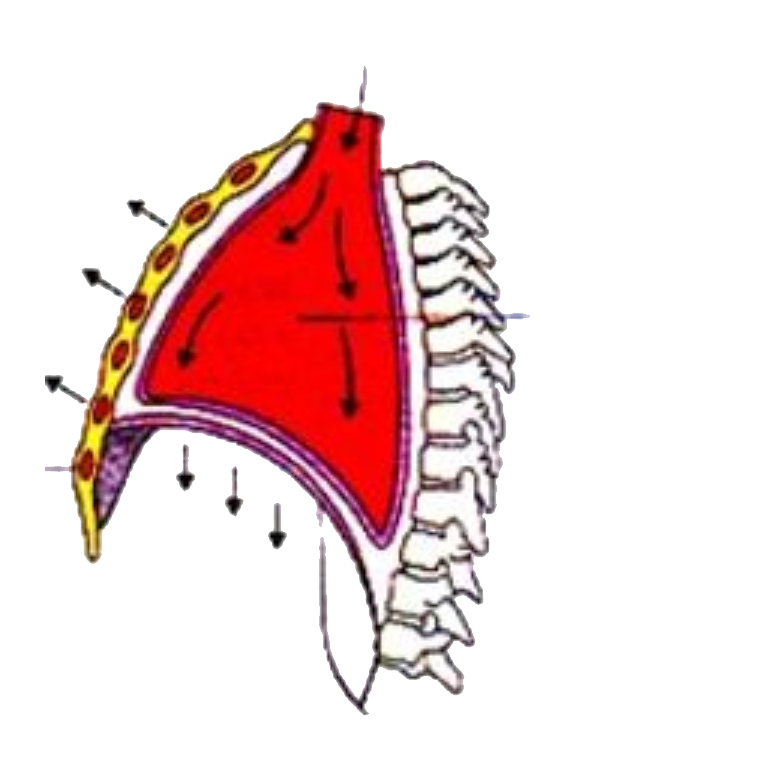
 AinspirationBexpirationCSystoleDdiastole

