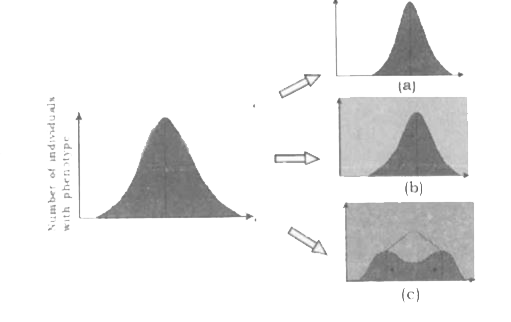
The diagrammatic representation shows the operation of natural selection. Give suitable heading for these curves.Solution in Tamil
a. Stabilising curve - More individuals acquire mean character value.
b. Directional curve - More individuals acquire value other than the mean character value.
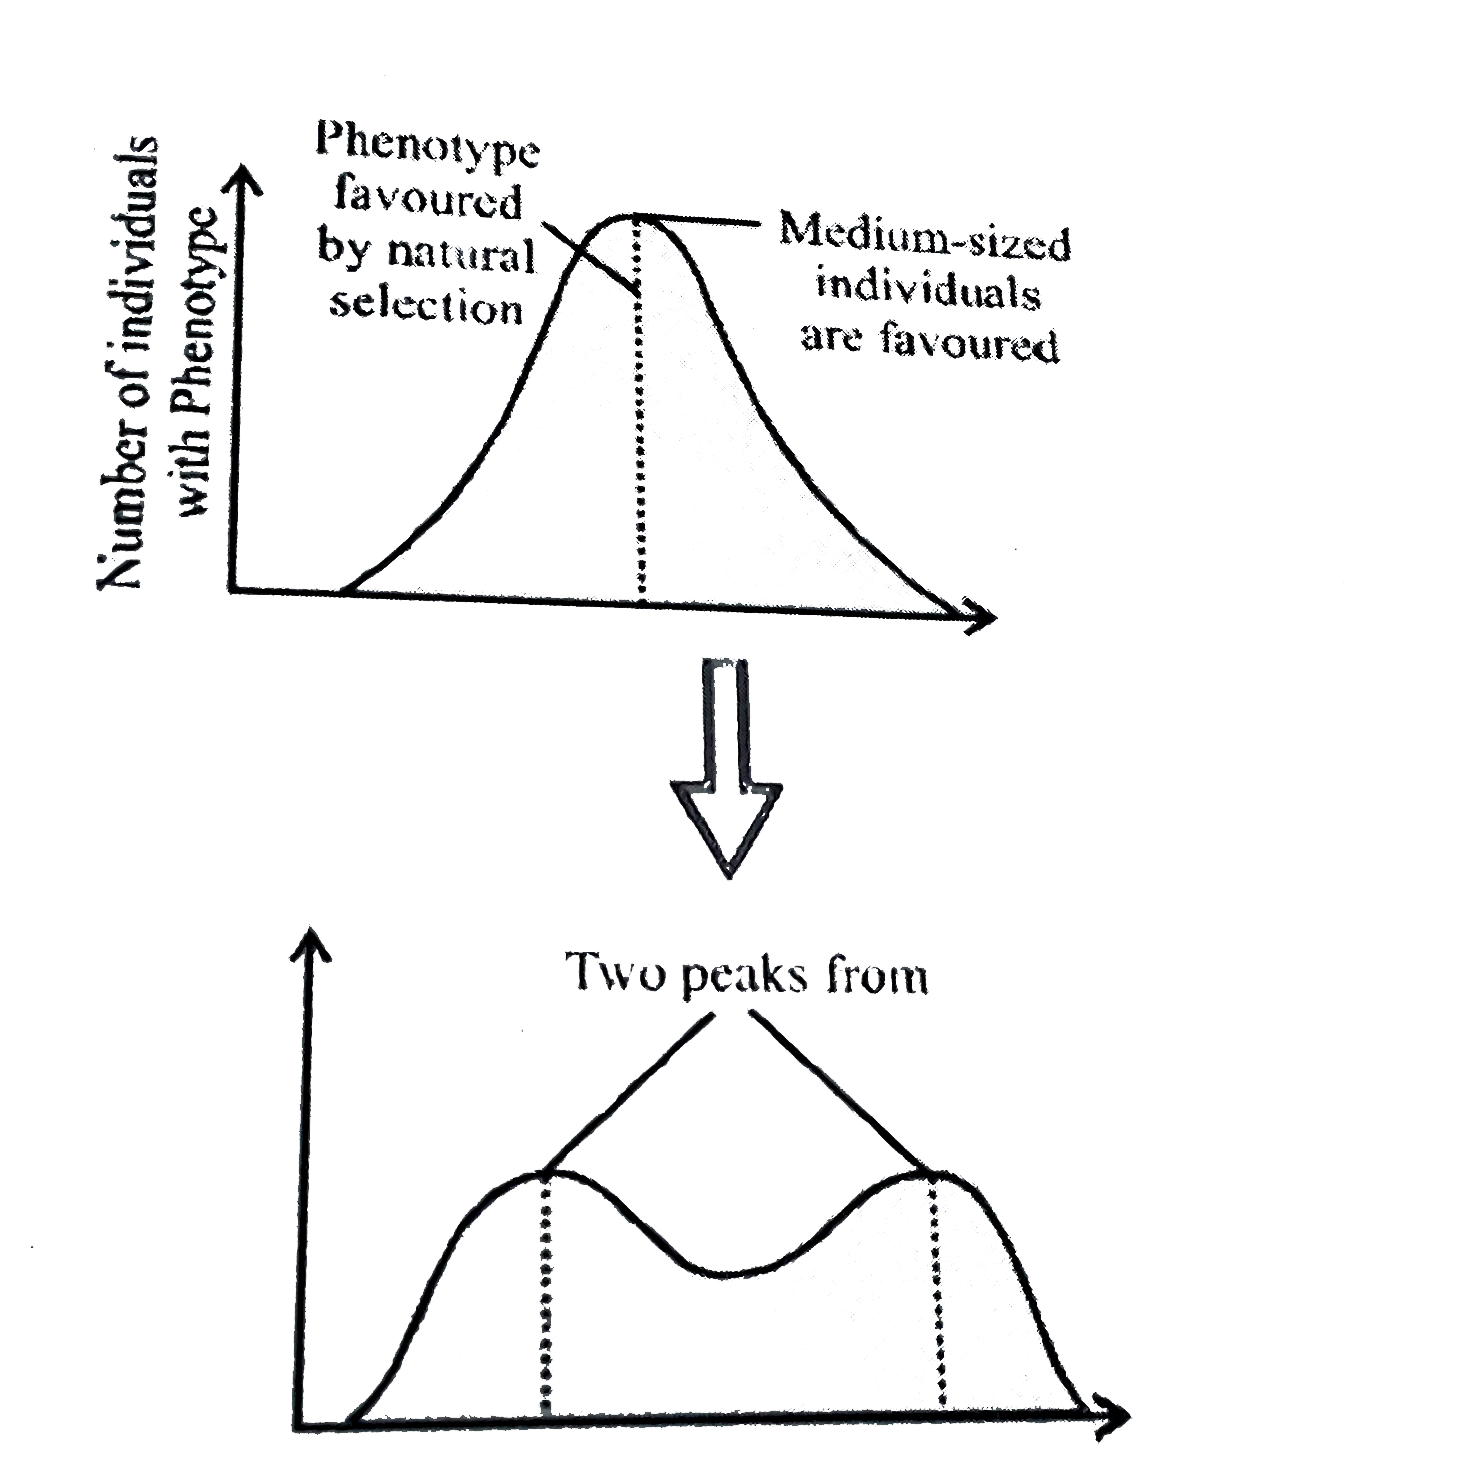
c. Disruptive curve - More individuals acquire peripheral character value at both ends of the distribution curve.
Topper's Solved these Questions
- EVOLUTION BOOK - NEW JOYTHI PUBLICATIONCHAPTER - EVOLUTION EXERCISE - Questions From Edumate
1 Videos
- EVOLUTION BOOK - NEW JOYTHI PUBLICATIONCHAPTER - EVOLUTION EXERCISE - Previous Year HSE Questions
3 Videos
- EVOLUTION BOOK - NEW JOYTHI PUBLICATIONCHAPTER - EVOLUTION EXERCISE - Previous Year Competitive Exam Questions(MCQs)
50 Videos
- ENVIRONMENTAL ISSUES BOOK - NEW JOYTHI PUBLICATIONCHAPTER - ENVIRONMENTAL ISSUES EXERCISE - CONTINUOUS EVALUTION (PROJECT)
2 Videos
- HUMAN HEALTH AND DISEASEBOOK - NEW JOYTHI PUBLICATIONCHAPTER - HUMAN HEALTH AND DISEASEEXERCISE - PREVIOUS YEAR COMPETITIVE EXAM QUESTIONS
28 Videos
Similar Questions
The given two pie diagrams show the population of Biston betularia(Grey) and Biston betularia varcarbonaria (Black) in industrial area of England during 1850's and 1950's.

a. What do you understand from the following pie diagrams?
Mention the evolutionary significance.
View SolutionArrange the following in a hierarchical manner based on the period of their evolution.
Homoerectus, Ramapithecus, Australopithecus, Homosapiens, Neanderthal man
View SolutionWhat are the constituents of Miller's experiment?
View SolutionEvolve a strategy for conserving water in your area.
View SolutionELISA is used to detect viruses where the key reagent is
View SolutionIn the given diagrammatic representation of operation of natural selection, identify a,b and c
View SolutionGive the diagrammatic representation of ETS.
View SolutionGive diagrammatic representation of pyramid of numbers.
View Solution
This diagrammatic representation shows which type of natural selection.
View SolutionSelect the option regarding this diagrammatic representation.
View SolutionGive diagrammatic representation of amitosis division.
View SolutionGive the diagrammatic representation of Miller's experiment.
View SolutionFollowing is the diagrammatic representation of the operation of natural selection on different traits. Which of the following options correctly identifies all the three graphs A, B and C.
View SolutionDiagrammatic representation of the operation of natural selection two peaks are formed. This condition shows effect of ...... (A) Disruptive (B) Directional (C) Stabilizing (D) Distractive
View SolutionGive a diagrammatic representation of Rainbow production
View Solution
