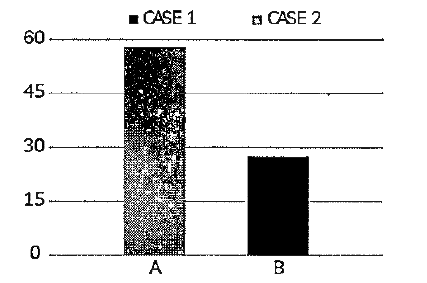
The figure shows a graph where A represents adenylate residues and B represents Methyl guanosine triphosphate molecules. Which of these cases will undergo immediate Capping and which one will undergo Tailing?
A
Case 1: Capping, Case 2: Tailing
B
Case 1: Tailing, Case 2: Capping
C
Case 1 and Case 2 Capping
D
Case 1 and Case 2 Tailing
Text Solution
The correct Answer is:A
Case 1 : Capping, Case 2: Tailing Explaination: Case 1- will undergo Capping while Case 2 will undergo Tailing. hnRNA undergoes additional processing called as capping and tailing. In capping an unusual nucleotide (methyl guanosine triphosphate) is added to the 5. -end of hnRNA. In tajling. adenylate residues (200-300) are added at 3. -end in a template independent manner.
|
Topper's Solved these Questions
Similar Questions
Knowledge Check
Which one of the following graphs represents motion?
A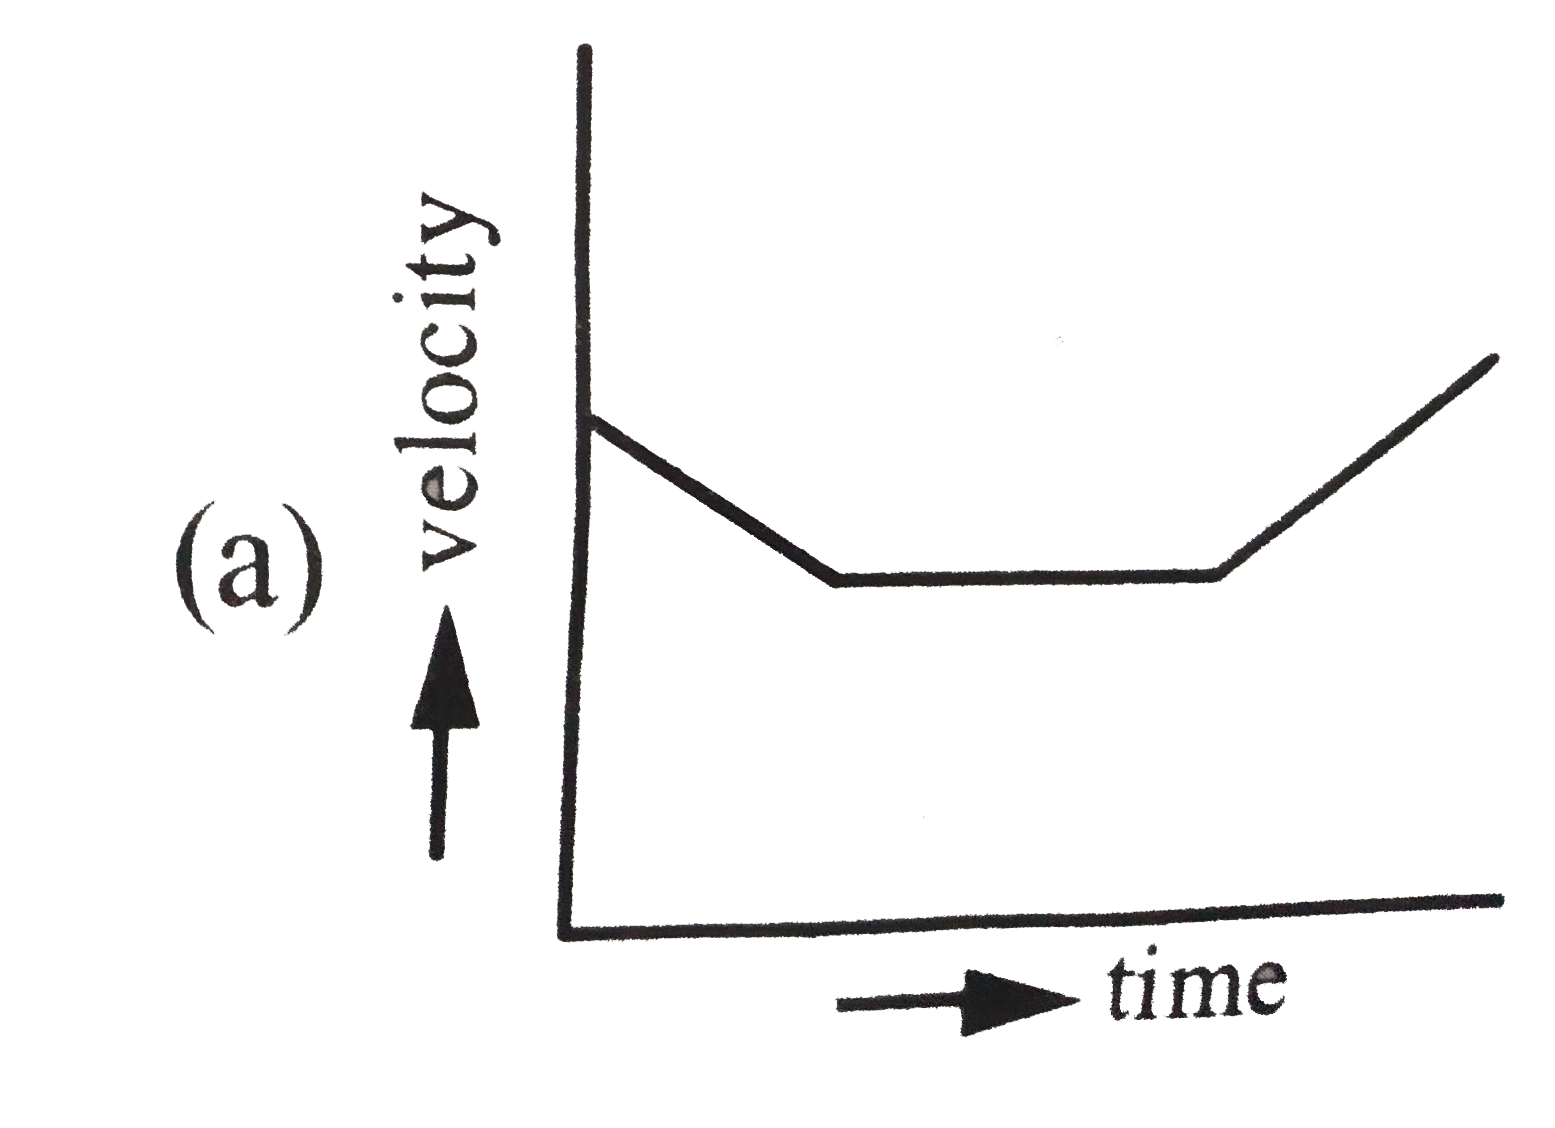 B
B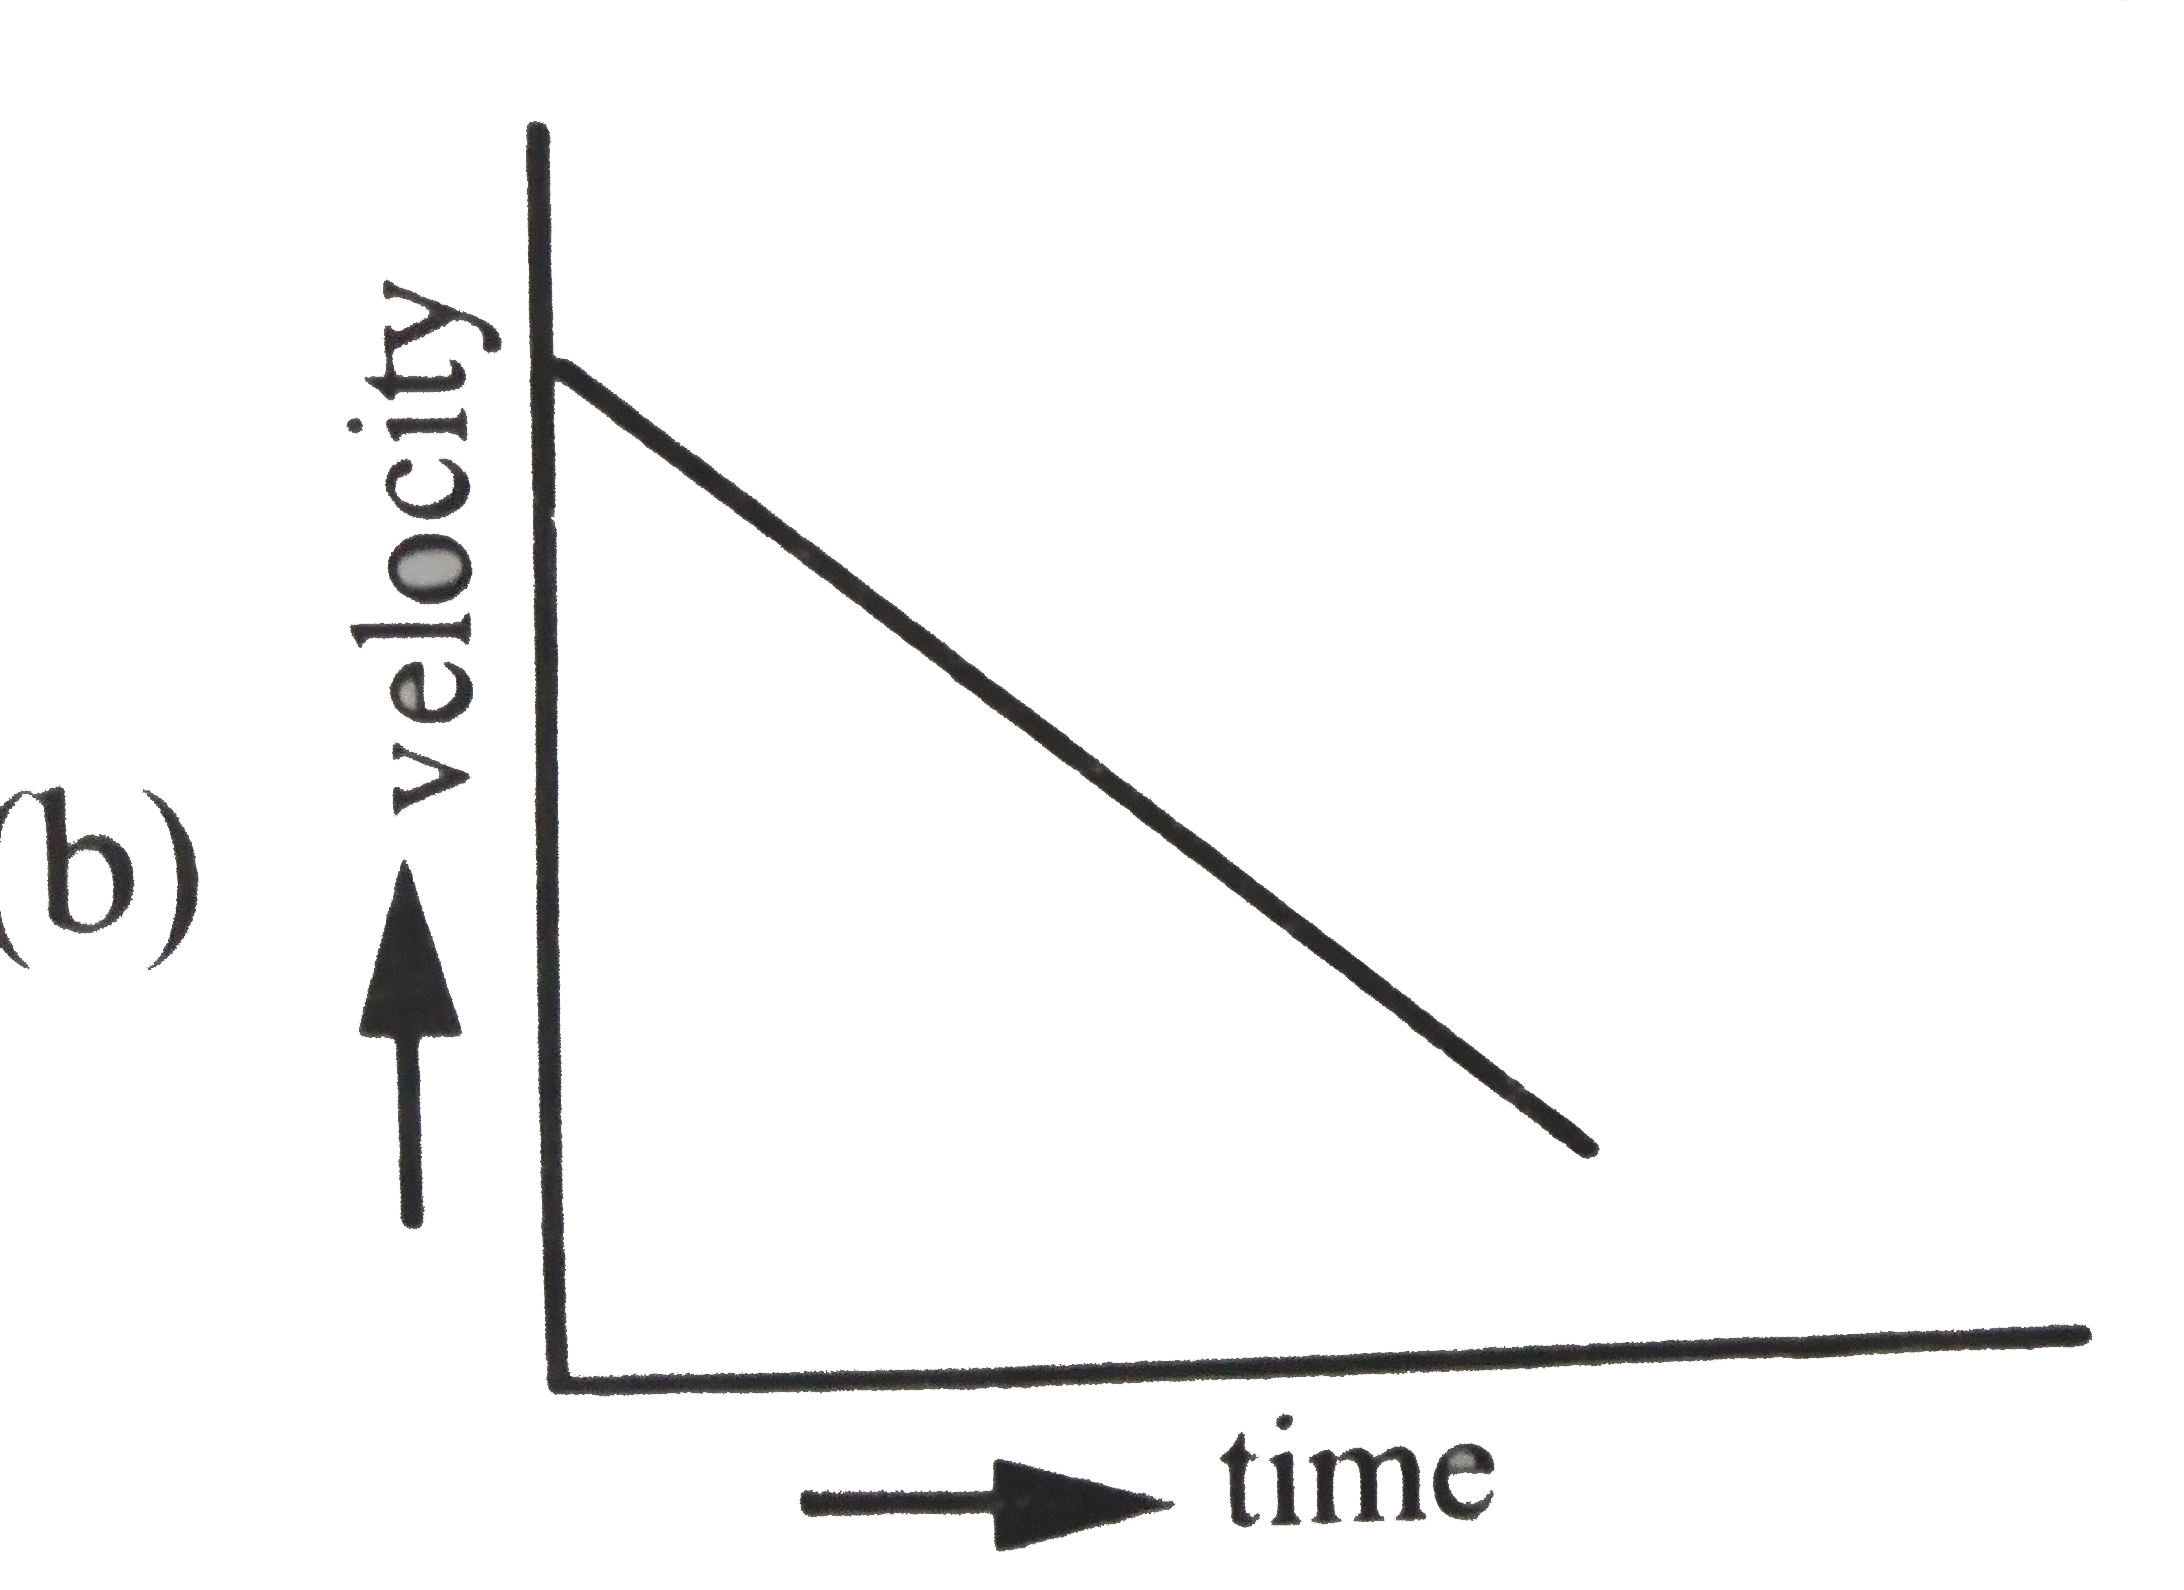 C
C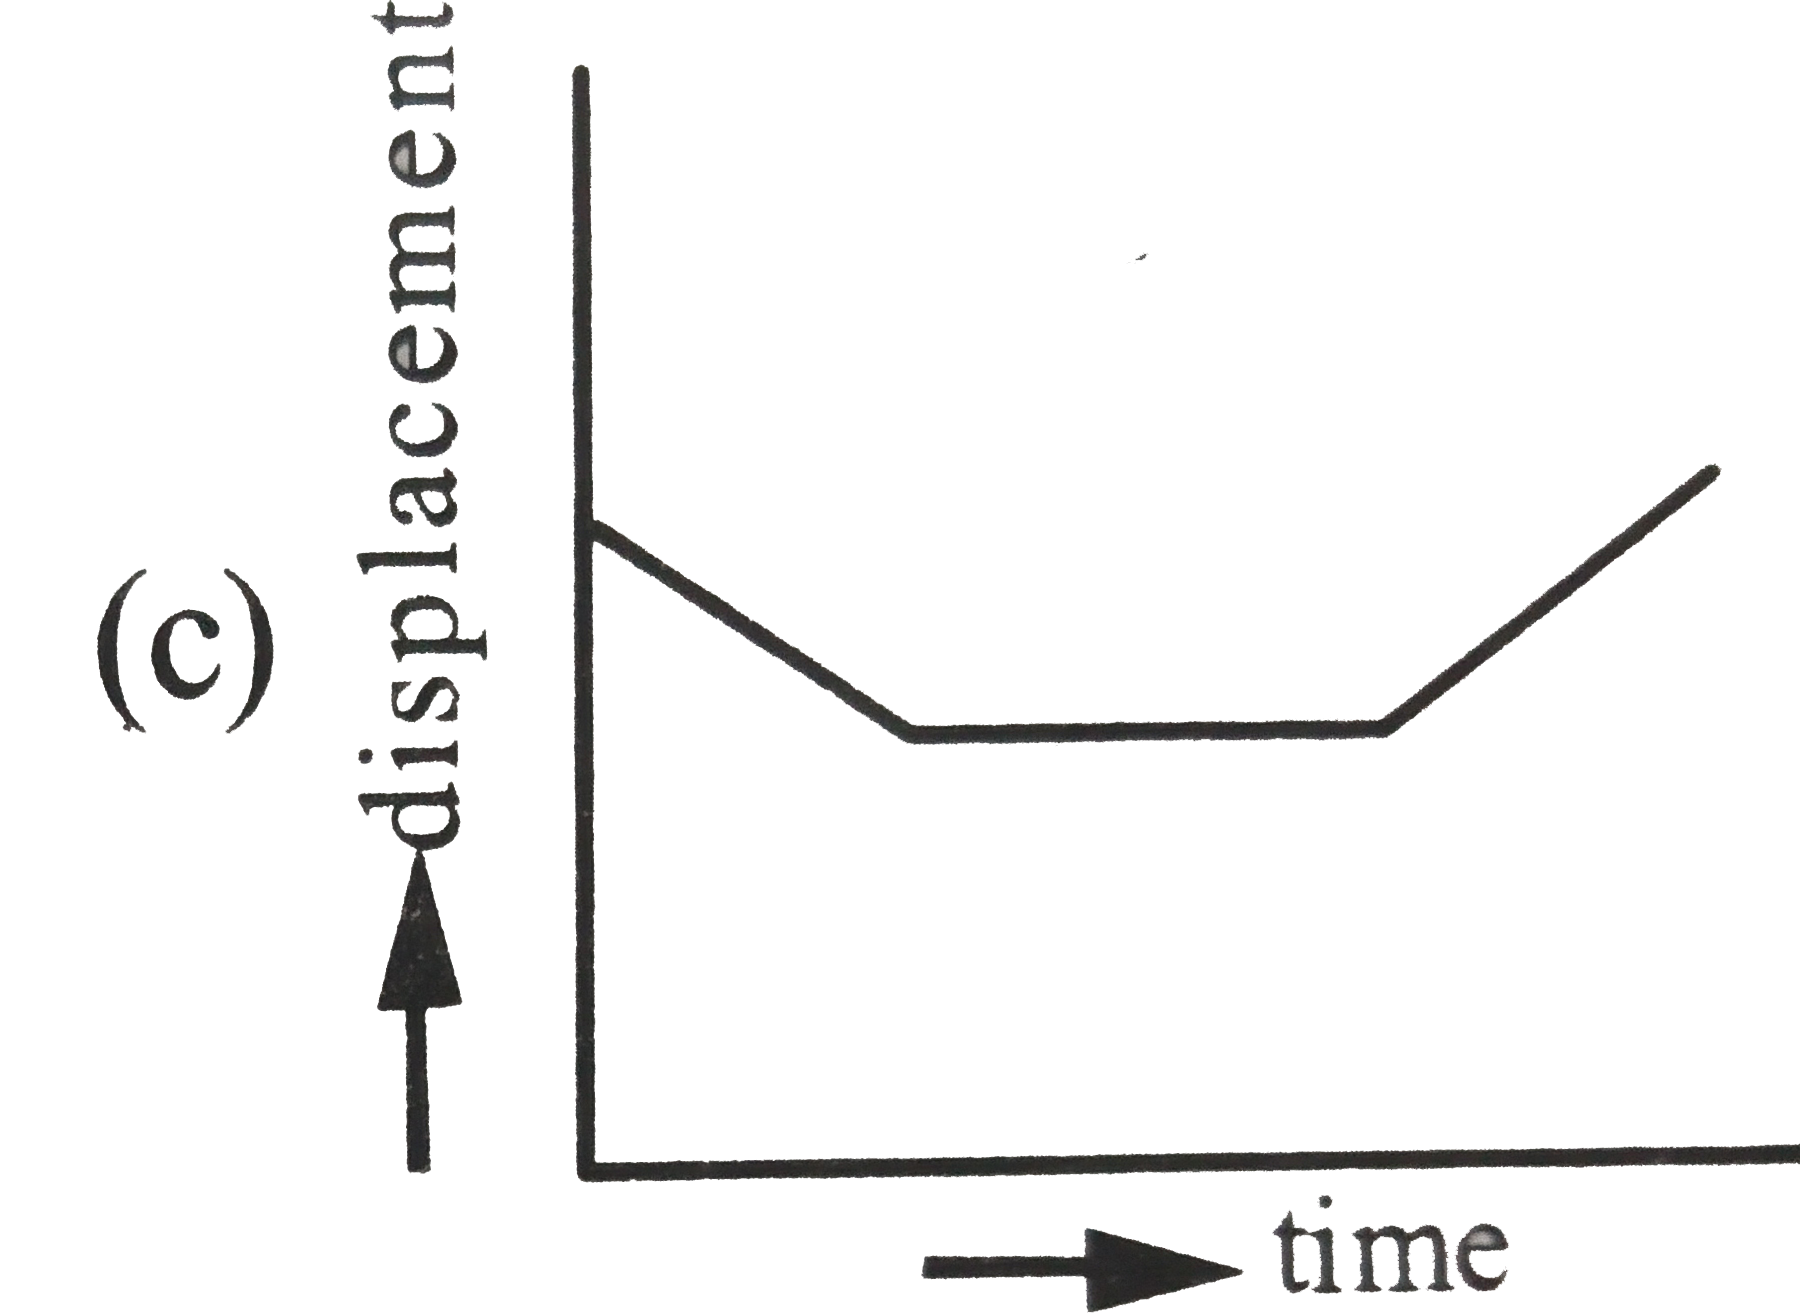 D
D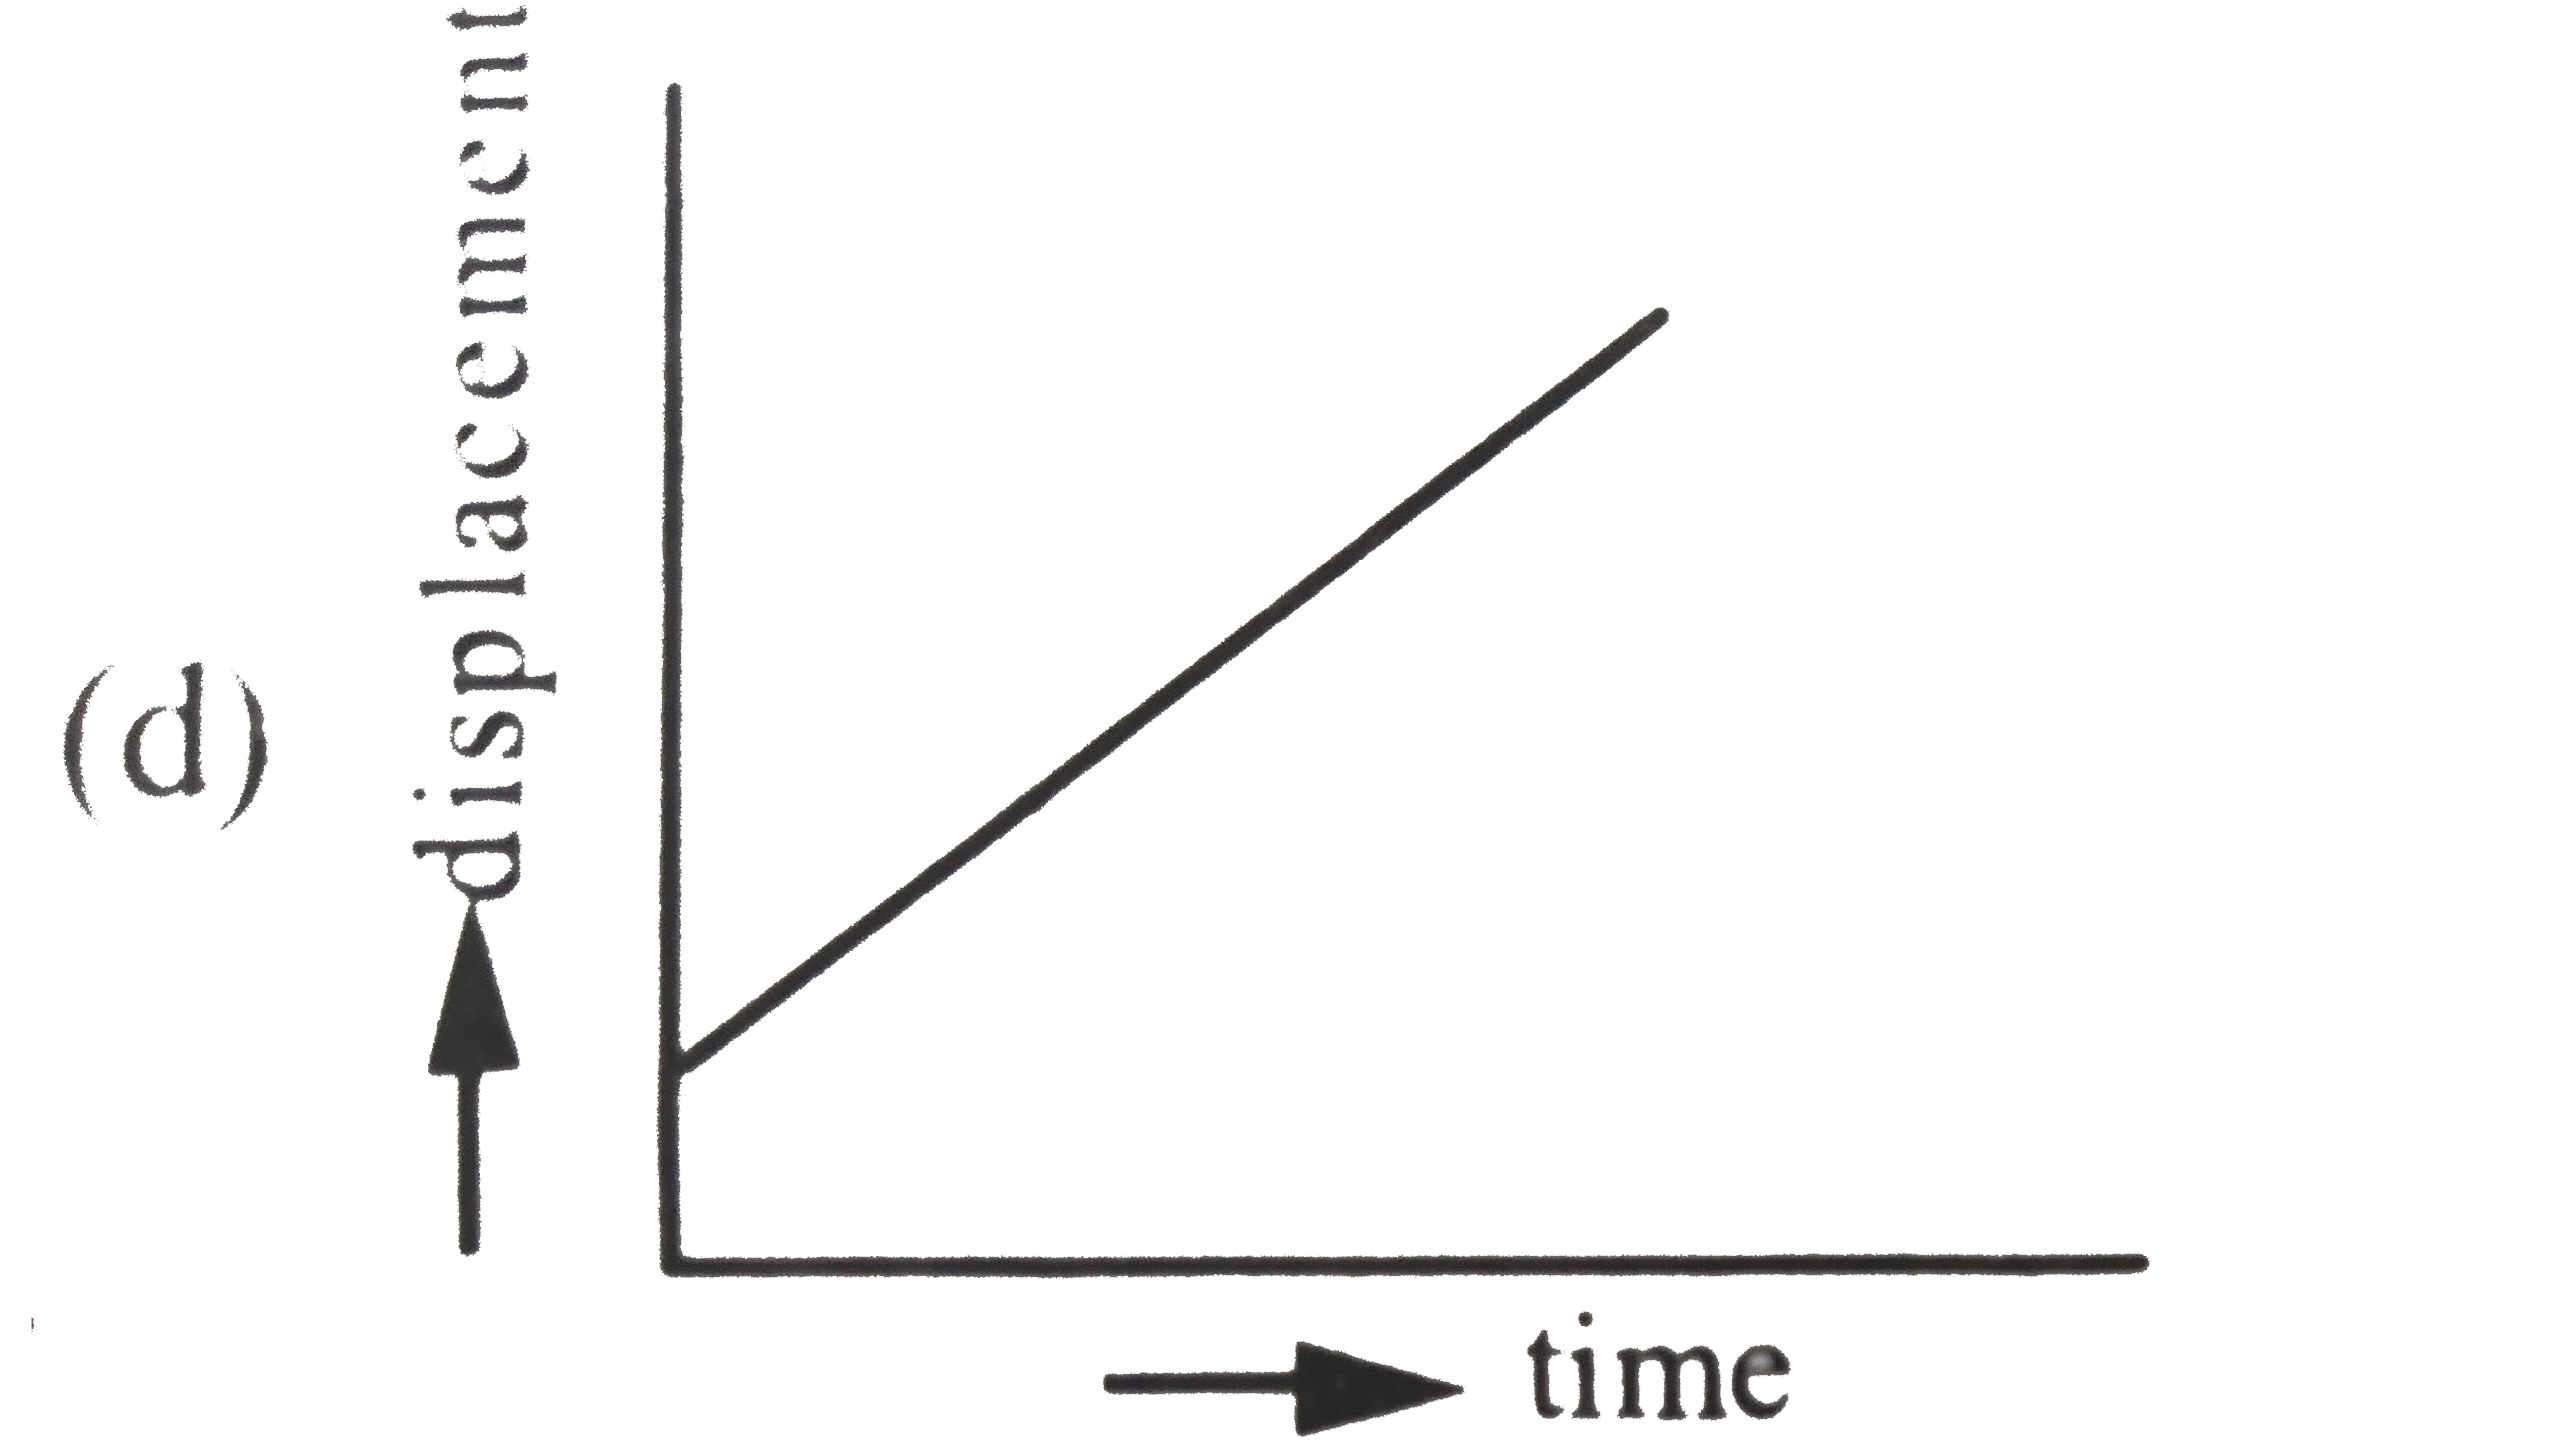
The figure shows the graph of logarithmic reading of pressure and volume for two ideal gases A and B undergoing adiabatic process. From figure, it can be concluded that
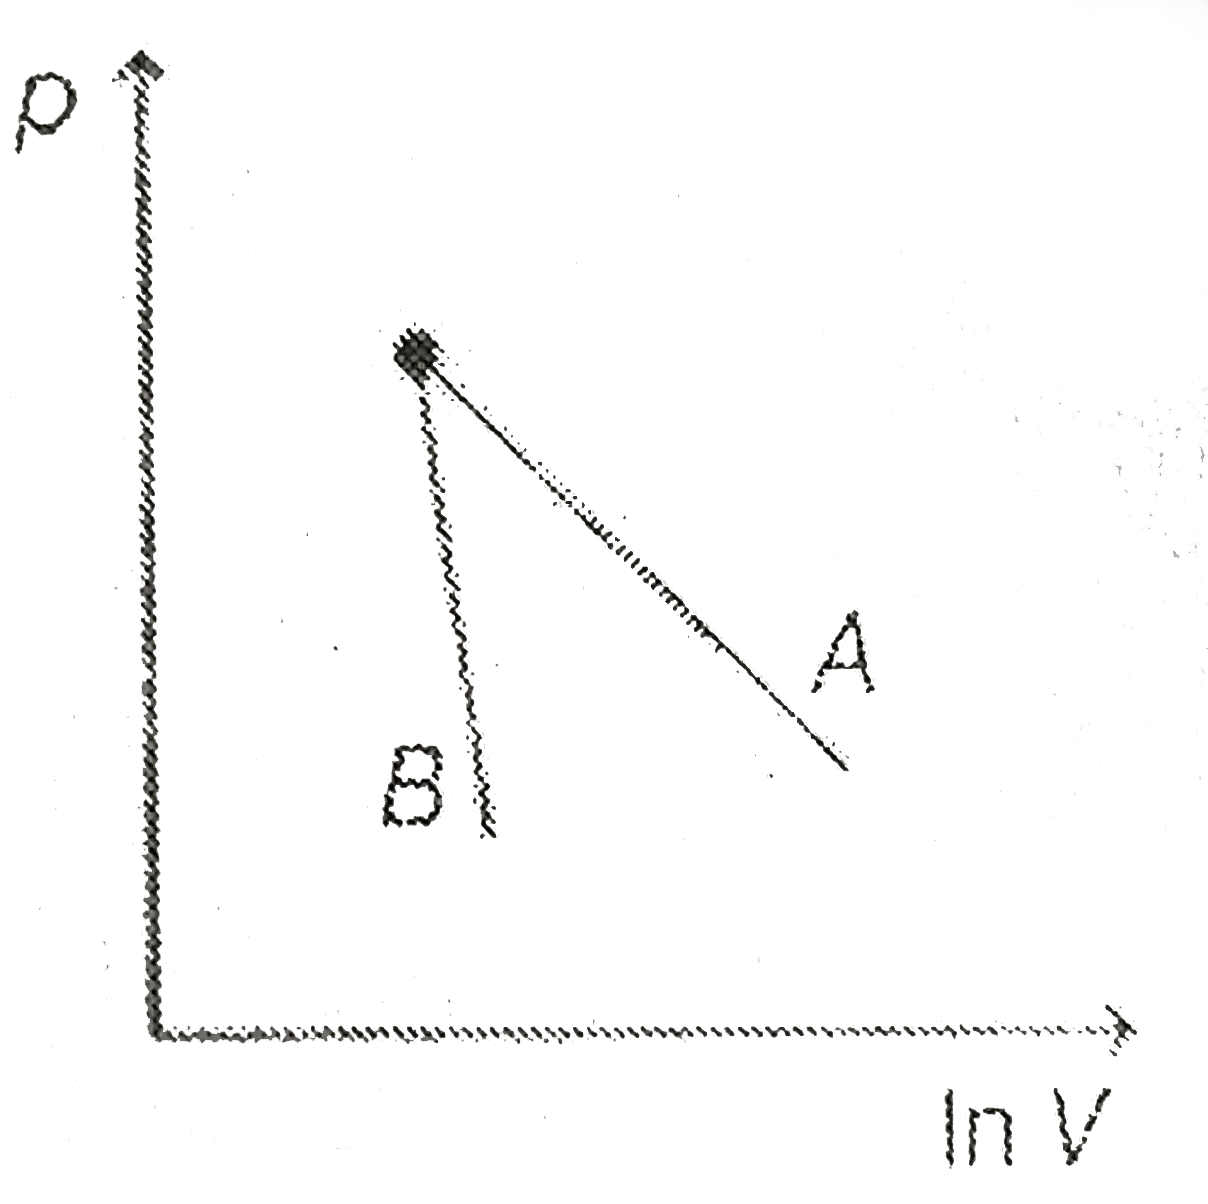 Agas B is diatomicBgas A and B both are diatomicCgas A is monoatomicDgas B is monoatomic and gas A is diatomic
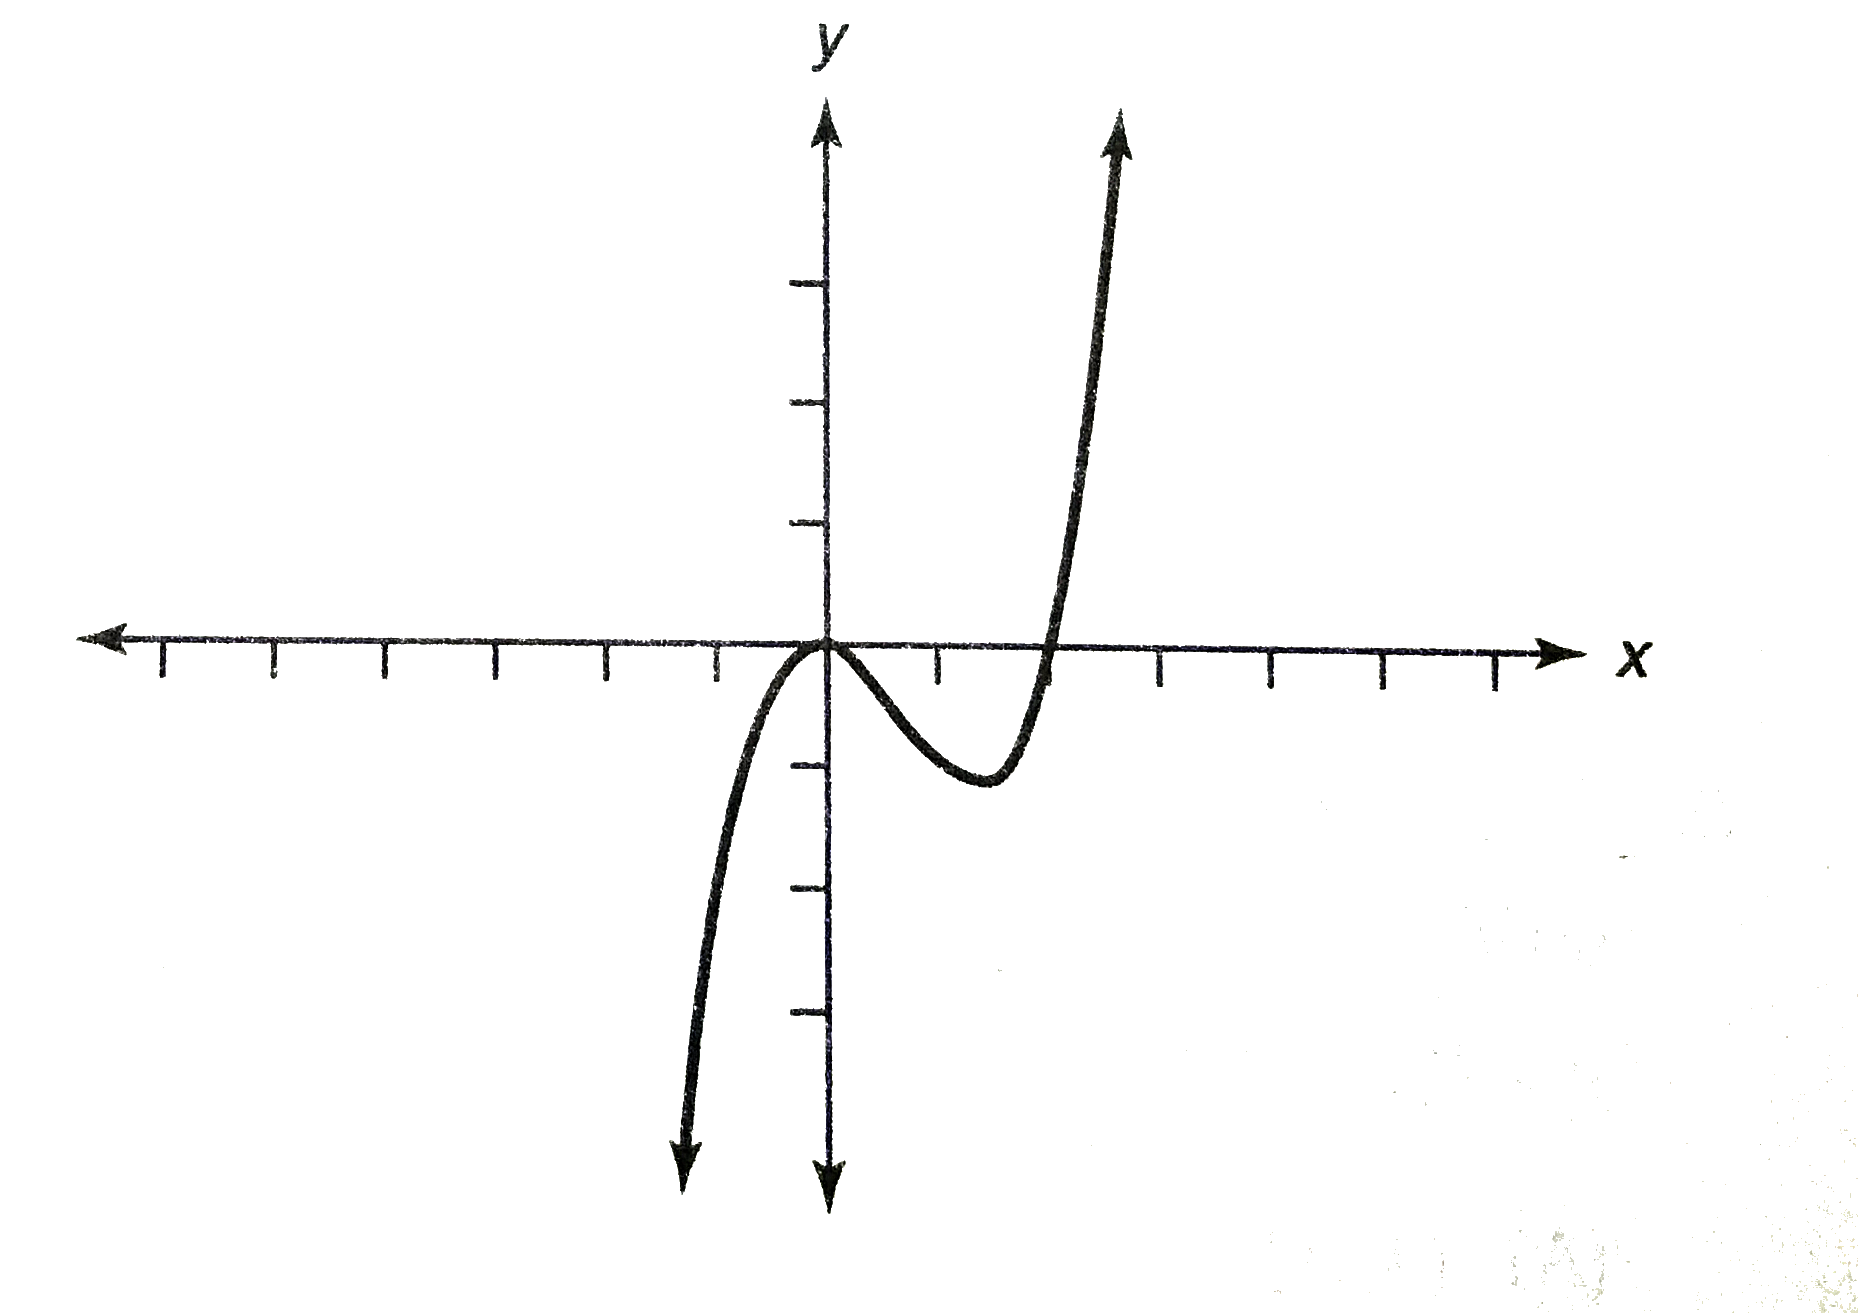
The figure above shows the graph of function f. If g(x)=−f(x), which graph represents function g?A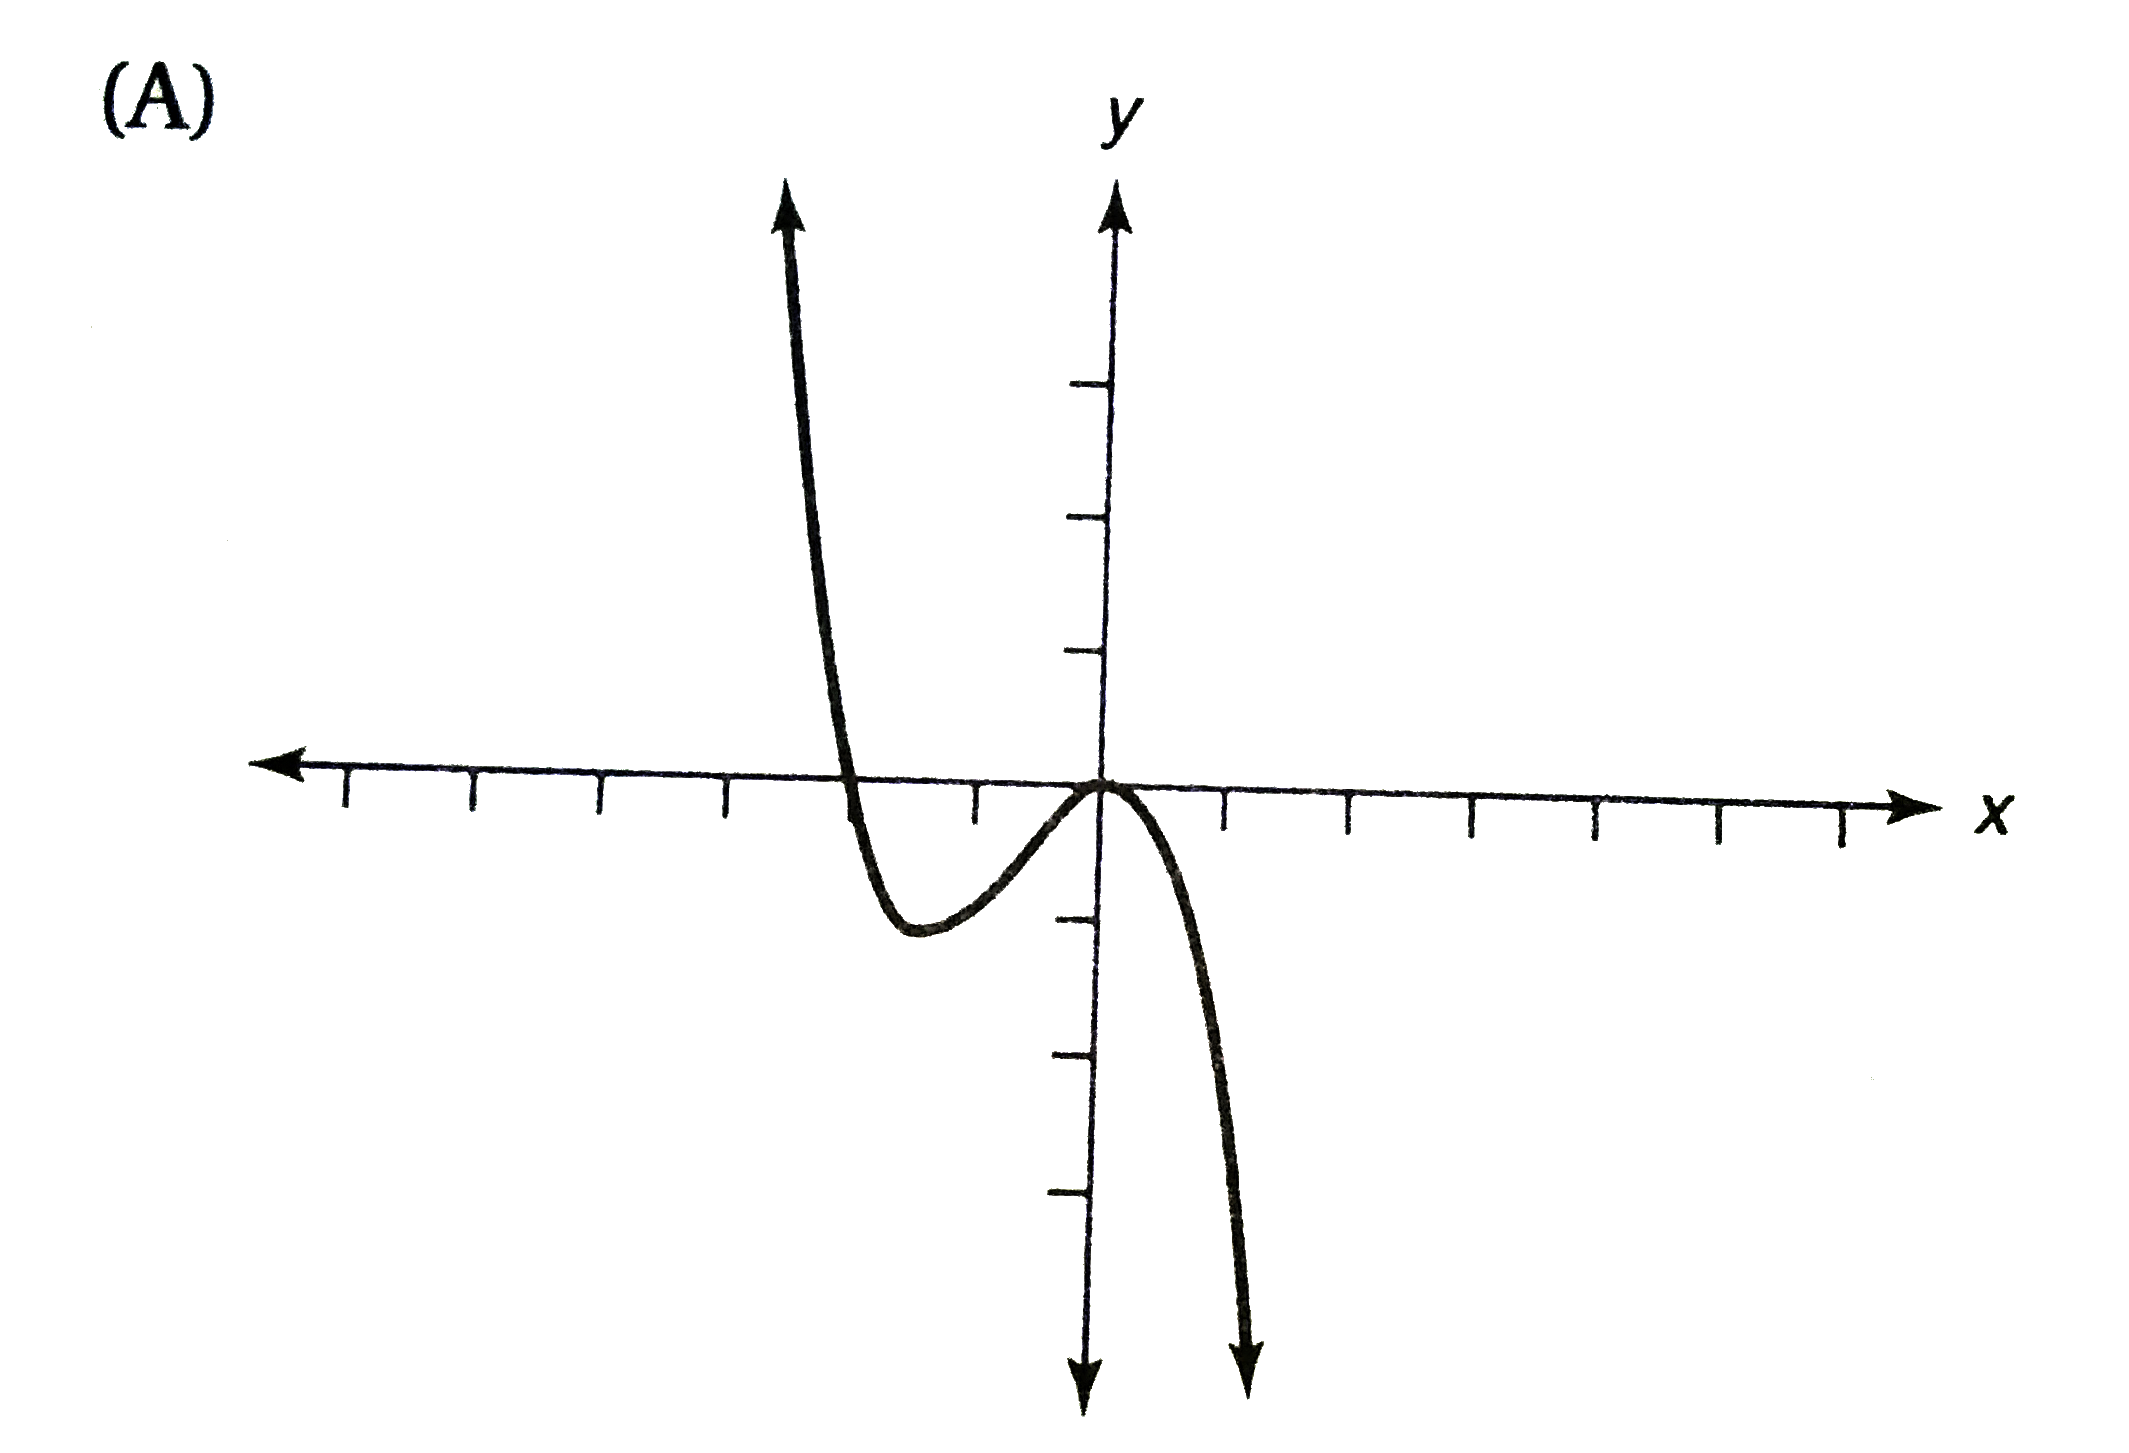 B
B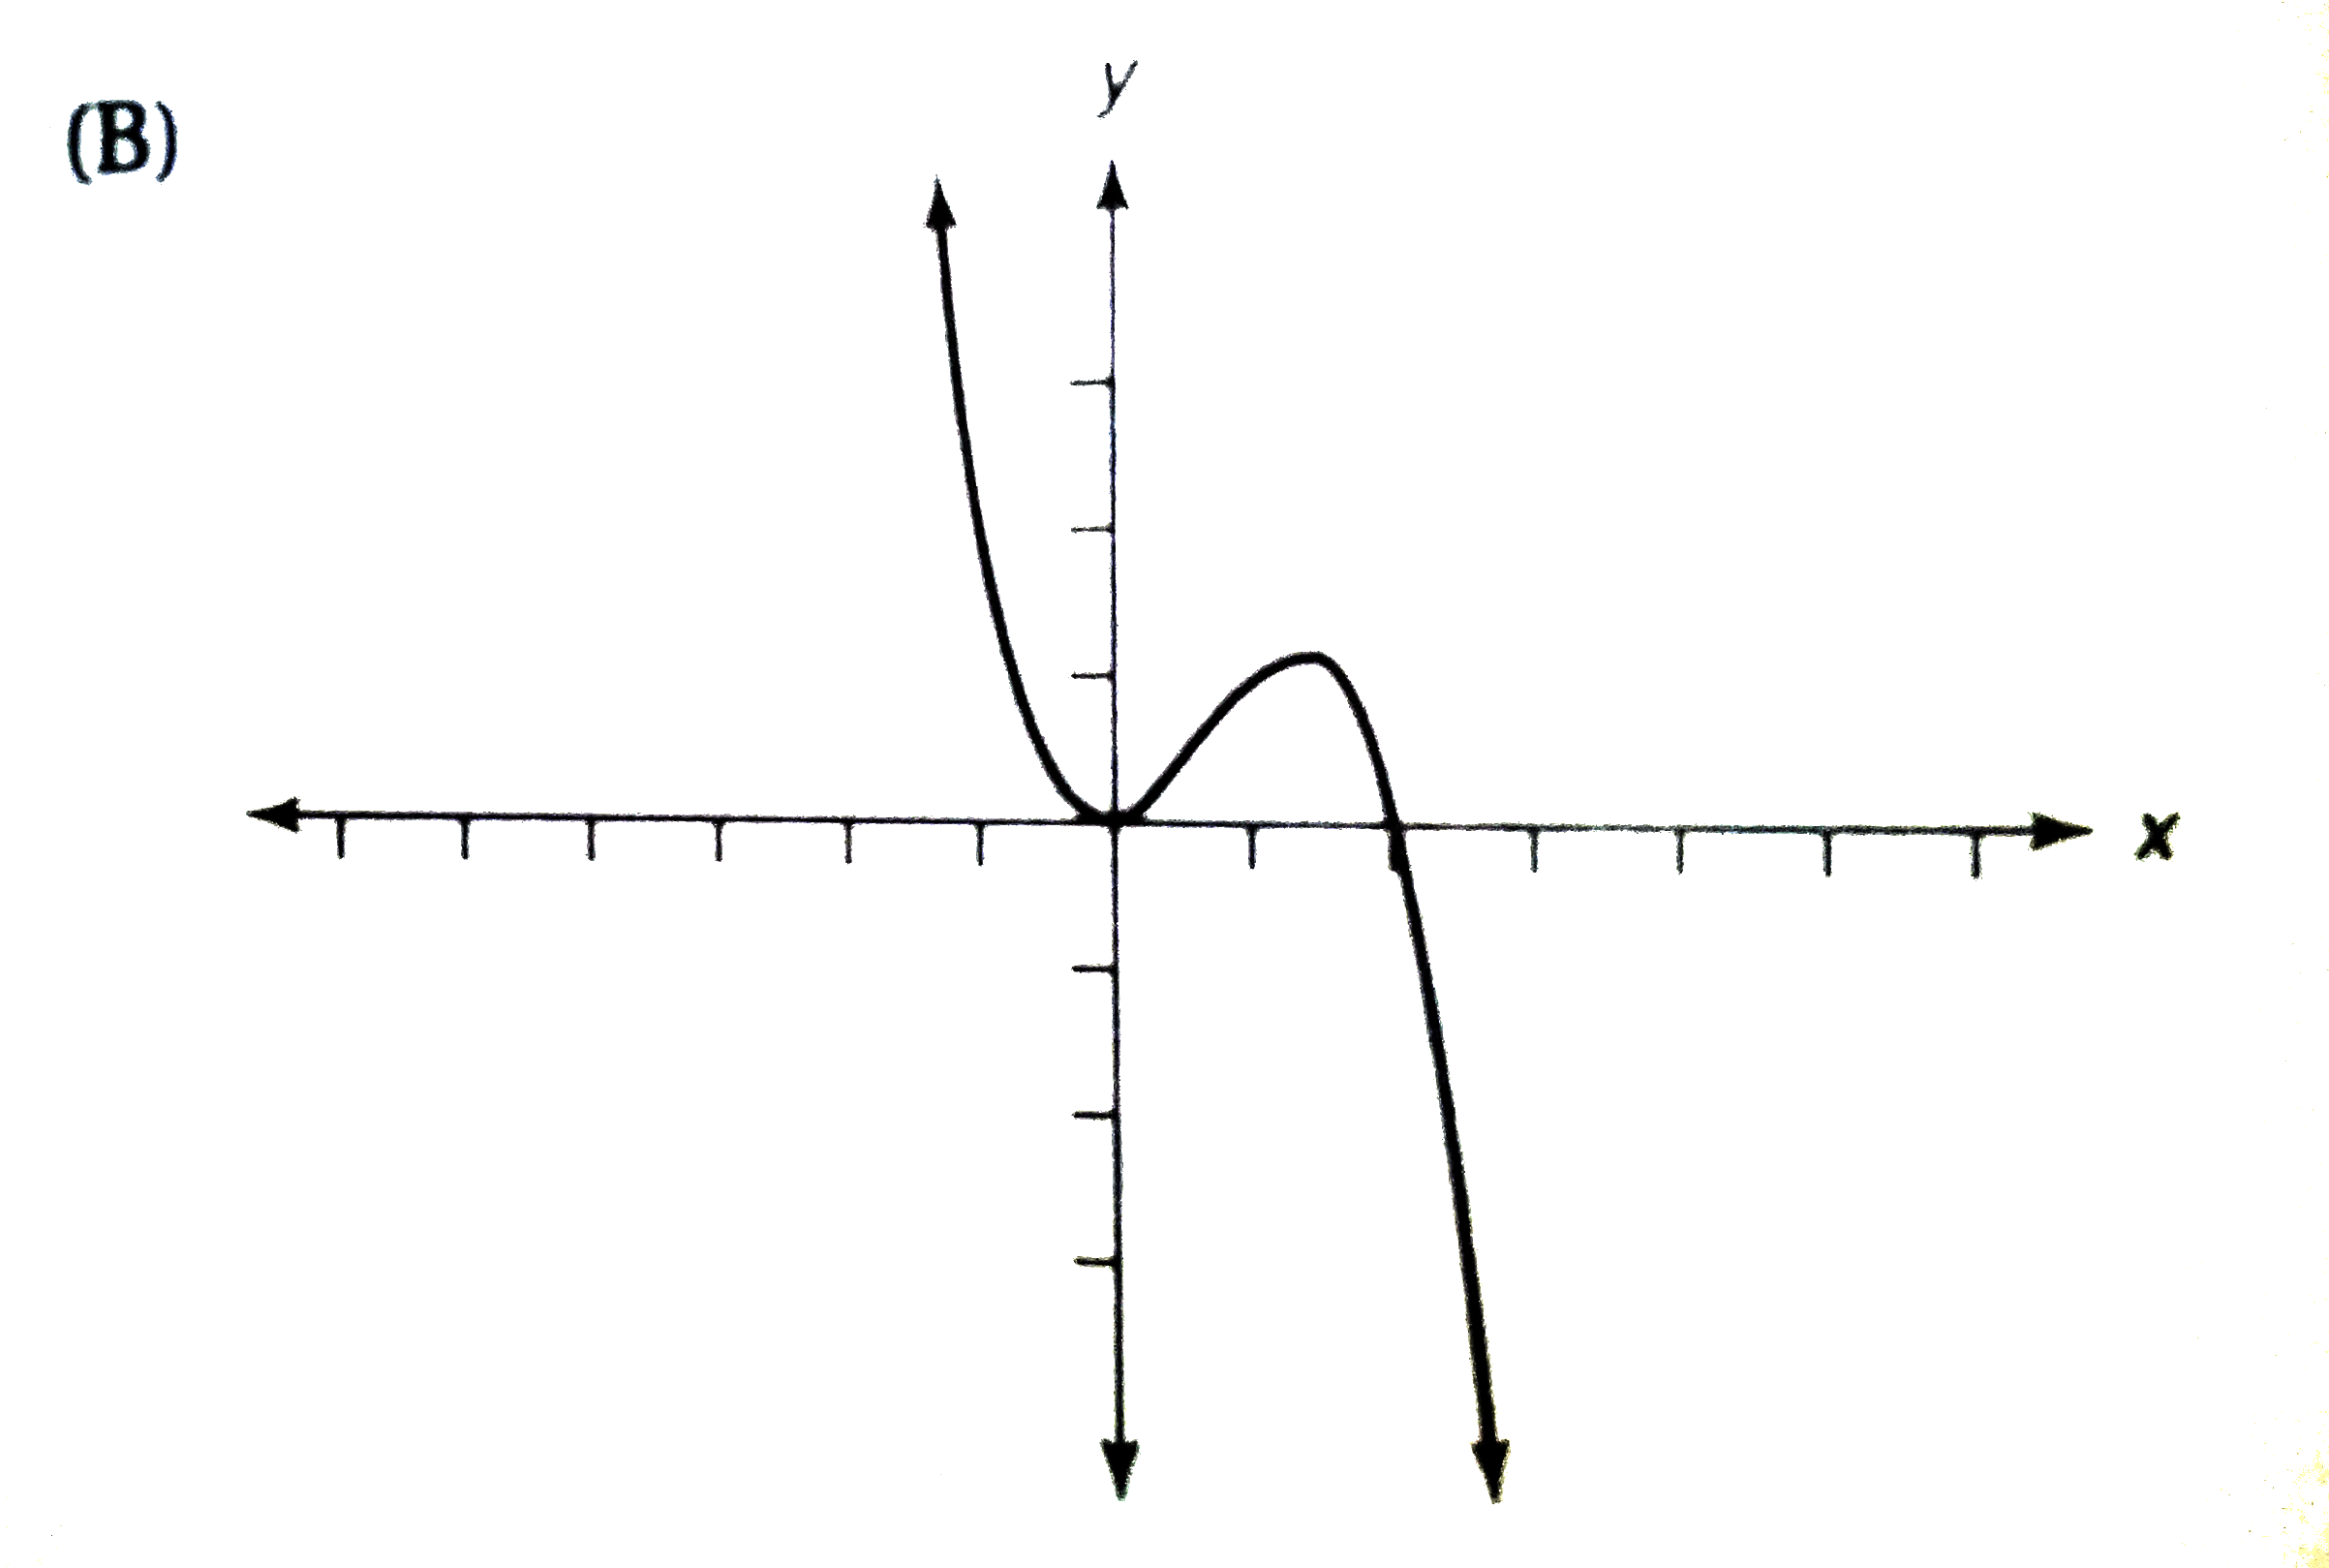 C
C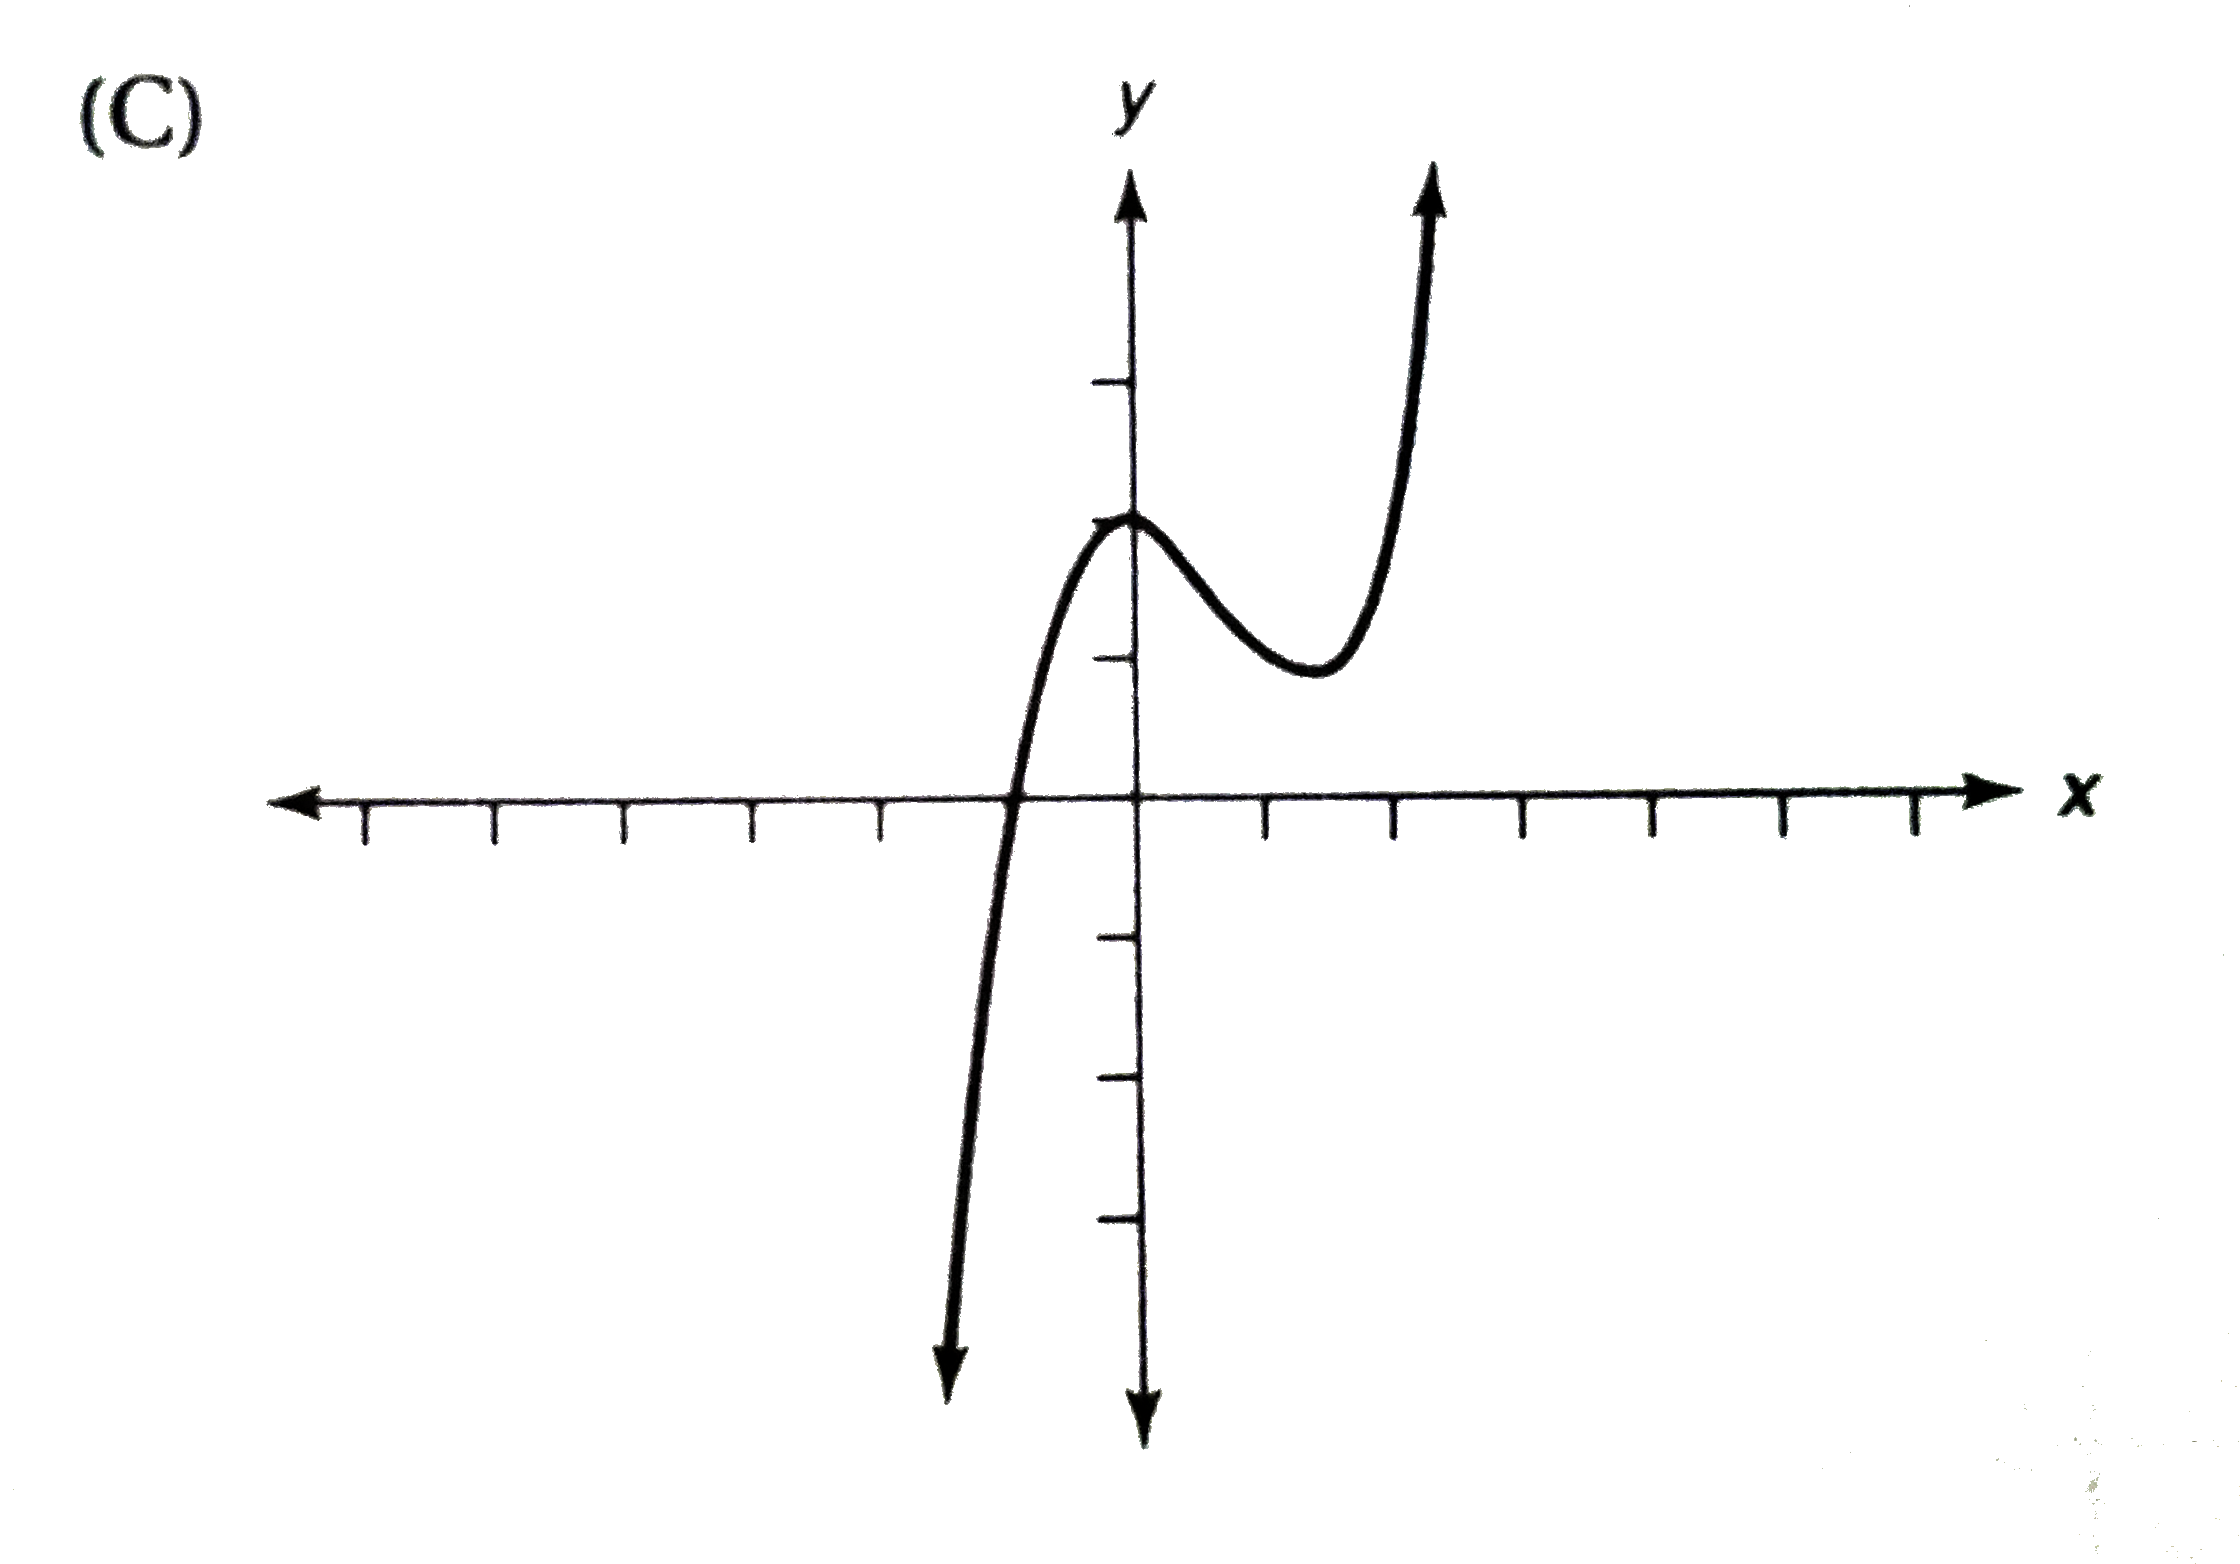 D
D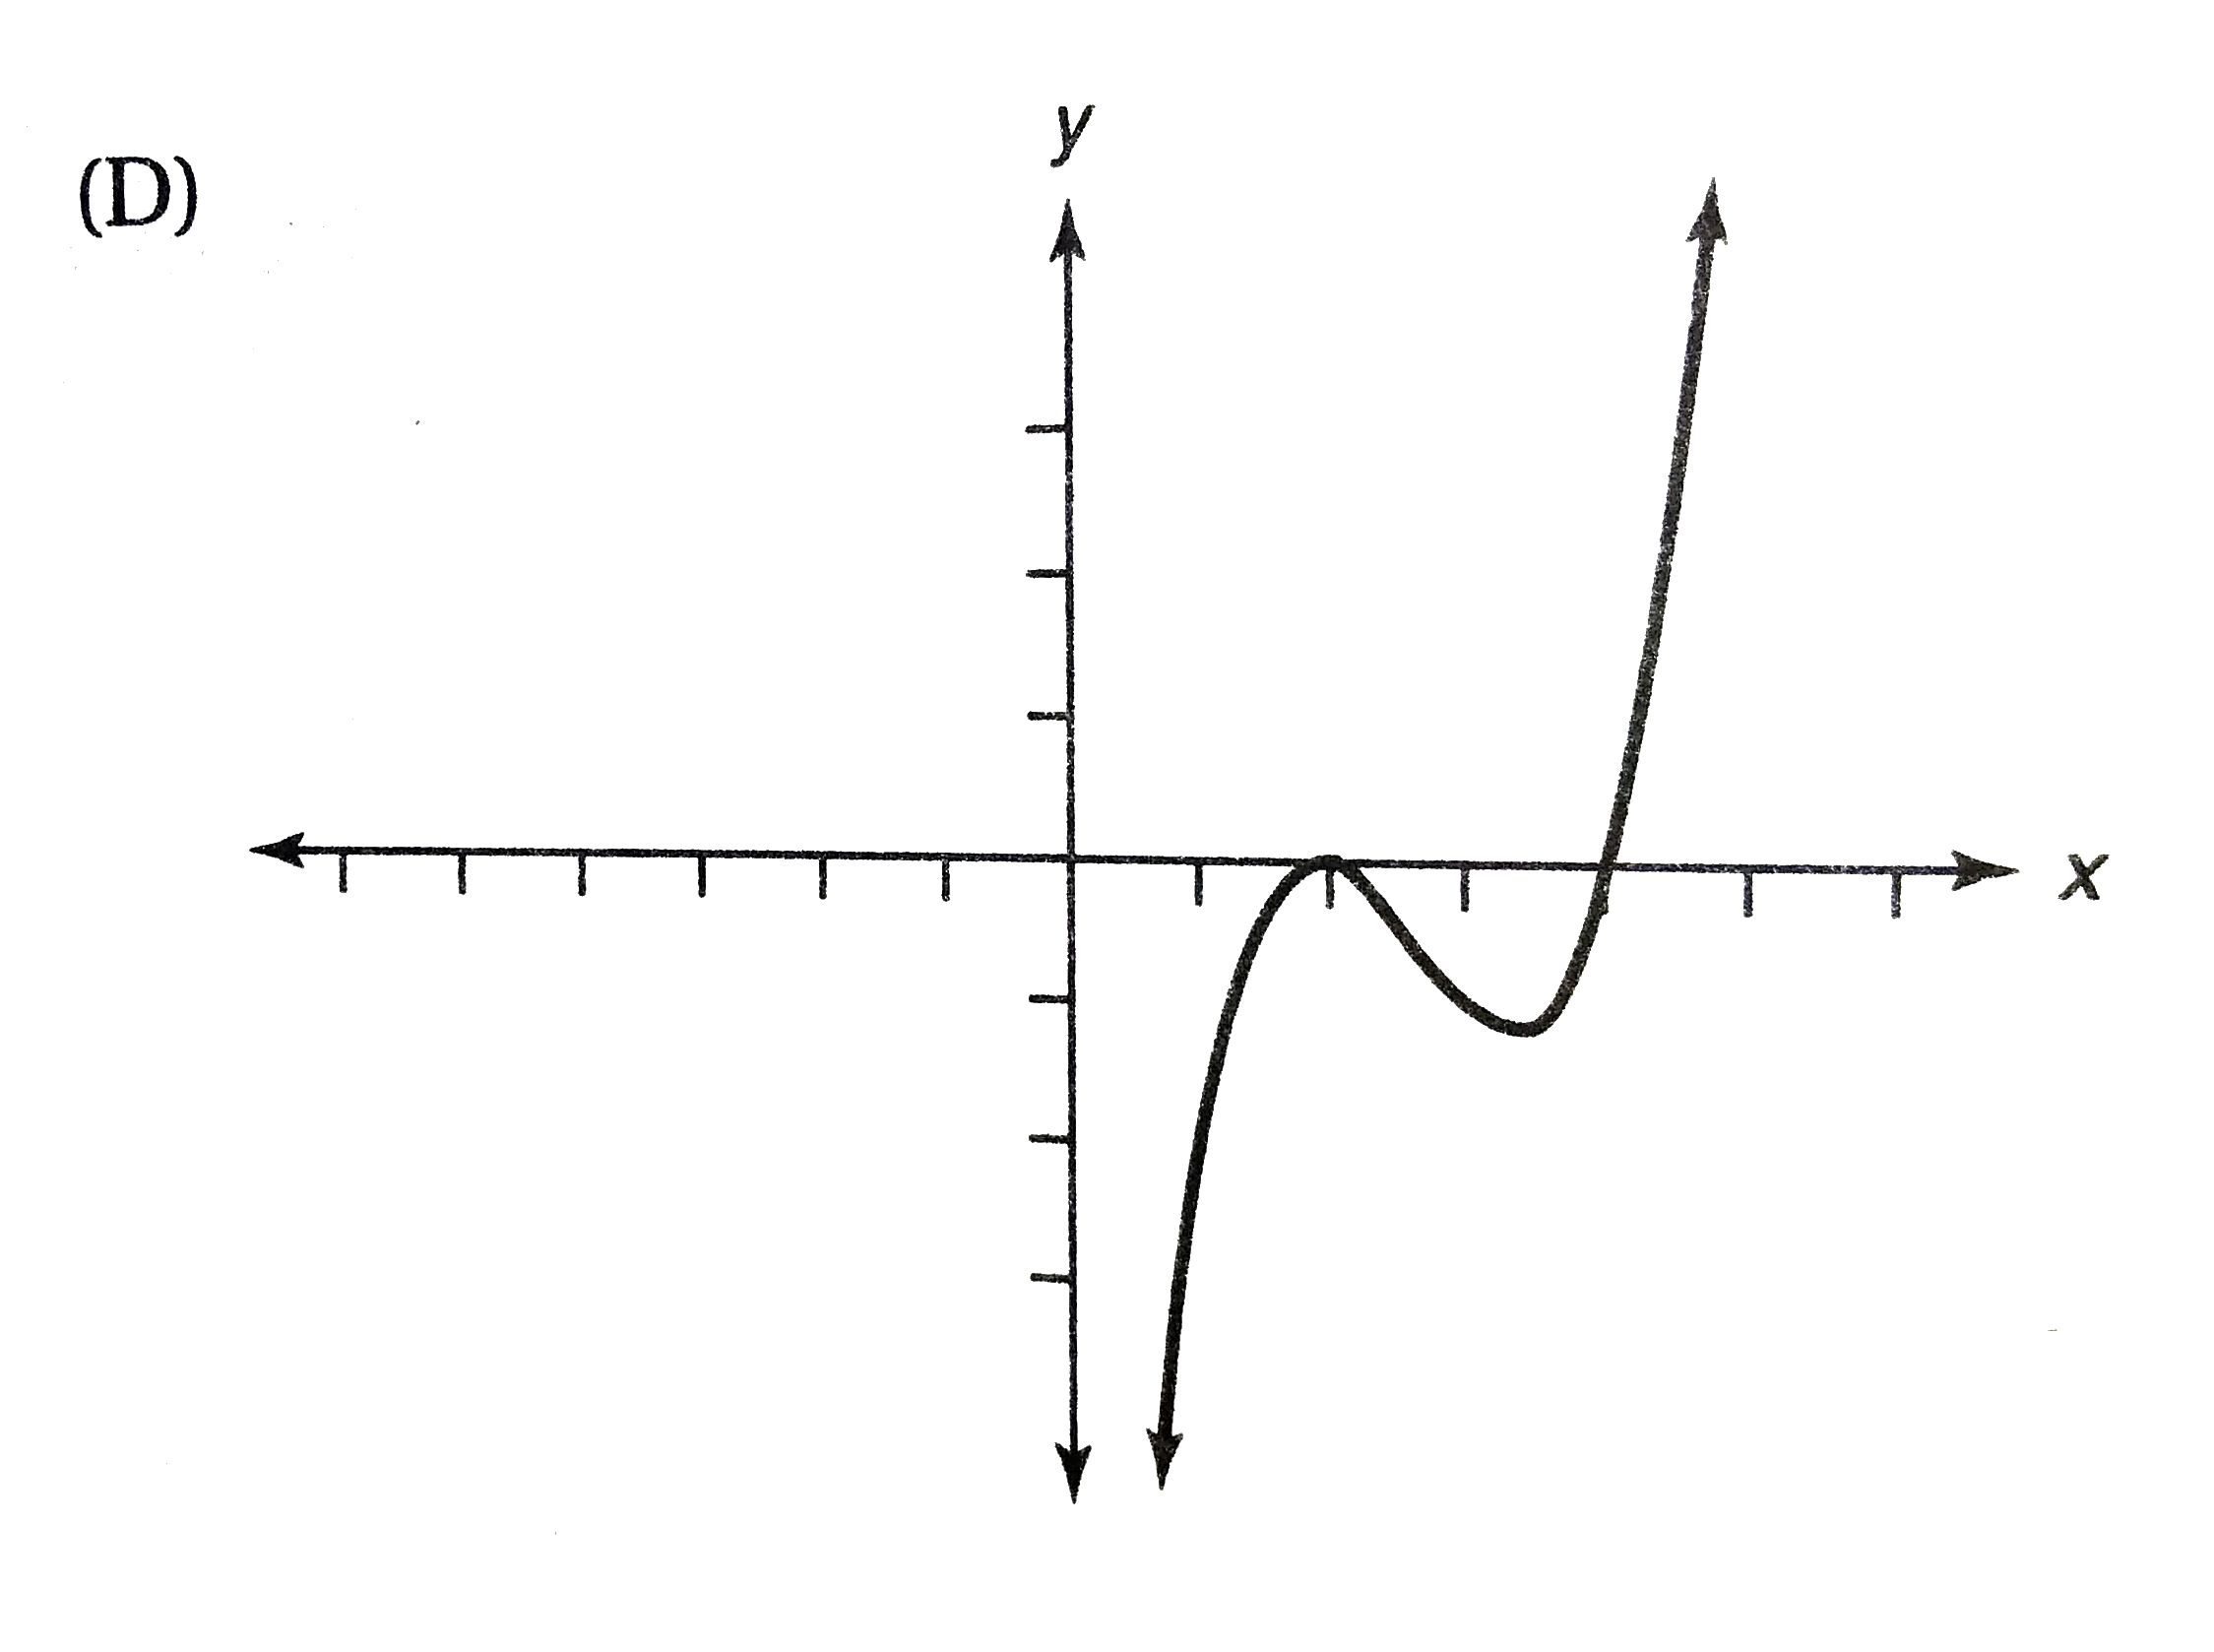
The figure shows the graph of logarithmic reading of pressure and volume for two ideal gases A and B undergoing adiabatic process. From figure, it can be concluded that

View SolutionWhich one of the following figures represents the placentation on primrose ?
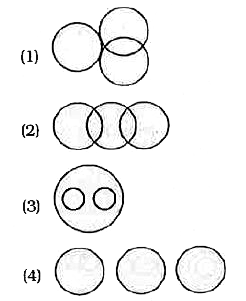
View SolutionWhich figure represent the relationship among Sun, Moon, Molecule ?
View SolutionThe figure shows the graph of logarithmic reading of pressure and volume for two ideal gases A and B undergoing adiabatic process. From figure, it can be concluded that

View SolutionWhich one of the following figures represents the placentation on primrose ?
View Solution
