The figure shows the graph of logarithmic reading of pressure and volume for two ideal gases A and B undergoing adiabatic process. From figure, it can be concluded that
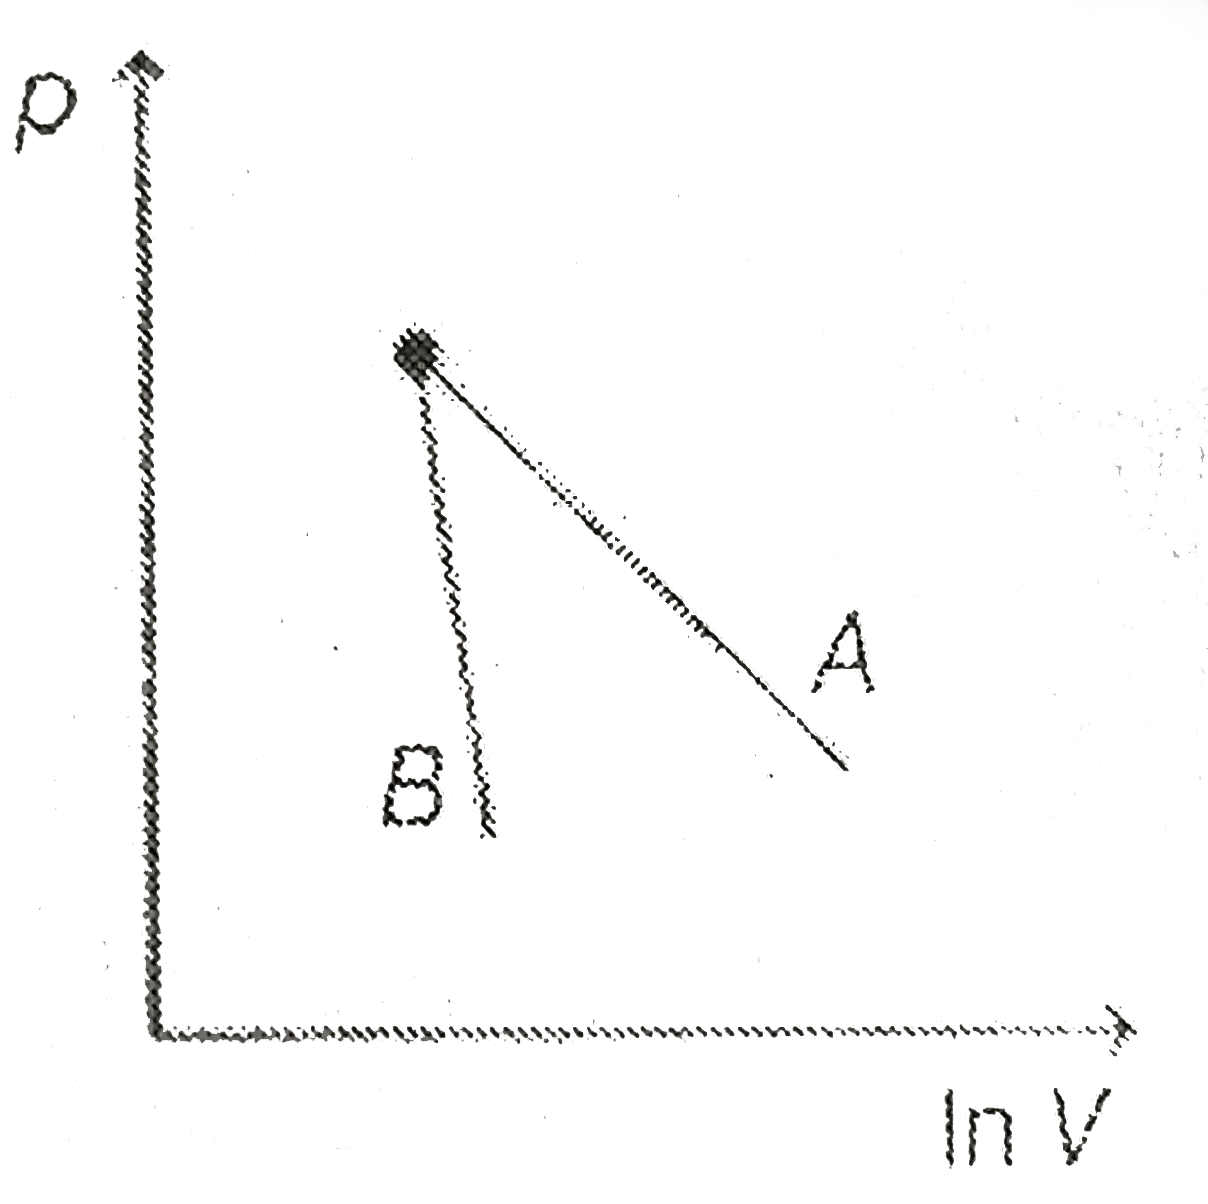
gas B is diatomic
gas A and B both are diatomic
gas A is monoatomic
gas B is monoatomic and gas A is diatomic
The correct Answer is:D
Step by step video & image solution for The figure shows the graph of logarithmic reading of pressure and volume for two ideal gases A and B undergoing adiabatic process. From figure, it can be concluded that by Physics experts to help you in doubts & scoring excellent marks in Class 11 exams.
Updated on:21/07/2023Topper's Solved these Questions
Similar Questions
Two ideal gases A & B are going through adiabatic process. Choose the correct option.
View SolutionLogarithms of readings of pressure and volume for an ideal gas were plotted on a graph as shown in Fig. By measuring the gradient, it can be shwon that the gas may be
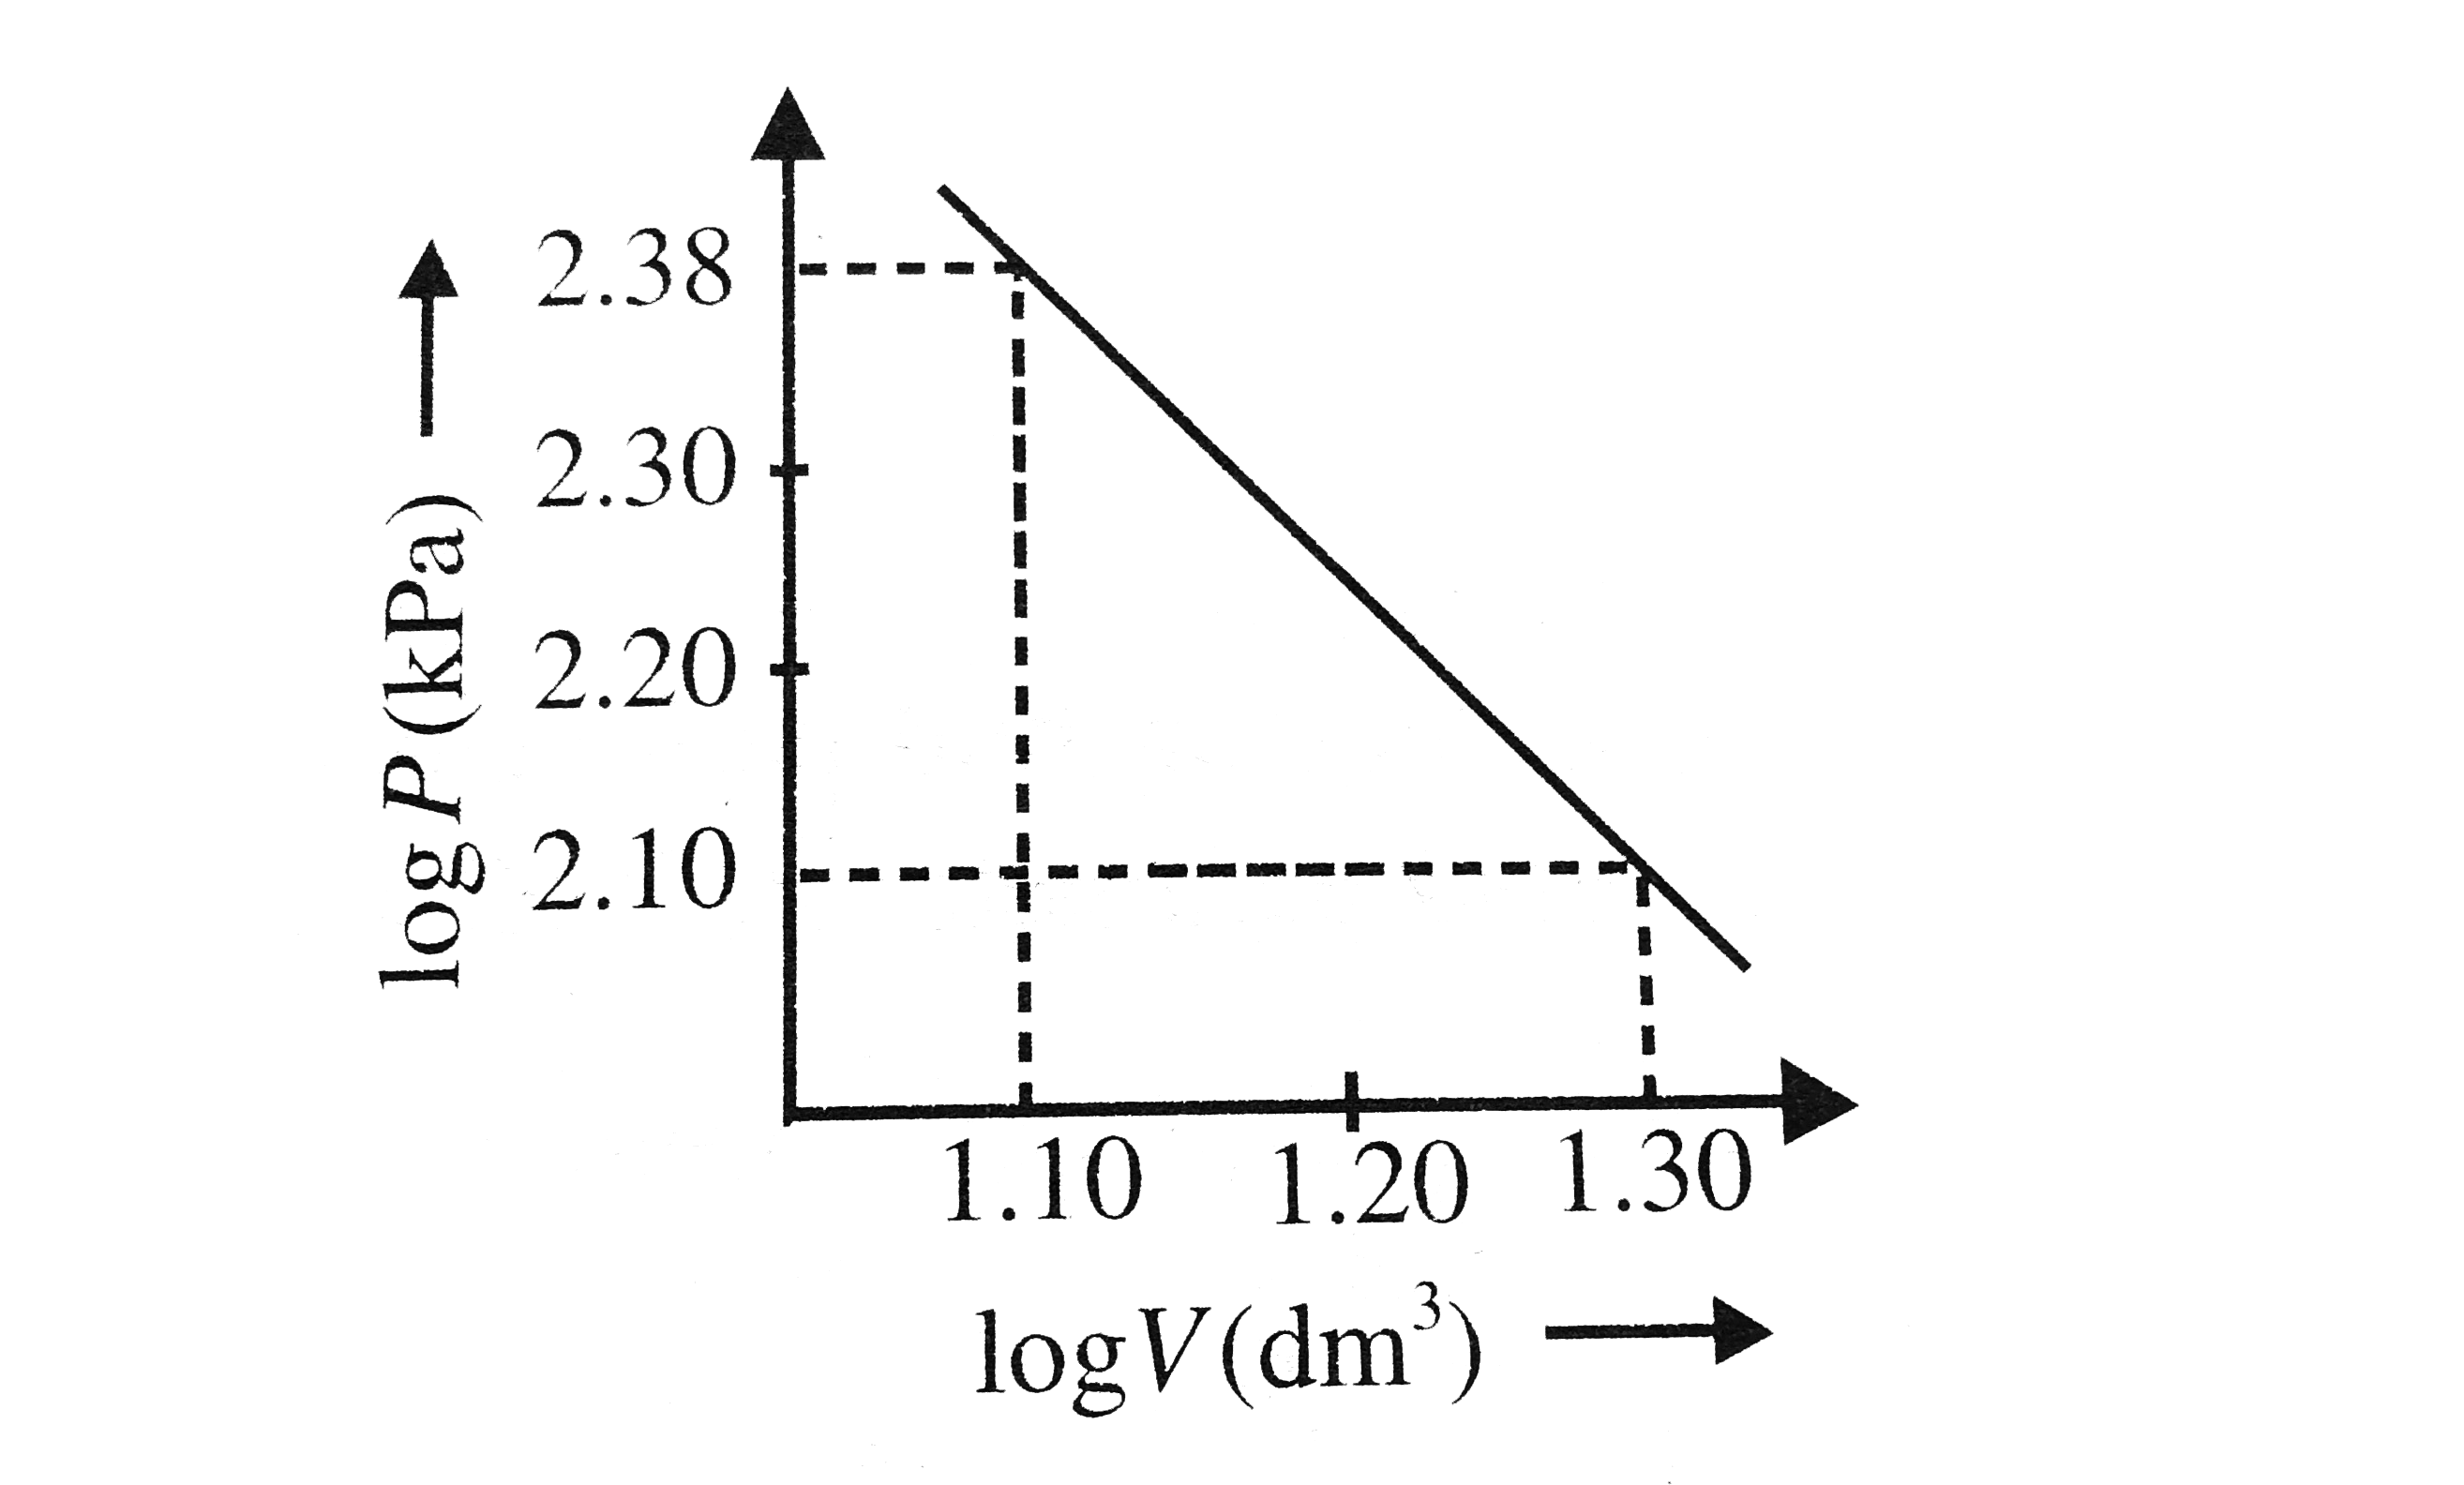
View SolutionLogarithms of readings of pressure and volume for an ideal gas were plotted on a graph as shown in Fig. By measuring the gradient, it can be shwon that the gas may be

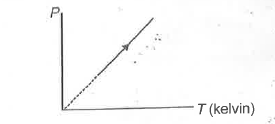
View SolutionThe graph of pressure and temperature for an ideal gas is as shown in figure. The given process is
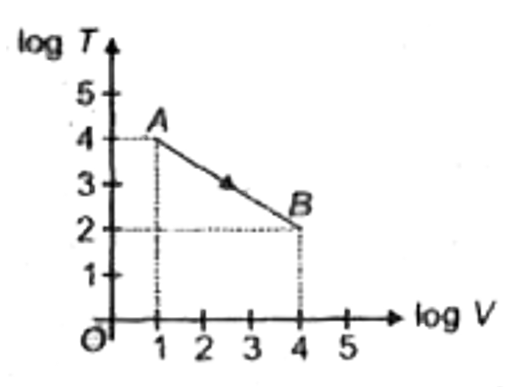
View SolutionFigure shows , the adiabatic curve on log T and log V scale performed on ideal gas . The gas is
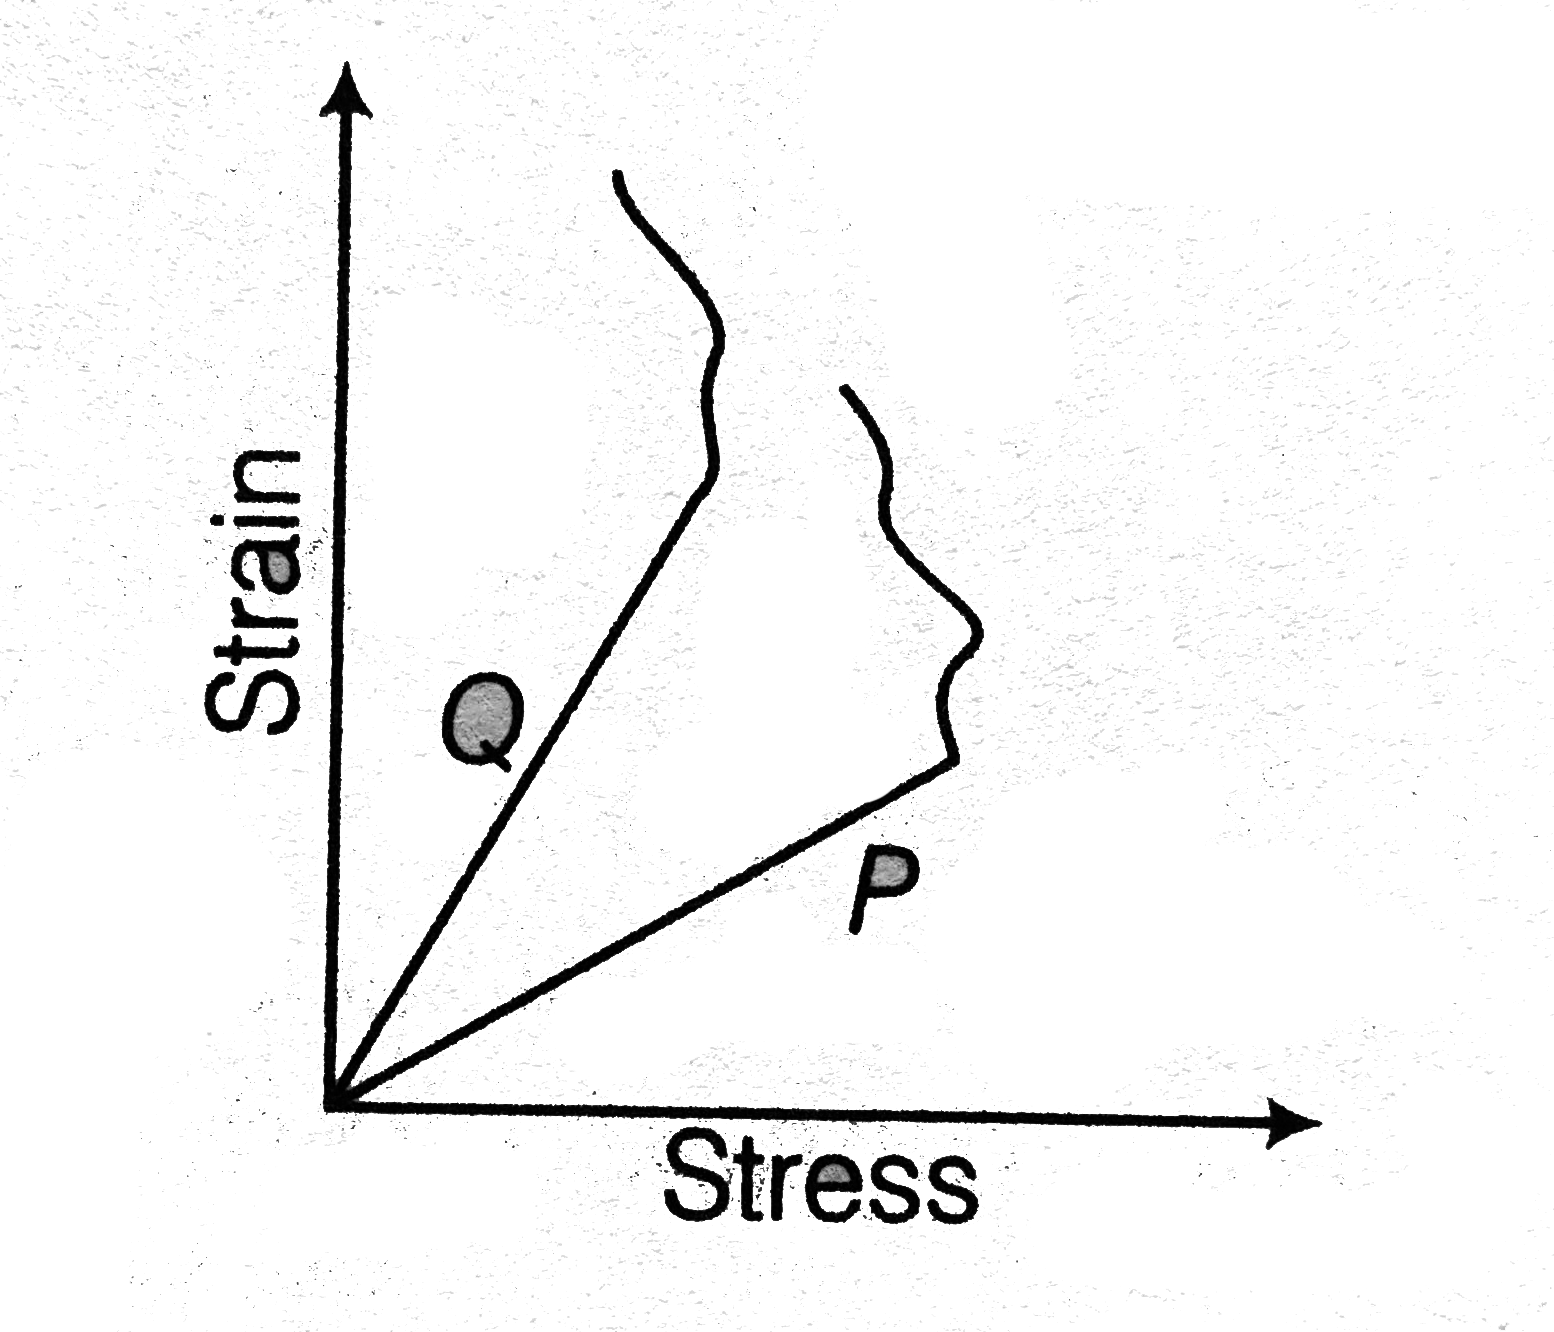
View SolutionFigure shows the stress-strain curve of two metals P and Q . From the graph, it can be concluded that
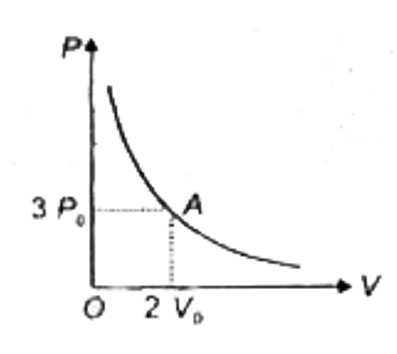
View SolutionThe variation of pressure P with volume V for an ideal monatomic gas during an adiabatic process is shown in figure . At point A the magnitude of rate of change of pressure with volume is
View SolutionP-V plots for two gases during an adiabatic process are given in the figure:
Plot A and plot B should correspond to :
View SolutionFigure shows a parabolic graph between T and 1V (T = temperature, V = Volume) for a gas undergoing an adiabatic process. If the ratio of rms velocity of molecules and speed of sound in the gas at the same temperature is √n, then find the value of n.

View SolutionFigure shows the adiabatic curve on log-log scale performed on a ideal gas. The gas must be:-
_S01_085_Q01.png)
View Solution
