The figure shows two crop fields (plots A and B) have been treated by manures and chemical fertilizers, respectively, keeping other environment factors same. Observe the graph and answer the following question:
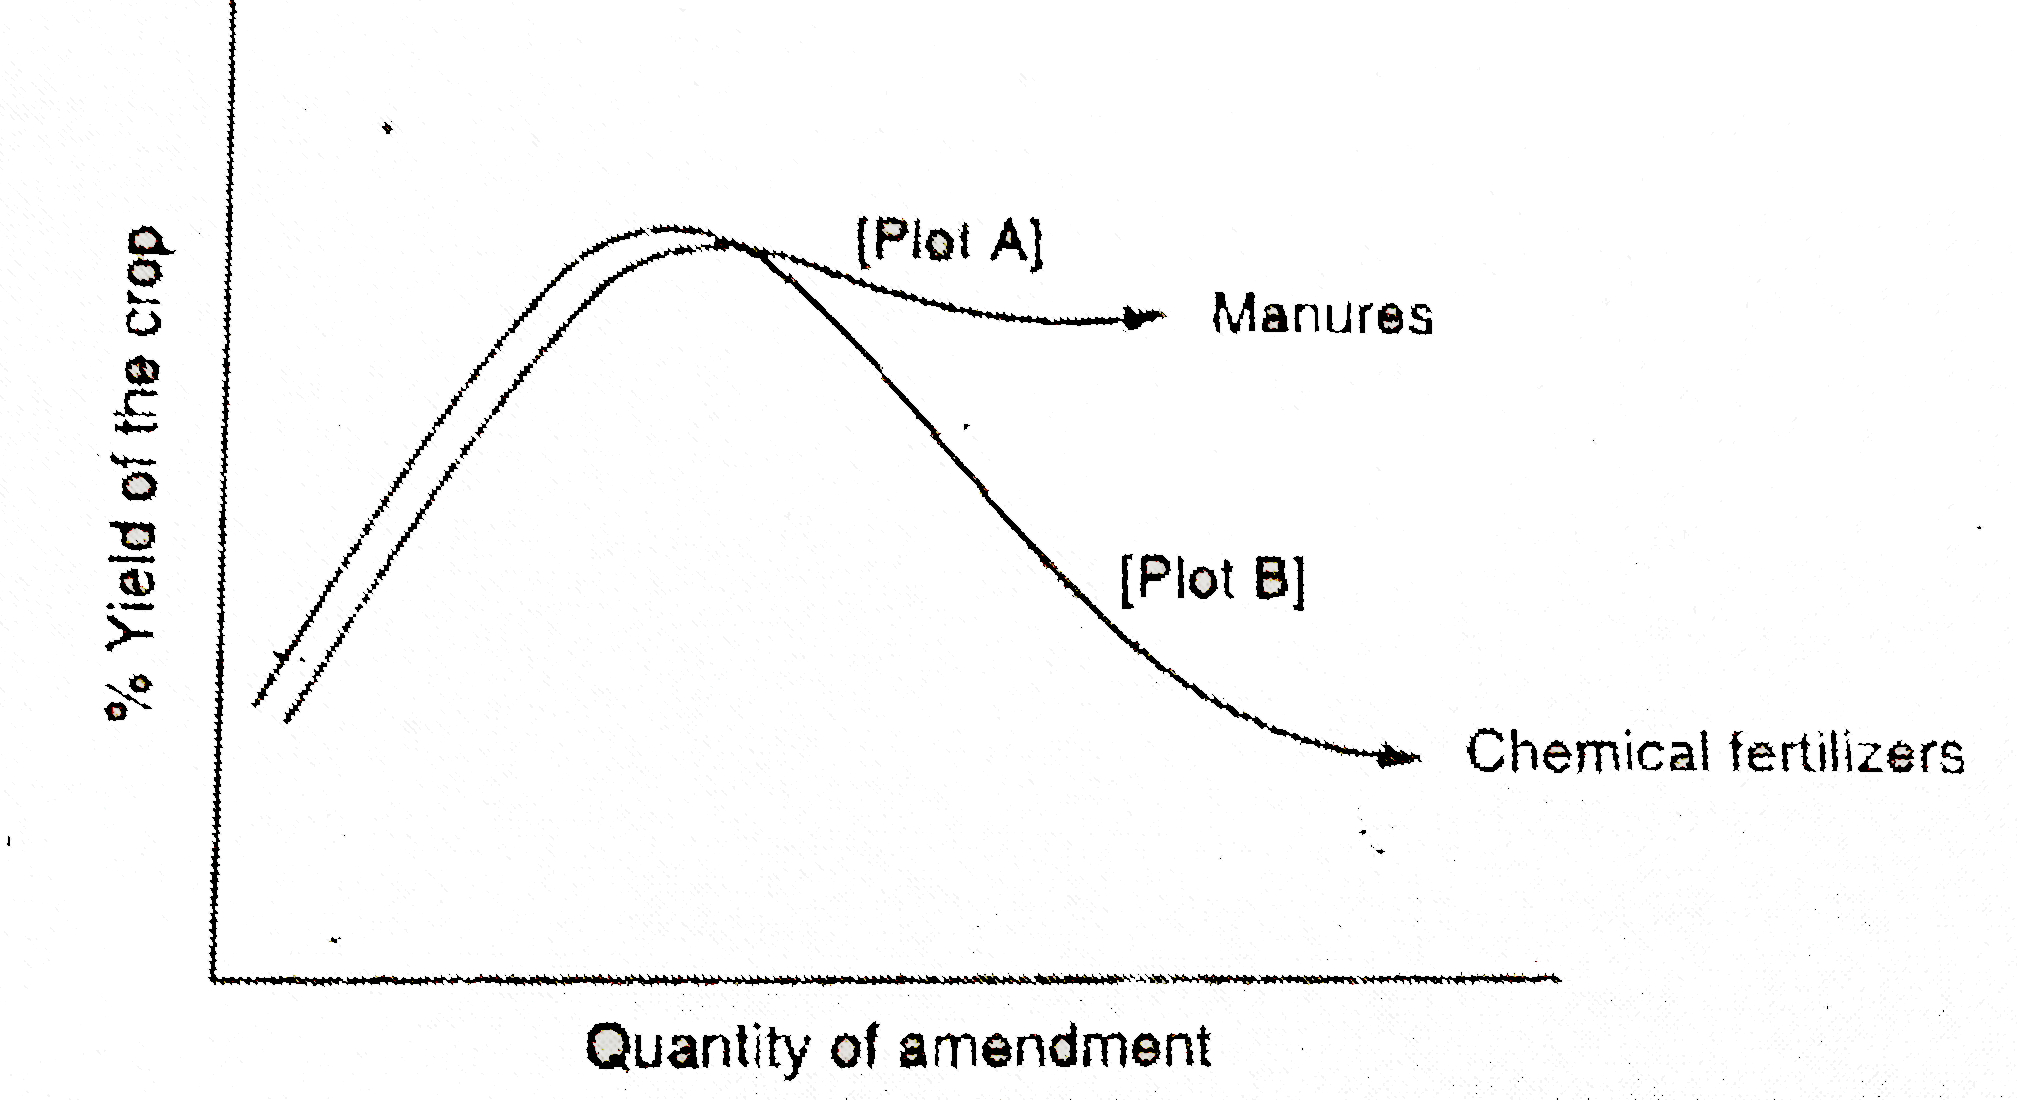
(i) Why does plot B shows sudden increase and then gradual decrease in yield ?
(ii) Why is the highest peak in plot A graph slightly delayed?
(iii) What is the reason for the different pattern of the two graphs.
Sudden increase: Chemical fertiliser supplies the minerals immediately in good quantity. Gradual decrease: It is due to depletion of nutrients caused by absorption by plants, leaching to lower layers of the soil and killing of decomposer microbes.
Topper's Solved these Questions
- IMPROVEMENT IN FOOD RESOURCES : PLANTSBook:CENGAGE BIOLOGYChapter:IMPROVEMENT IN FOOD RESOURCES : PLANTSExercise:CONSOLIDATED EXERCISE (MCQ)
Explore 27 Videos
- IMPROVEMENT IN FOOD RESOURCES : PLANTSBook:CENGAGE BIOLOGYChapter:IMPROVEMENT IN FOOD RESOURCES : PLANTSExercise:OLYMPIAD AND NTSE LEVEL EXERCISES
Explore 10 Videos
- IMPROVEMENT IN FOOD RESOURCES : PLANTSBook:CENGAGE BIOLOGYChapter:IMPROVEMENT IN FOOD RESOURCES : PLANTSExercise:MANDATORY EXERCISE (Exercise Set II)
Explore 20 Videos
- HEALTH, HYGIENE, AND DISEASES Book:CENGAGE BIOLOGYChapter:HEALTH, HYGIENE, AND DISEASES Exercise:CHALLENGING EXERCISE
Explore 2 Videos
- TISSUES Book:CENGAGE BIOLOGYChapter:TISSUES Exercise:CHALLENGING EXERCISE
Explore 2 Videos
Similar Questions
Figure shows the two crop fields [Plots A and B ] have been treated by manures and chemical fertilisers respectively , keeping other environmental factor same . Observe the graph and answer the following question.
(i) Why does plot B show sudden increase and then gradual decrease in yield?
(ii) Why is the highest peak in plot A graph slightly delayed ?
(iii) What is the reason for the different pattern of the graphs ?

View SolutionWhy are manure and fertilizers used in fields?
View Solution
Knowledge Check
Refer to the given graph representing two crop fields X and Y that have been treated by different types of materials for nutrient replenishment, keeping other environmental factors same.

Select the incorrect statements regarding these crop fields X and Y.AMaterials used for treating crop field X could be organic substances while those used for Y could be inorganic substances.BMaterials used for crop field X are nutrient specific while those used for crop field Y are not nutrient specific.CGradual decline in yield of crop field Y is due to killing of useful soil microbes.DPersistent yield of crop field X is due to replenishment of nutrients by gradual decomposition of organic matter.
Why are manure and fertilizers used in fields ?
View SolutionFigure shows the effect of light on the rate of photosynthesis.
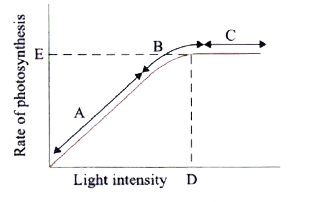
Based on the graph, answer the following questions.
What would be the limiting factors in region A?
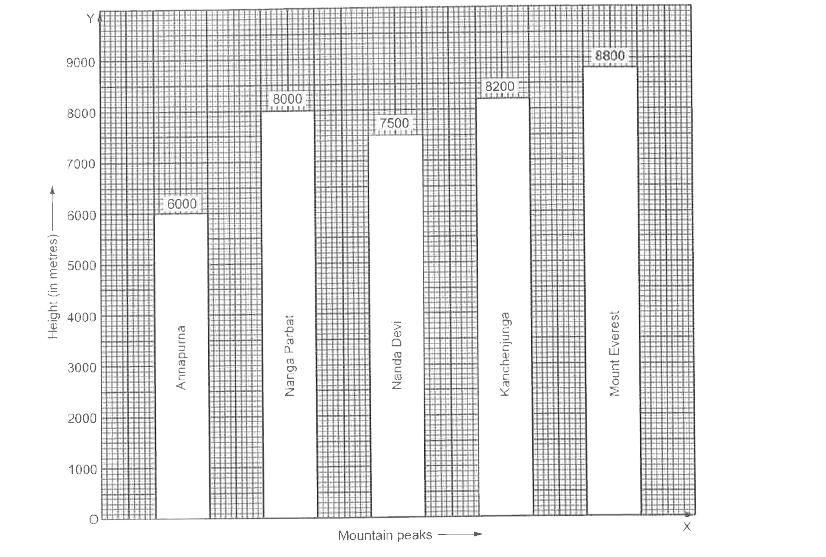
View SolutionGiven below is a bar graph showing the heights of five mountain peaks
Read the bar graph carefully and answer the following questions
Q(i) Which is the highest peak and what is its height (ii) What is the ratio of the heights of the highest peak and the next highest peak (iii) Arrange the heights of the given peaks in descending order
View SolutionFigure shows the effect of light on the rate of photosynthesis.
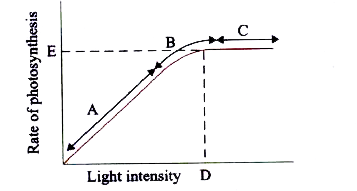
Based on the graph, answer the following questions.
At which point/s (A, B, or C) in the curve is light a limiting factor?
View SolutionAlso, plot the computed amount of depreciation on a graph.
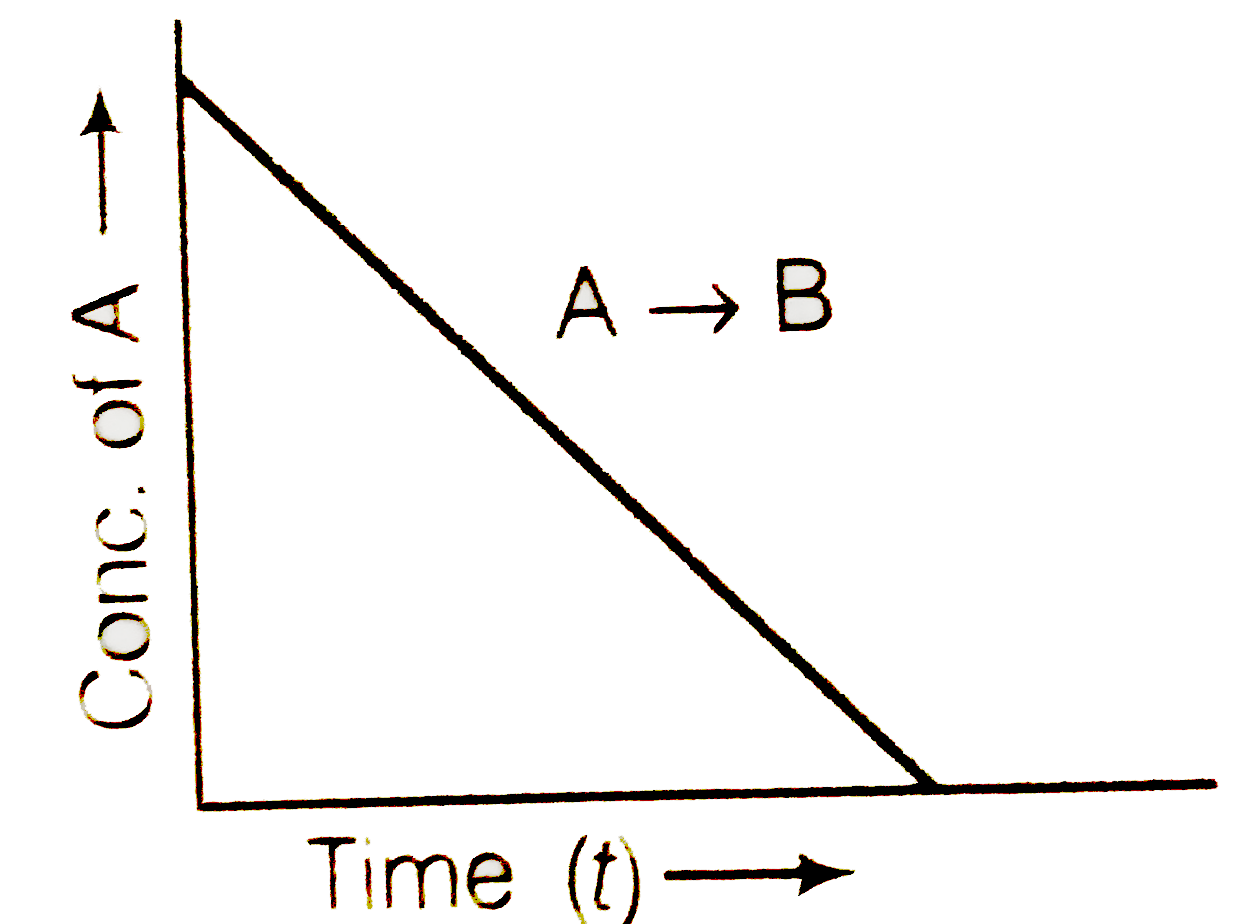
View SolutionFor a general reaction A→B, plot of concentration of A vs time is given in figure. Answer the following questions on the basis of this graph.
(i) what is the order of the reaction?
(ii) What is the slope of the curve ?
(iii) What are the units of rate constant?
View SolutionPlot a graph showing variation of capacitive reactance with the change in the frequency of the AC source.
View Solution