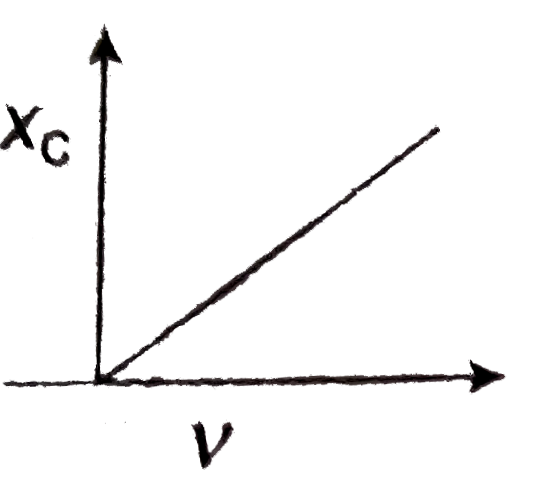
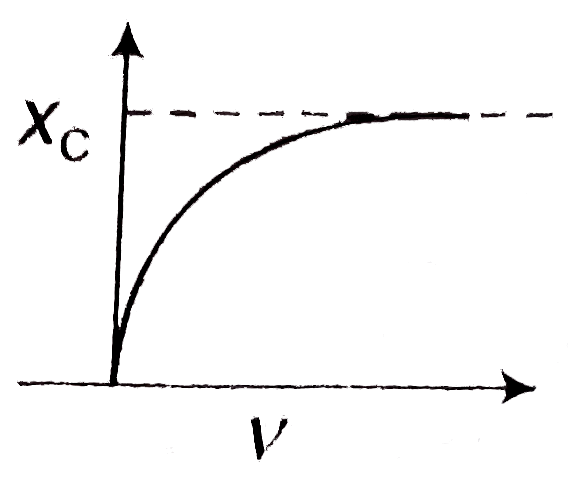
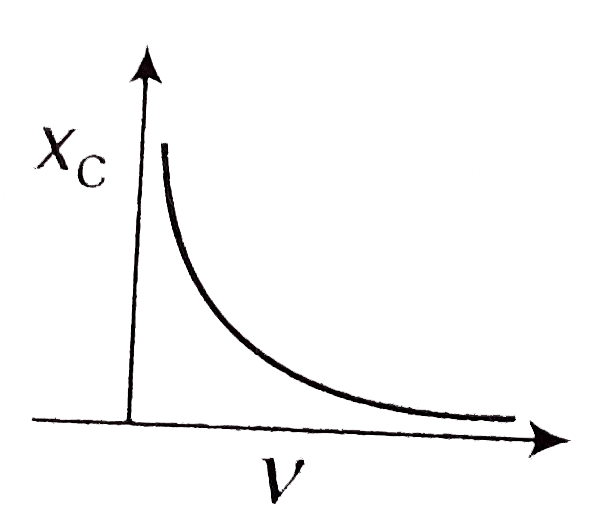
Plot a graph showing variation of capacitive reactance with the change in the frequency of the AC source.
To plot a graph showing the variation of capacitive reactance (Xc) with the change in the frequency (f) of the AC source, we can follow these steps:
1. Understand the Relationship: The capacitive reactance (Xc) is given by the formula:
Xc=1ωC
where ω=2πf (angular frequency) and C is the capacitance.
2. Substitute Angular Frequency: Substitute ω in the equation:
Xc=12πfC
3. Identify the Inverse Relationship: From the equation, it is clear that capacitive reactance (Xc) is inversely proportional to the frequency (f). This means that as the frequency increases, the capacitive reactance decreases.
4. Choose Frequency Values: Select a range of frequency values (for example, from 1 Hz to 100 Hz) to calculate corresponding values of Xc.
5. Calculate Xc Values: For each frequency value, calculate the corresponding Xc using the formula:
Xc=12πfC
(Assuming a constant capacitance, say C=1μF for simplicity).
6. Plot the Graph: On a graph, plot the frequency (f) on the x-axis and the capacitive reactance (Xc) on the y-axis. The graph will show a hyperbolic curve, indicating that as frequency increases, capacitive reactance decreases.
7. Label the Graph: Ensure to label the axes and provide a title for the graph, such as "Variation of Capacitive Reactance with Frequency".
Example Calculation:
- Let’s assume C=1μF=1×10⁻⁶F.
- Calculate Xc for selected frequencies:
- For f=1Hz:
Xc=12π(1)(1×10⁻⁶)≈159.15Ω
- For f=10Hz:
Xc=12π(10)(1×10⁻⁶)≈15.92Ω
- For f=100Hz:
Xc=12π(100)(1×10⁻⁶)≈1.59Ω
Xc=1ωC
where ω=2πf (angular frequency) and C is the capacitance.
Xc=12πfC
Xc=12πfC
(Assuming a constant capacitance, say C=1μF for simplicity).
- Let’s assume C=1μF=1×10⁻⁶F.
- Calculate Xc for selected frequencies:
- For f=1Hz:
Xc=12π(1)(1×10⁻⁶)≈159.15Ω
- For f=10Hz:
Xc=12π(10)(1×10⁻⁶)≈15.92Ω
- For f=100Hz:
Xc=12π(100)(1×10⁻⁶)≈1.59Ω
Topper's Solved these Questions
- BOOK - MODERN PUBLICATIONCHAPTER - ALTERNATING CURRENT EXERCISE - Revision Exercises ( Additional Questions )10videos
ALTERNATING CURRENT
- BOOK - MODERN PUBLICATIONCHAPTER - ALTERNATING CURRENT EXERCISE - Revision Exercises (Fill in the Blanks )10videos
ALTERNATING CURRENT
- BOOK - MODERN PUBLICATIONCHAPTER - ALTERNATING CURRENT EXERCISE - HIGHER ORDER THINKING SKILLS & ADVANCED LEVEL7videos
ALTERNATING CURRENT
- BOOK - MODERN PUBLICATIONCHAPTER - ATOMS EXERCISE - Chapter Practice Test16videos
ATOMS
Similar Questions
Knowledge Check
- Question 1 - Select One
Which one of the follwing represents the variation of capacitive reactance (XC) with the frequency (v) of the voltage source ? .
A B
B C
C D
D
Sketch a graph showing the variation of reactance of an inductor with frequency of the applied voltage
View SolutionHow inductive reactance depends on the frequency of AC ?
View Solution(i) Draw the graphs showing variation of inductive reactance and capacitive reactance with frequency of applied a.c. source.
(ii) Can the voltage drop across the inductor or the capacitor in a series LCR circuit be greater than the applied voltage of the a.c. source ? Justify your answer.View SolutionMention the factors on which the resonant frequency of a series LCR circuit depends. Plot a graph showing variation of impedance of a series LCR circuit with the frequency of the applied a.c. source.
View SolutionPlot a graph showing variation of current versus voltage for the material Ga.
View SolutionExplain the term 'capacitive reactance'.Show graphically the variation of capacitive reactance with frequency of the applied alternating voltage.
An a.c. voltage E=E0sinωt is applied a across a pure capacitor C.Show mathematically that the current flowing through it leads the applied voltage by a phase angle of π/2View SolutionHow will the inductive reactance and capacitive reactance change on doubling the frequency of AC ?
View Solution

