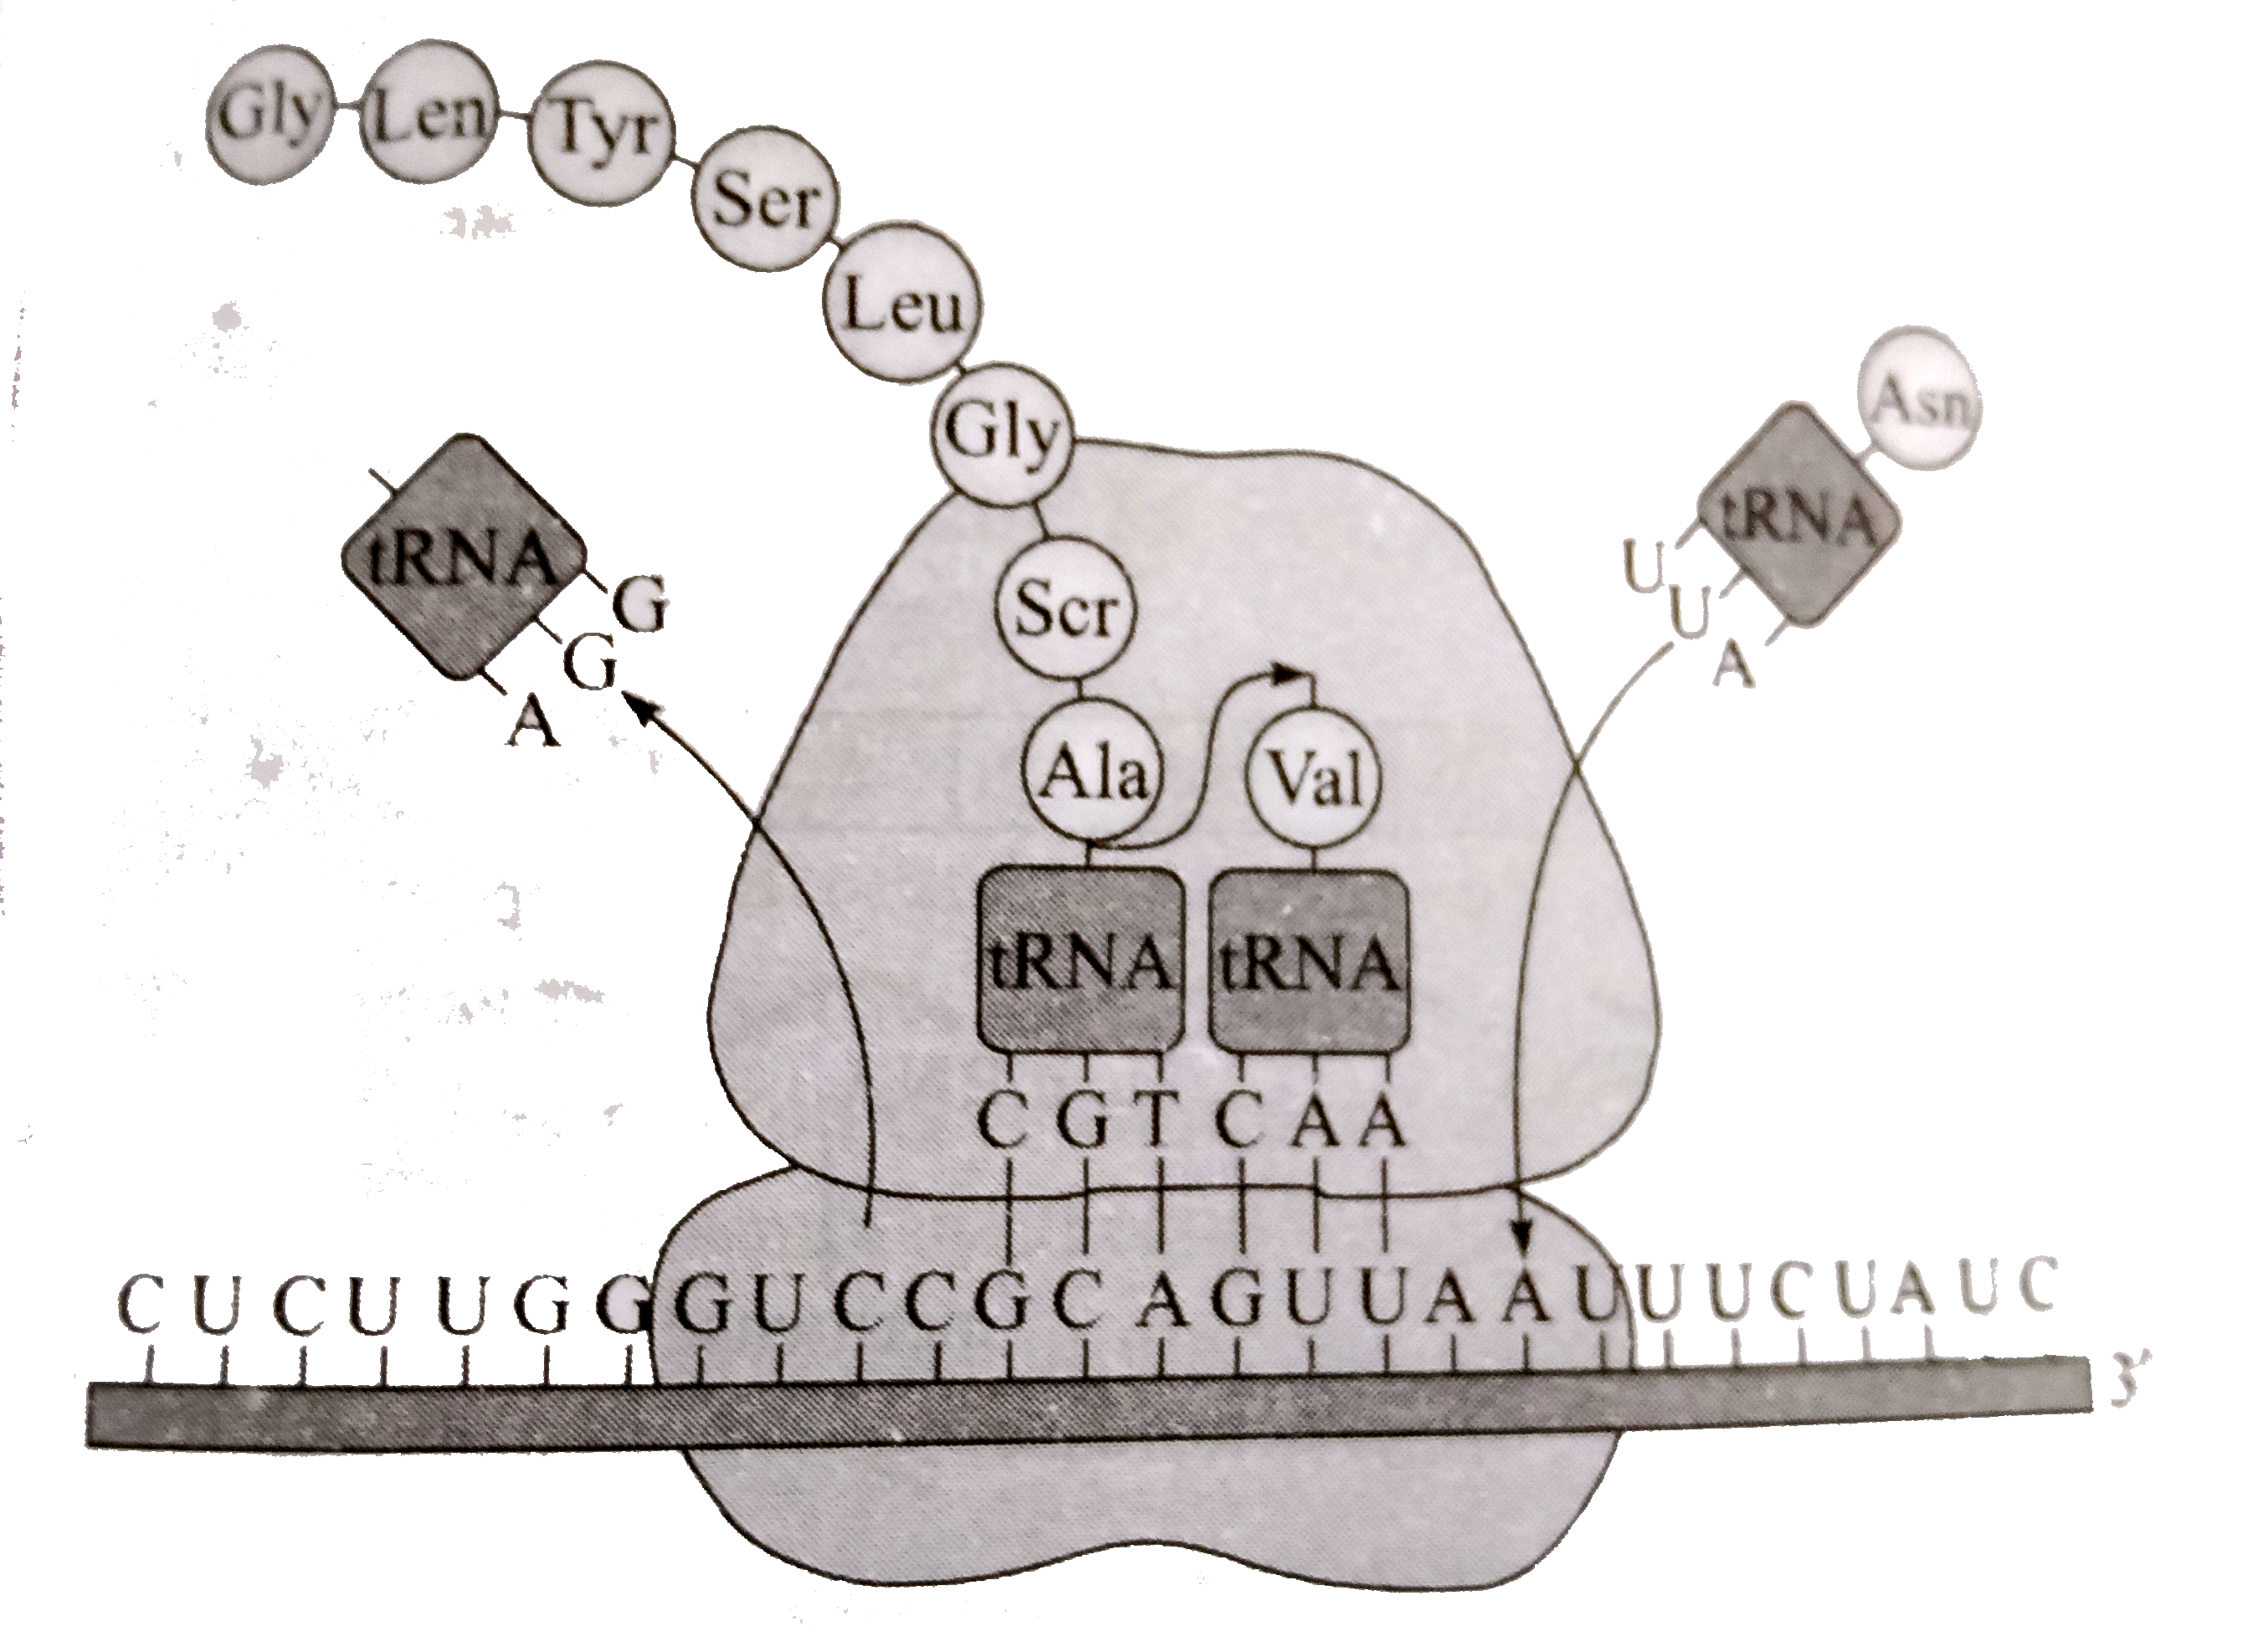
The following figure shows the process of
A
Transcription and translation
B
Translation
C
Replication
D
Central dogma
Video Solution
Text Solution
The correct Answer is:B
|
Answer
Step by step video & image solution for The following figure shows the process of by Biology experts to help you in doubts & scoring excellent marks in Class 12 exams.
Updated on:21/07/2023Topper's Solved these Questions
- MOLECULAR BASIS OF INHERITANCEBook:A2ZChapter:MOLECULAR BASIS OF INHERITANCEExercise:Section A: Topicwise Questions (topic 7: Regulation Of Gene Expression) The Lac Operon
Explore 25 Videos
- MOLECULAR BASIS OF INHERITANCEBook:A2ZChapter:MOLECULAR BASIS OF INHERITANCEExercise:Section A: Topicwise Questions (topic 8:(human Genome Project) Salient Features Of Human Genome, App
Explore 12 Videos
- MOLECULAR BASIS OF INHERITANCEBook:A2ZChapter:MOLECULAR BASIS OF INHERITANCEExercise:Section A: Topicwise Questions (topic 5: Genetic Code) Mutations And Genetic Code, Trna-the Adapter
Explore 35 Videos
- MOCK TEST 3Book:A2ZChapter:MOCK TEST 3Exercise:EXERCISE
Explore 90 Videos
- ORGANISMS AND POPULATIONS Book:A2ZChapter:ORGANISMS AND POPULATIONS Exercise:Section D: Chapter-end Test
Explore 50 Videos
Similar Questions
Knowledge Check
Which of the following reactions show the process of smelting ?
A2PbO+PbS→3Pb+SO2B2Na[Au)CN)2]+Zn→Na2[Zn(CN)4]+2AuCPbO+C→Pb+COD2HgS+3O2→2HgO+2SO2Following figure shows two process A and B for a gas. If ΔQA and ΔQB are the amount of heat absorbed by the system in two case, and ΔUA and ΔUB are changes in internal energies, respectively, then :
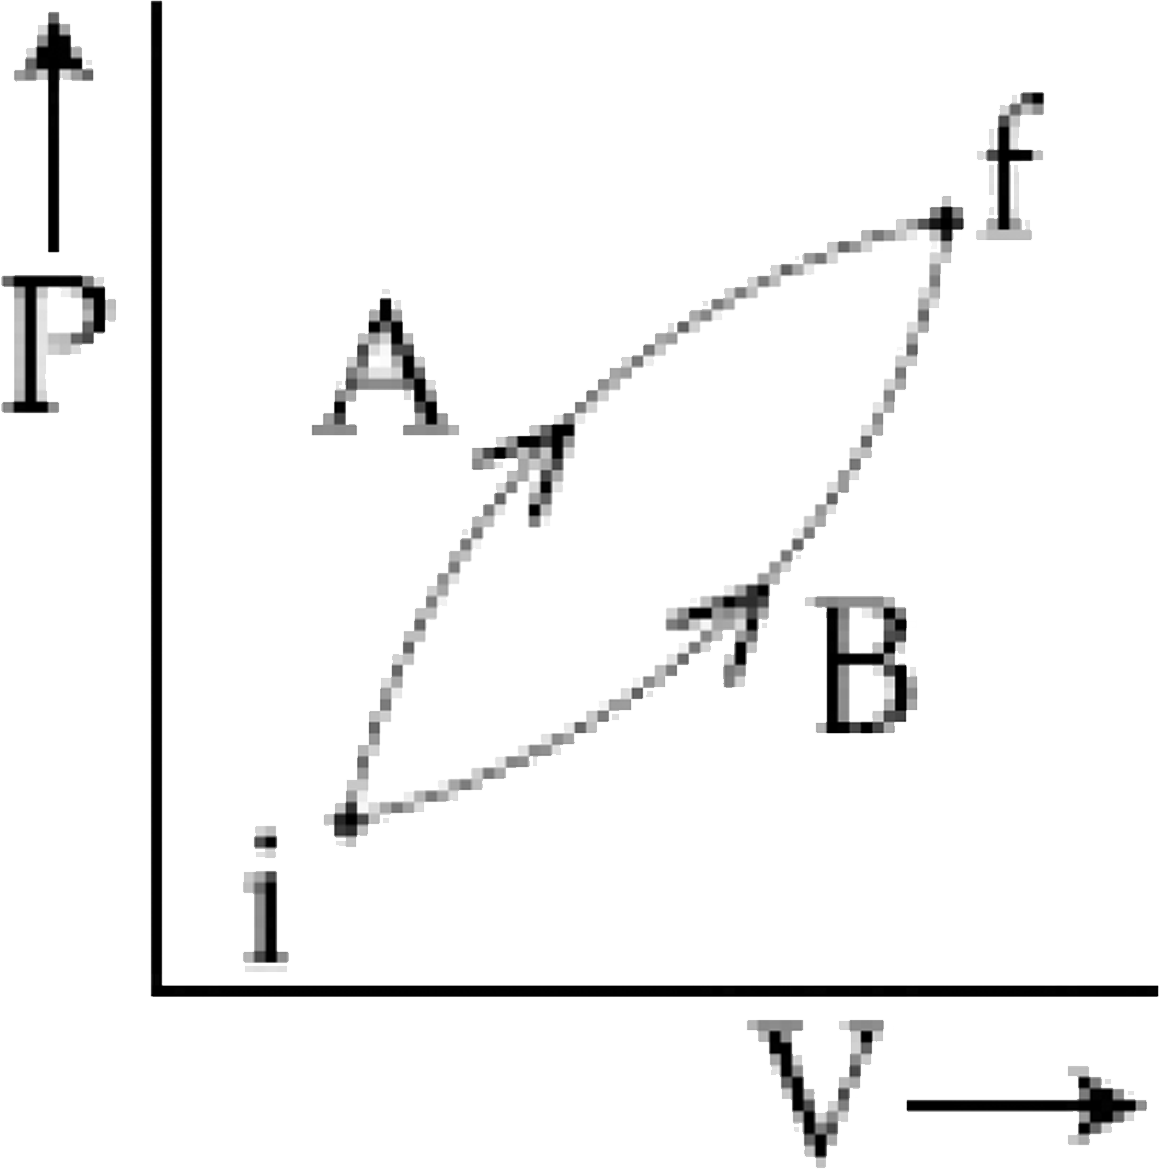 AΔQA<ΔQB,ΔUA<ΔUBBΔQA>ΔQB,ΔUA>ΔUBCΔQA>ΔQB,ΔUA=ΔUBDΔQA=ΔQB,ΔUA=ΔUB
Which of the following figures shows tubectomy ?
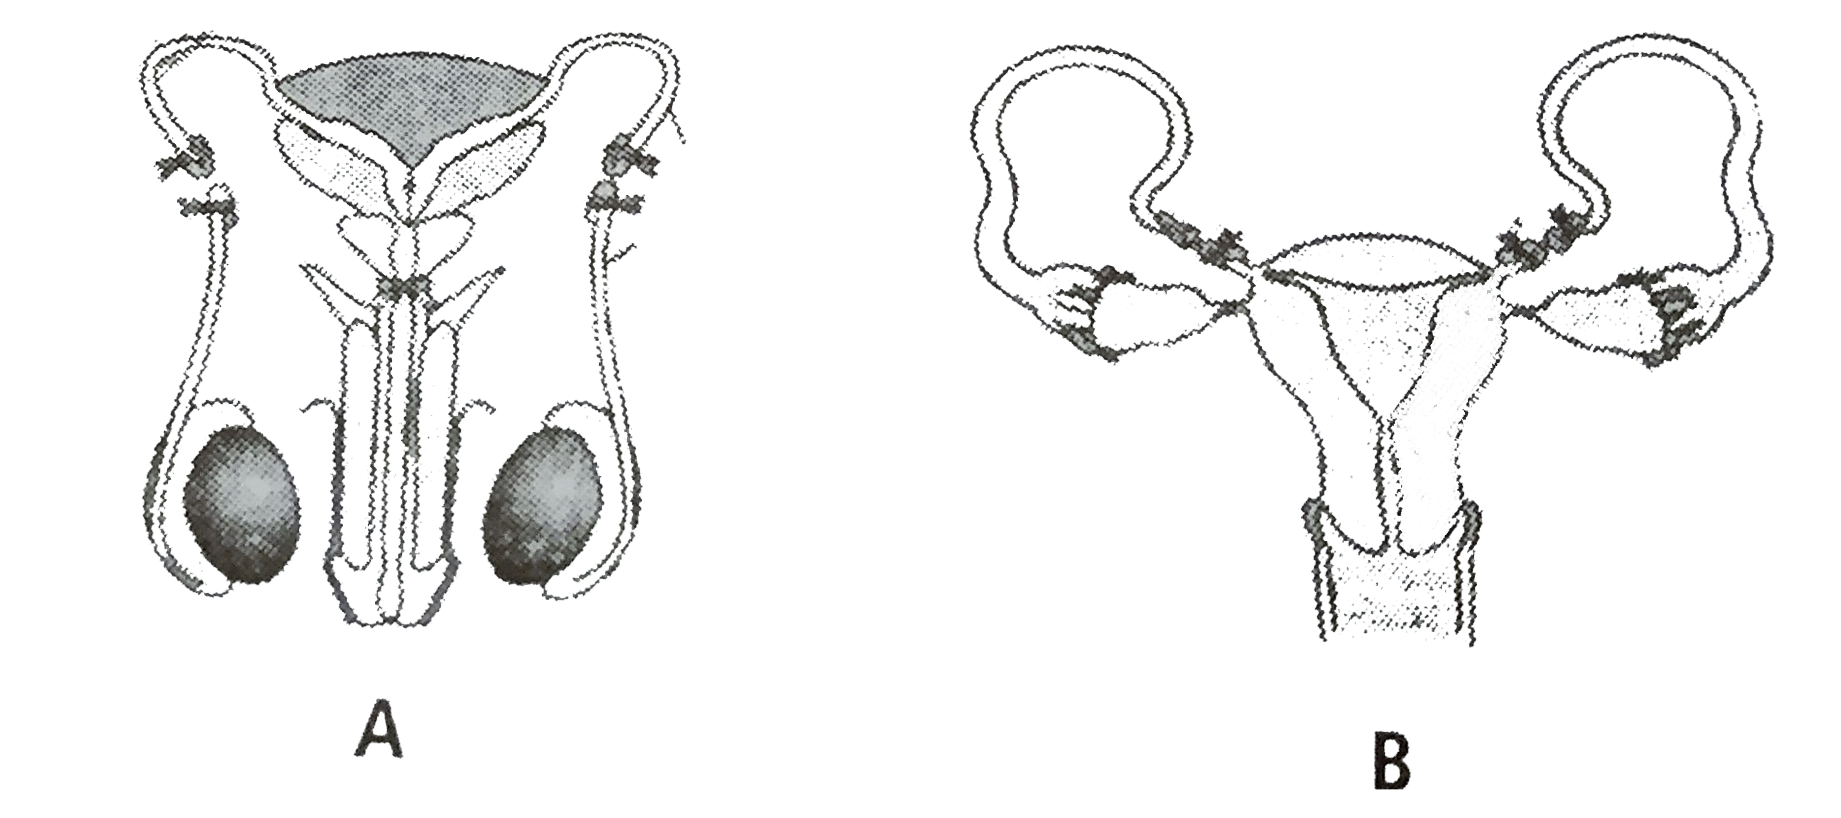 AA onlyBB onlyCEither A or BDNone of these
The following figure shows the phenomenon of
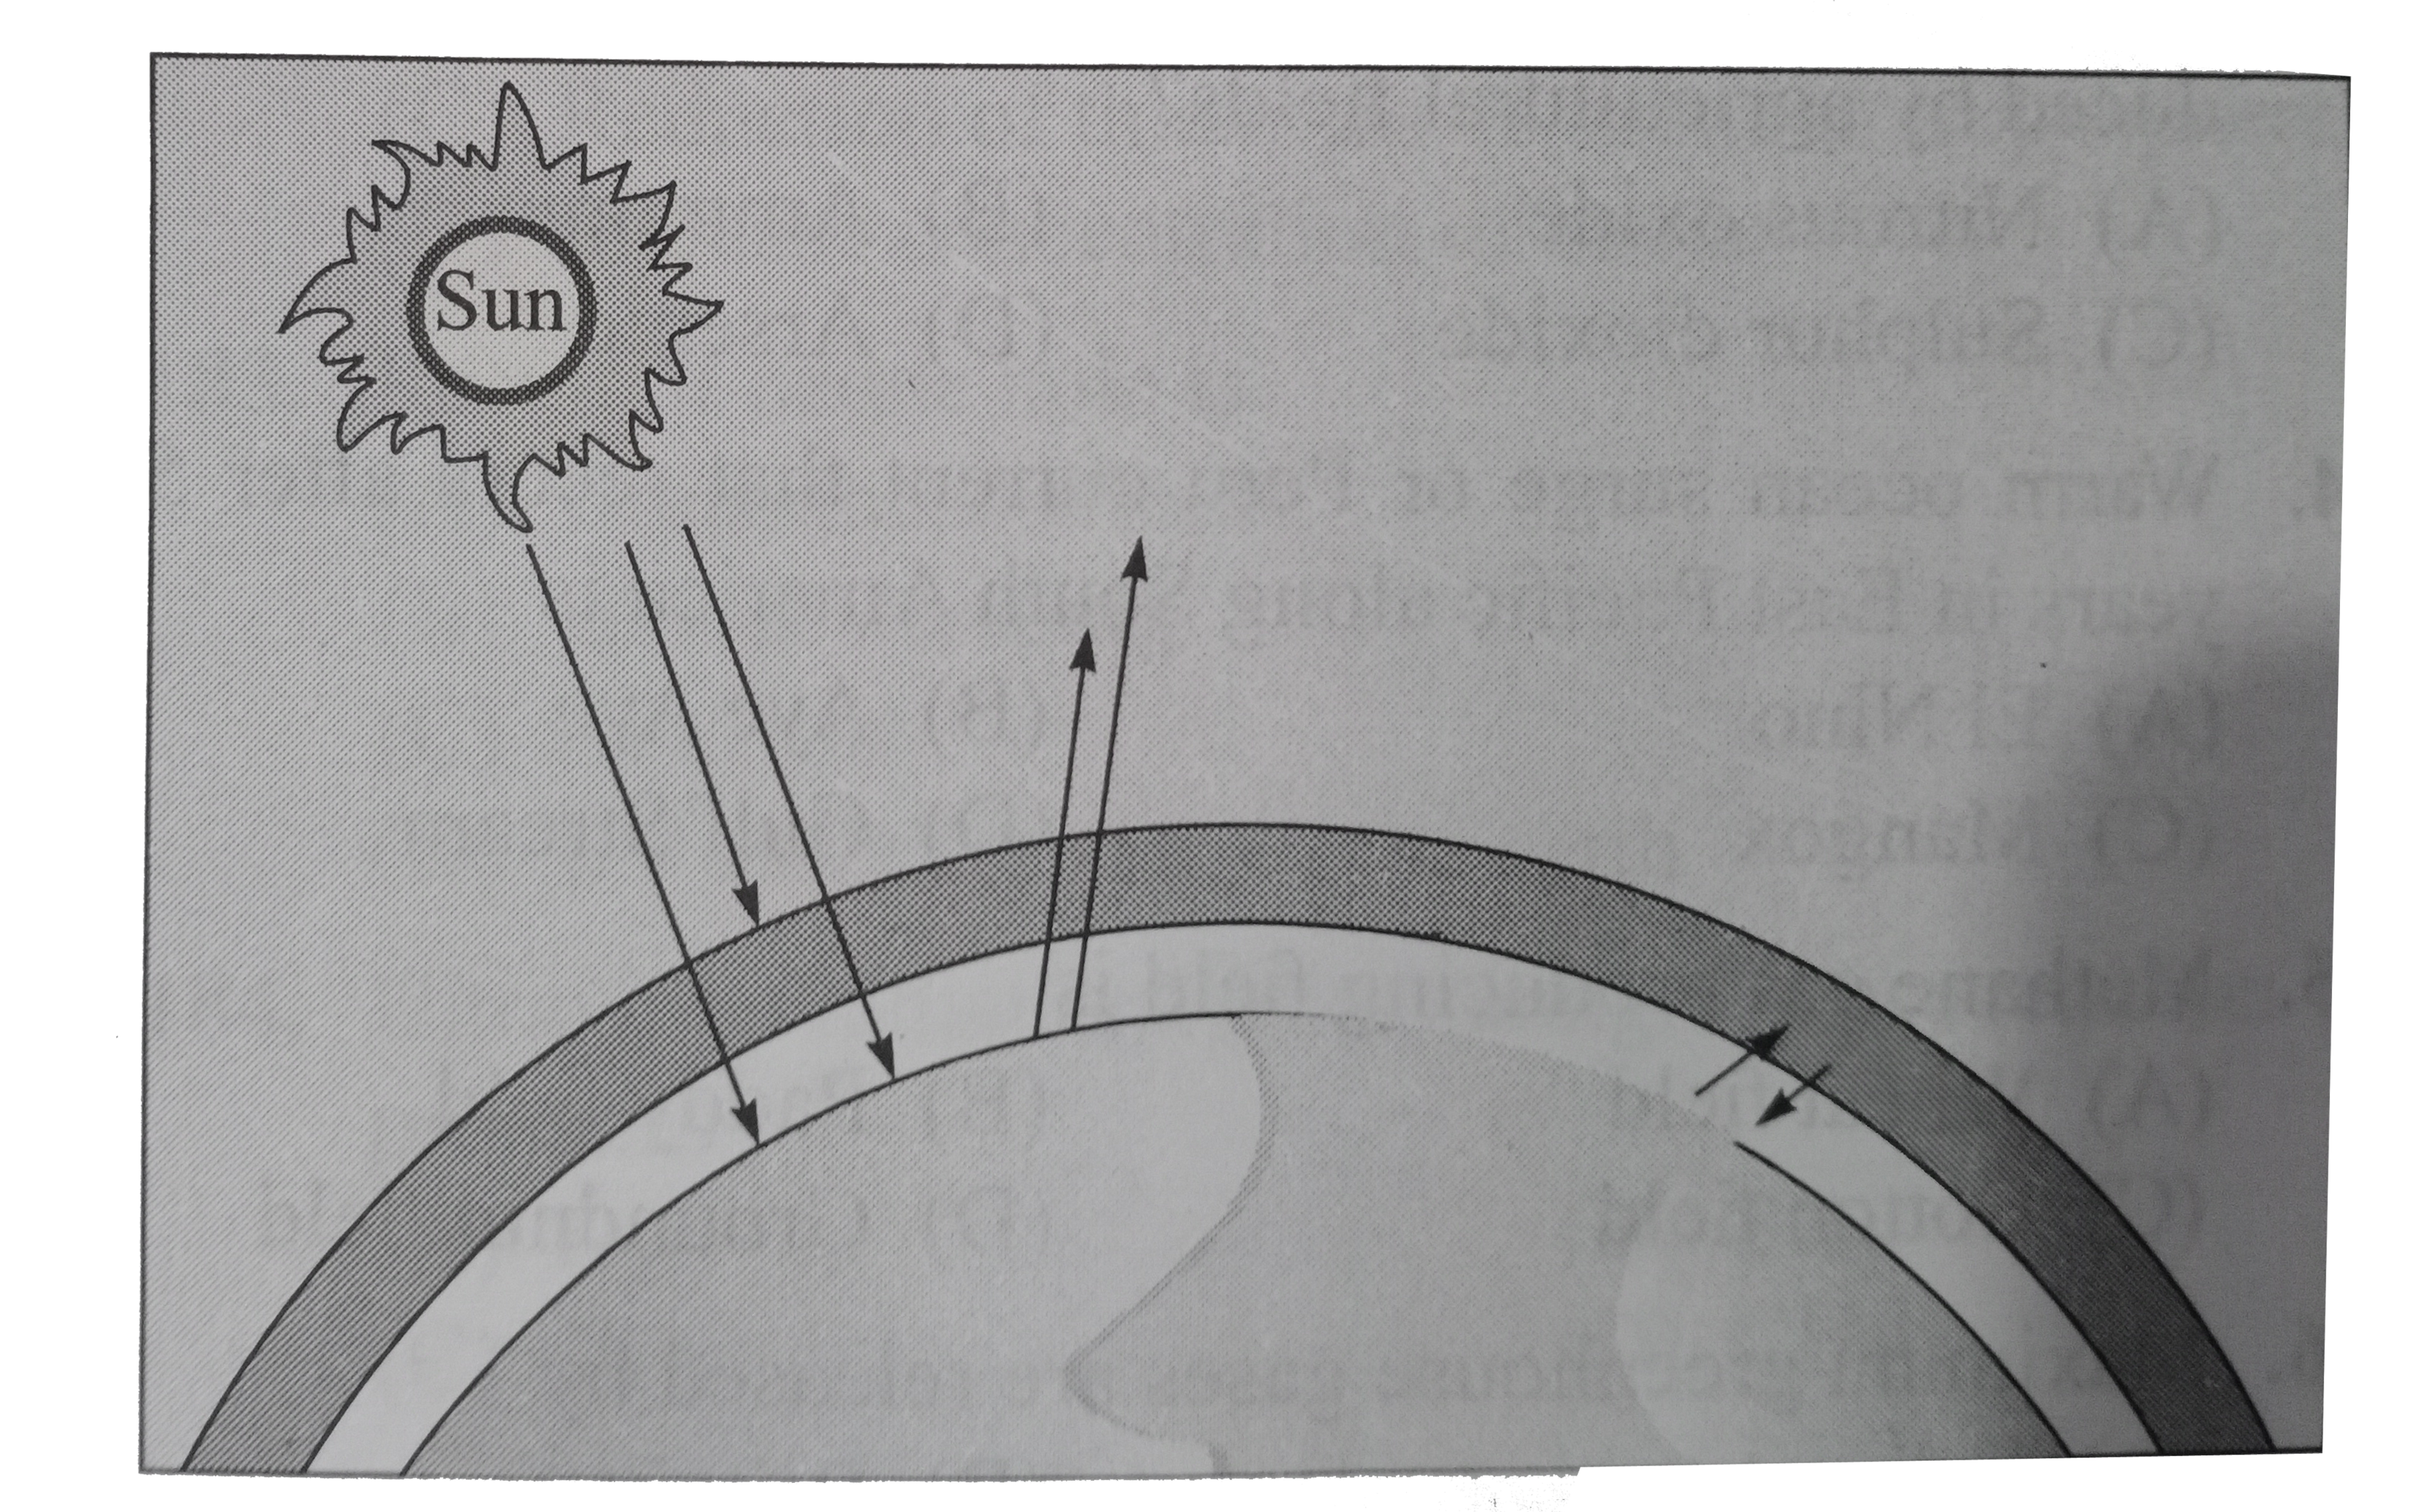
View SolutionWhich of the following figure shows the mandibles of cockroach ?
View SolutionWhich of the following figures shows the mandibles of cockroach ?
View SolutionThe following diagram shows which process of light? Write its laws
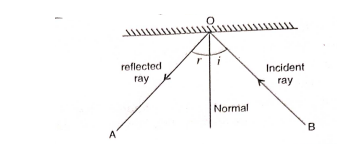
View SolutionA cyclic process is shown in the p – T diagram . Which of the following curves shows the same process on the p – V diagram ?
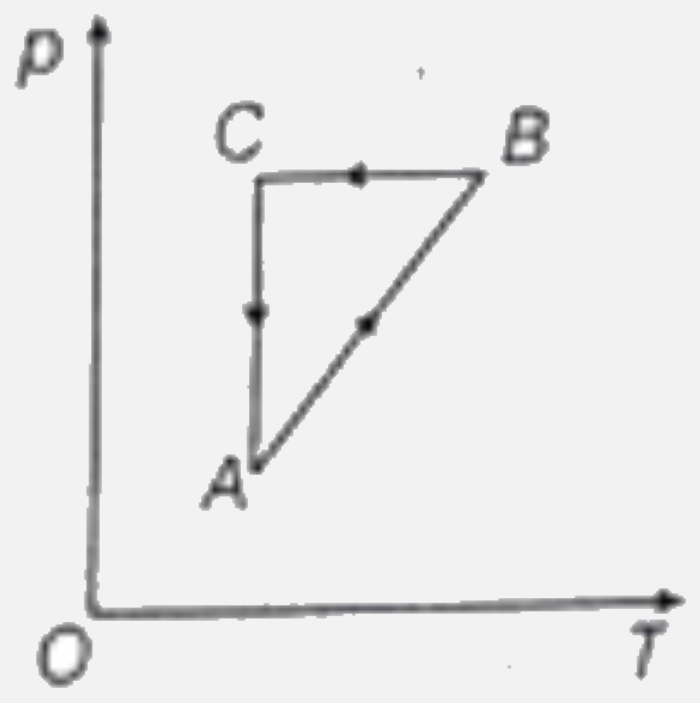
View Solution

