The given graph shows pressure changes in the left side of the heart during a single heart beat

Between points W and X, which of the following valves are open or closed respectively ?
Atrio-ventricular valves Semilunar valves Closed Closed
Atrio-ventricular valves Semilunar valves Closed Open
Atrio-ventricular valves Semilunar valves Open Closed
Atrio-ventricular valves Semilunar valves Open Open
The correct Answer is:B
Step by step video, text & image solution for The given graph shows pressure changes in the left side of the heart during a single heart beat Between points W and X, which of the following valves are open or closed respectively ? by Biology experts to help you in doubts & scoring excellent marks in Class 11 exams.
Topper's Solved these Questions
- BOOK - NCERT FINGERTIPSCHAPTER - TEST PAPEREXERCISE - Test Paper 250videos
TEST PAPER
- BOOK - NCERT FINGERTIPSCHAPTER - STRUCTURAL ORGANISATION IN ANIMALSEXERCISE - Structural Organisation In Animals129videos
STRUCTURAL ORGANISATION IN ANIMALS
- BOOK - NCERT FINGERTIPSCHAPTER - THE LIVING WORLDEXERCISE - The Living World130videos
THE LIVING WORLD
Similar Questions
At the instant following the second heart sound,which heart valves are open ?
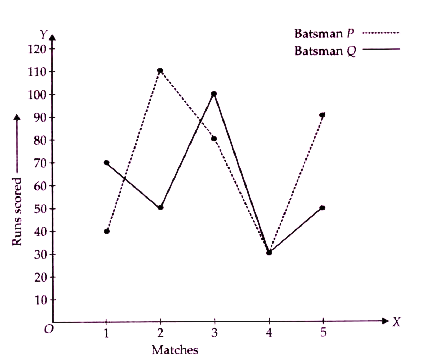
View SolutionPerformance based graph) The given graph shows the total runs scored by two batmans P and Q during each of the five different matches in the year 2011. study the graph and answer the following questions :
Which line shows the runs scored by batmans Q?
 View Solution
Knowledge Check
- Question 1 - Select One
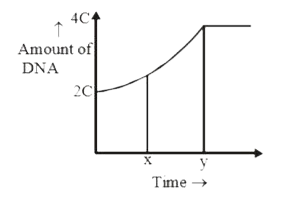
The given graph shows the change in DNA content in a single cell during the mitosis which stage occurs between the time x and y ?
 AInterphaseBProphaseCAnaphaseDTelophase
 - Question 2 - Select One
Narrowing of which of the following heart valves would cause blood to accumulate in the left atrium ?
ATricuspid valveBAortic valveCMitral valveDPulmonic valve - Question 3 - Select One
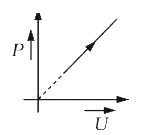
The given P-U graph shows the variation of internal energy of an ideal gas with increase in pressure. Which of the following pressure-volume graph is equivalent to this graph?
 A
A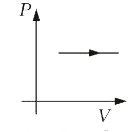 B
B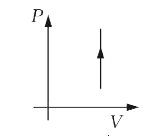 C
C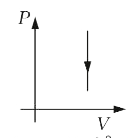 D
D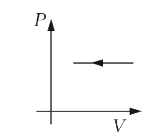
The figure given below shows three glass chambers that are connected by valves of negligible volume. At the outset of an experiment, the valves are closed and the chambers contain the gases as detailed in the diagram. All the chambers are at the temperature of 300K and external pressure of 1.0atm.
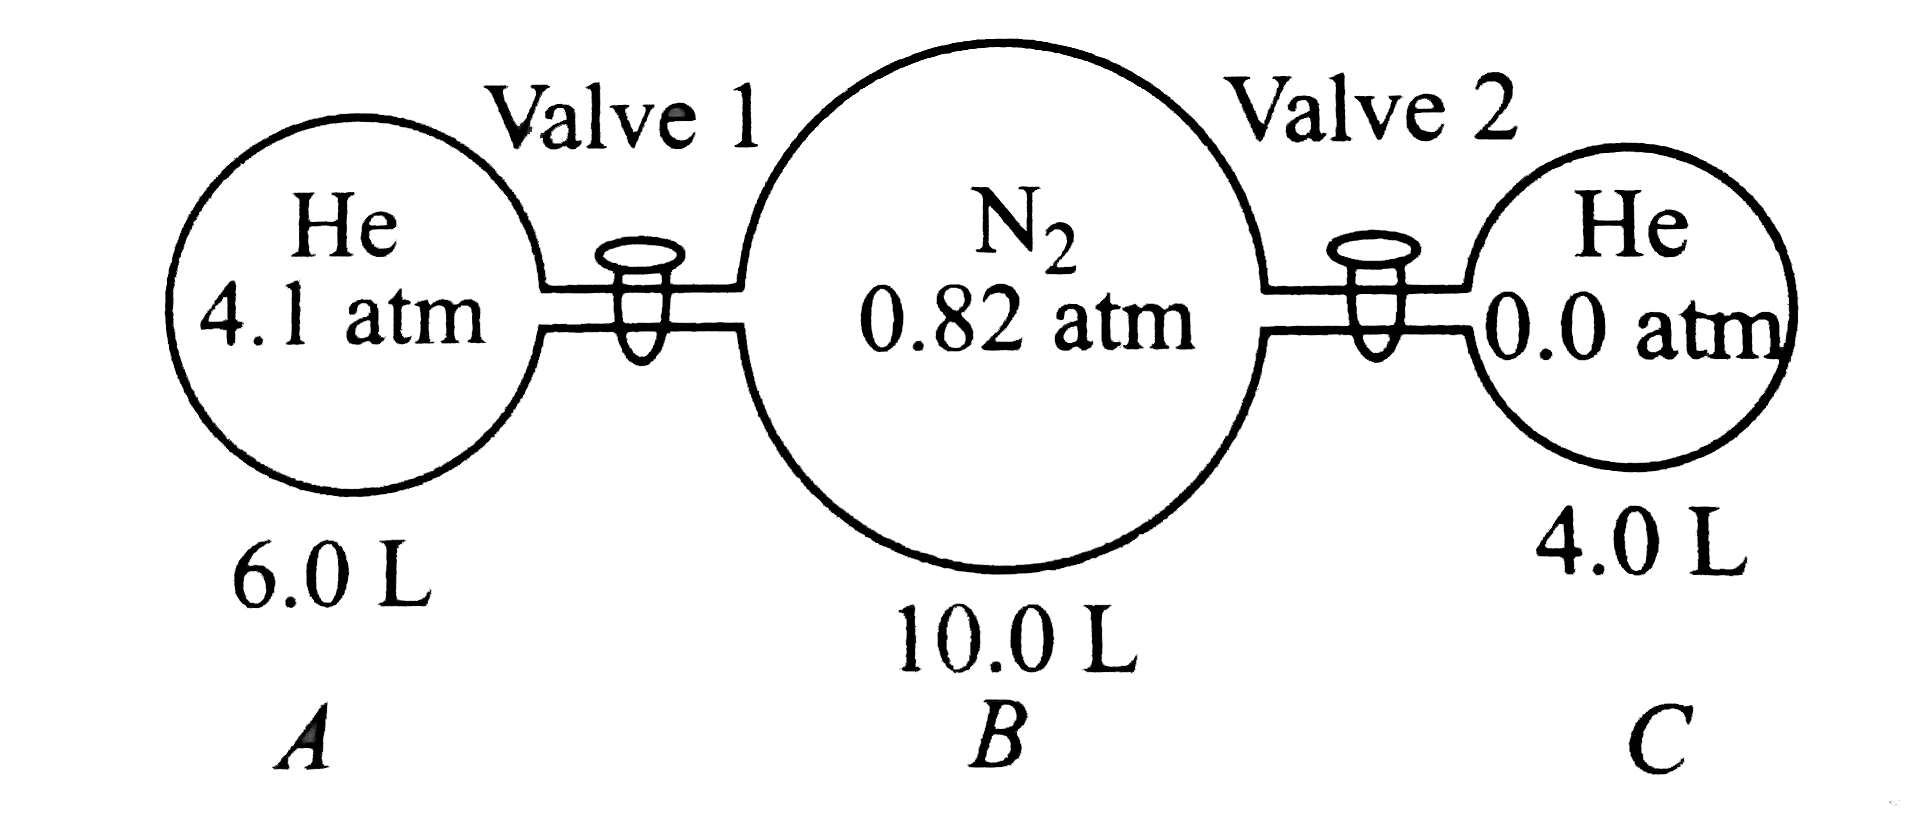
Which of the following represents the total kinetic energy of all the gas molecules after both valves are opened?
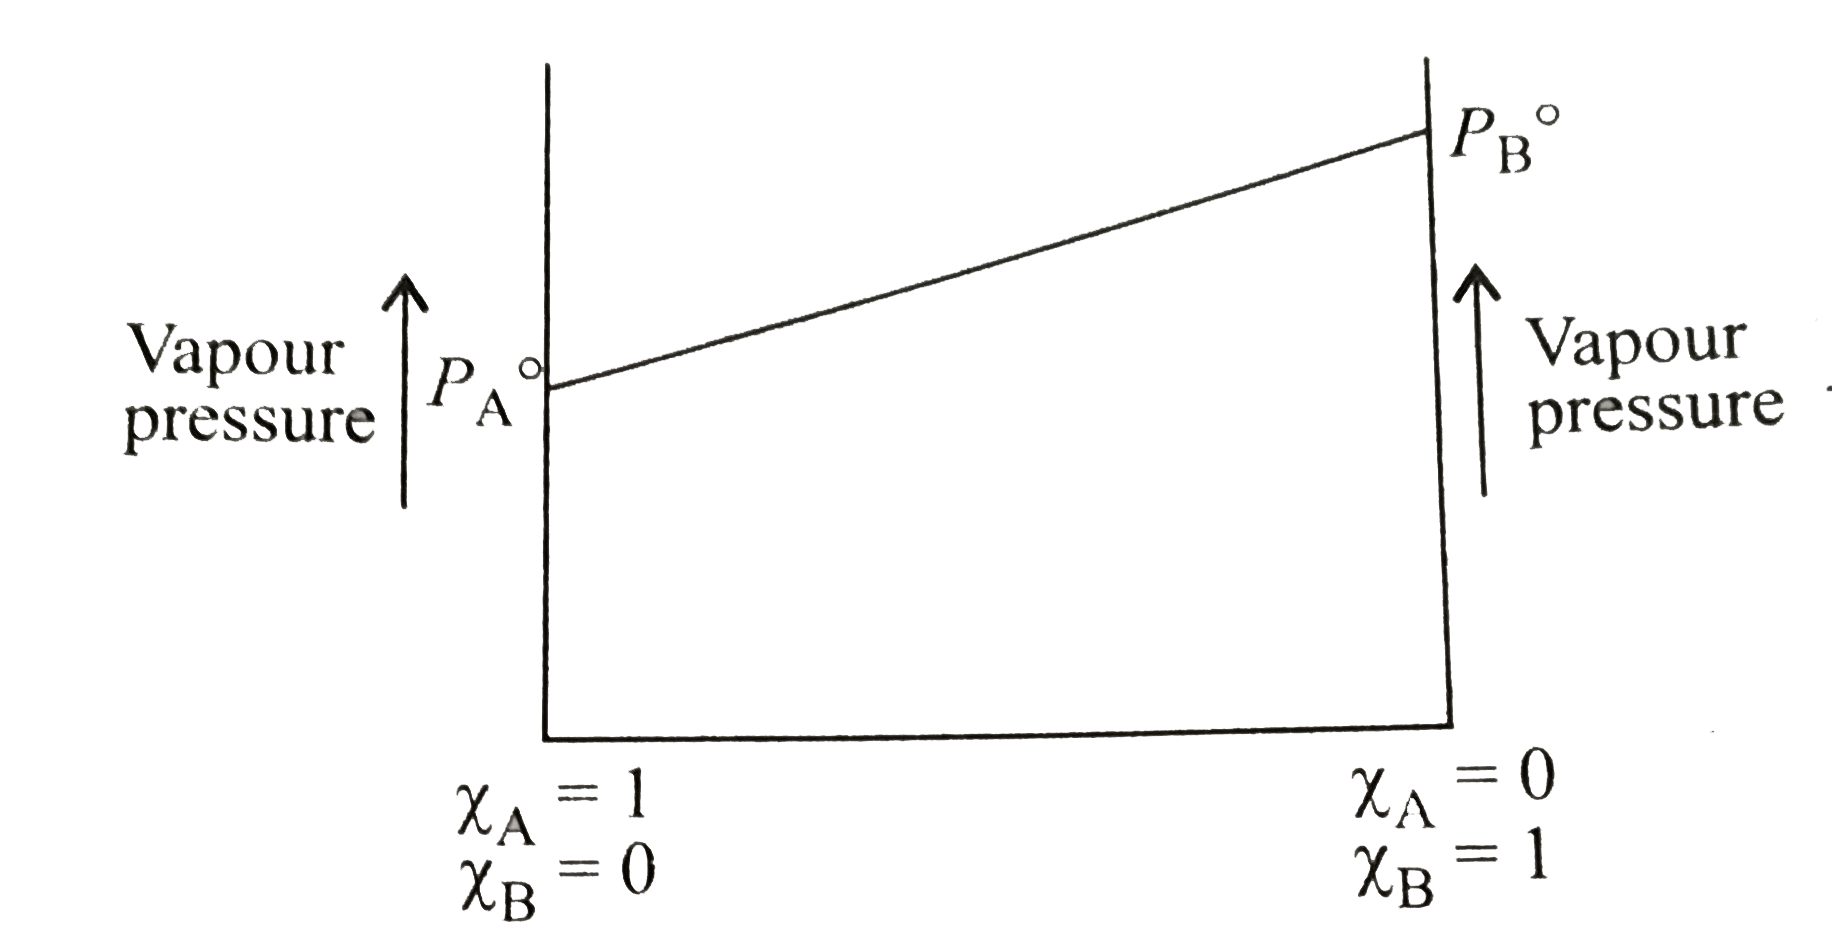
(R=0.082atmLK−1mol−1=8.314JK_1mol−1)View SolutionThe following is a graph plotted between the vapour pressure of two volatile liquids against their respective mole fractions. Which of the following statements is/are correct?
 View Solution
Read the following passages carefully and answer the questions that follow.
As heart disease continues to be the number one killer in the United States, researchers have become increasingly interested in identifying the potential risk factors that trigger heart attacks. High-fat diets and life in the fast lane have long been known to contribute to the high incidence of heart failure. But according to new studies, the list of risk factors may be significantly longer and quite surprising.
Heart failure, e.g. appears to have seasonal and temporal patterns. A higher percentage of heart attacks occurs in cold weather and more people experience heart failure on Monday than on any other day of the week. In addition, people are more susceptible to heart attacks in the first few hours after waking. Cardiologists first observed this morning phenomenon in the mid-1980 and have since discovered a number of possible causes. An early morning rise in blood pressure, heart rate and concentration of heart stimulating hormones, plus a reduction of blood flow to the heart, may all contribute to the higher incidence of heart attacks between the hours of 8:00 am and 10:00 am. In other studies, both birthday and bachelorhood have been implicated as risk factors. Statistics reveal that heart attack rate increases significantly for both females and males in the few days immediately preceding and following their birthdays. And unmarried men are more at risk for heart attacks than their married counterparts. Though stress is thought to be linked in some way to all of the aforementioned risk factors, intense research continues in the hope of future comprehending why and how heart failure is triggered.
According to the passage, which of the following is not a possible cause of many heart attacks?View SolutionThe diagram shows the valves inside the heart.
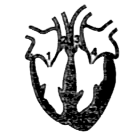
Which valves are open or closed when the atria are relaxed and the ventricles contracted?View SolutionA graph between vapour pressure and temperature of few liquids is given below. Study the graph and answer following question.
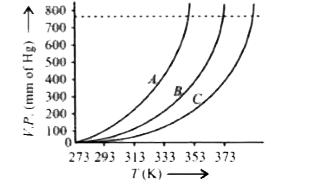
Which of the following statements is not true?View Solution
