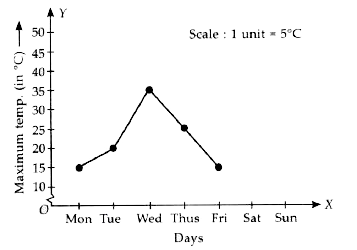
The graph given below shows the responses of the attack of an influenza virus in a patient repeatedly during the interval of 40 days.
a. In secondary attack more antibody is produced than primary attack.
b. In this stage the memory cells during secondary response produce more antibody rapidly than primary response. So the concentration of antibody increases and the disease may cure easily than the first attack.
Topper's Solved these Questions
- HUMAN HEALTH AND DISEASEBOOK - NEW JOYTHI PUBLICATIONCHAPTER - HUMAN HEALTH AND DISEASEEXERCISE - PREVIOUS YEAR HSE QUESTIONS
12 Videos
- HUMAN HEALTH AND DISEASEBOOK - NEW JOYTHI PUBLICATIONCHAPTER - HUMAN HEALTH AND DISEASEEXERCISE - PREVIOUS YEAR COMPETITIVE EXAM QUESTIONS
28 Videos
- HUMAN HEALTH AND DISEASEBOOK - NEW JOYTHI PUBLICATIONCHAPTER - HUMAN HEALTH AND DISEASEEXERCISE - NEW EVALUATION TYPE QUESTIONS
43 Videos
- EVOLUTION BOOK - NEW JOYTHI PUBLICATIONCHAPTER - EVOLUTION EXERCISE - Previous Year Competitive Exam Questions(MCQs)
50 Videos
- HUMAN REPRODUCTION BOOK - NEW JOYTHI PUBLICATIONCHAPTER - HUMAN REPRODUCTION EXERCISE - PREVIOUS YEAR COMPETITIVE EXAM
18 Videos
Similar Questions
Knowledge Check
The bar graph given below shows the spending of a family income on various items and savings during 1993. Observe the graph and answer the following questions :
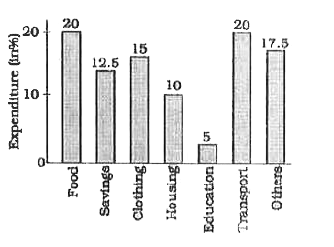
If the total income of the family during 1993 was Rs. 100000, the savings of the family in 1993 was :ARs. 1,750BRs. 20,000CRs. 12,500DRs. 50,000The bar graph given below shows the spending of a family income on various items and savings during 1993. Observe the graph and answer the following questions :
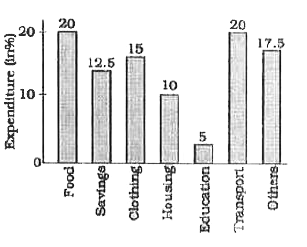
The savings of the family is more than that of expenditure incurred on:AhousingBclothingCtransportDothersThe bar graph given below shows the spending of a family income on various items and savings during 1993. Observe the graph and answer the following questions :
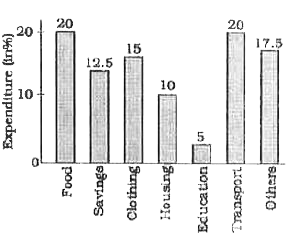
The percent of income spent on clothing exceeds that on savings by :A12.5%B20%C10%D22.5%
The diagram given below shows a few parts of a cell.
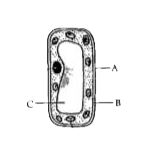
Is it a plant or animal cell? Give a reason to support your answer.
View SolutionThe figure given below represents the set-up at the start of certain experiment to demonstrate an activity of plants:
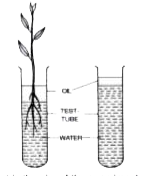
Give reason to explain any change observed in test tubes after 2-3 days?
View SolutionThe bar graph given below shows the spending of a family income on various items and savings during 1993. Observe the graph and answer the following questions :
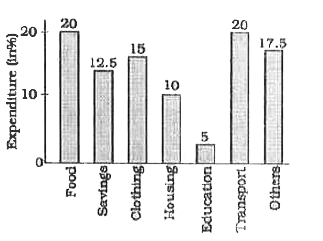
The total expenses of the family on transport are equal to those spent on :
View SolutionThe bar graph given below shows the spending of a family income on various items and savings during 1993. Observe the graph and answer the following questions :
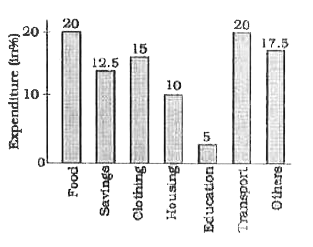
The percent of income spent on food is :
View SolutionThe circle graph given here shows the spendings of a country on various sports during a particular year, study the graph carefully and answer the questions given below it.
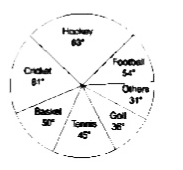
What per cent of the total spendings is spent on tennis ?
View Solution

