What percent of food grains produced in our country is lost every year ?
The correct Answer is:N/a
Topper's Solved these Questions
- IMPROVEMENTS IN FOOD RESOURCES BOOK - LAKHMIR SINGH & MANJIT KAURCHAPTER - IMPROVEMENTS IN FOOD RESOURCES EXERCISE - FORMATIVE ASSESSMENT
1 Videos
- IMPROVEMENTS IN FOOD RESOURCES BOOK - LAKHMIR SINGH & MANJIT KAURCHAPTER - IMPROVEMENTS IN FOOD RESOURCES EXERCISE - FILL IN THE BLANKS
3 Videos
- DIVERSITY IN LIVING ORGANISMSBOOK - LAKHMIR SINGH & MANJIT KAURCHAPTER - DIVERSITY IN LIVING ORGANISMSEXERCISE - Value Based
5 Videos
- MODEL TEST PAPER 1BOOK - LAKHMIR SINGH & MANJIT KAURCHAPTER - MODEL TEST PAPER 1EXERCISE - SECTION B
1 Videos
Similar Questions
Knowledge Check
In the year 2000, rice formed 20% of the total food grain production in a country. In the next year, the total food grain production increased by 20% and the rice production was 25% of the total food grain production. What is the increase in the production of rice from 2000 to 2001?
A0.25B0.5C0.4D0.3In the year 2000, rice formed 20% of the total food grain production in a country. In the next year, the total food grain production increased by 20% and the rice production was 25% of the total food grain production. What is the increase in the production of rice from 2000 to 2001?
A25%B50%C40%D30%The graph shows the production of food grains of a country in different years. Study the graph and answer the questions.
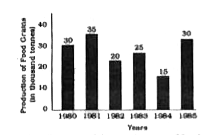
The difference between the production of food grains in the years 1981 and 1985 isA500 tonnesB100 tonnesC5000 tonnesD10000 tonnes
Despite of a good monsoon (1)/this year, the production (2)/of food grains in the (3)/country did not go up. (4)/No error (5)
View SolutionThe graph shows the production of food grains of a country in different years. Study the graph and answer the questions.
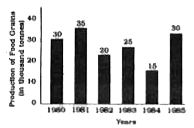
The sum of the production of food grains in the years 1982 and 1984 is equal to that in the year :
View SolutionThe graph shows the production of food grains of a country in different years. Study the graph and answer the questions.
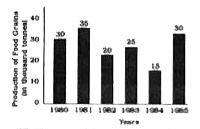
The two consecutive years in which rate of change of production of food grains is minimum are
View SolutionThe graph shows the production of food grains of a country in different years. Study the graph and answer the questions.
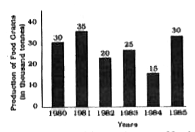
The percentage increase in production from 1984 to 1985 was
View SolutionStudy the graph and answer the following questions-
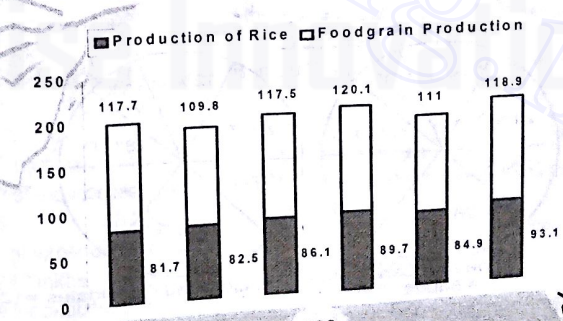
Average production of rice is what percent of the maximum recorded production of food grains over the years?
View Solution

