Study the graph and answer the following questions-
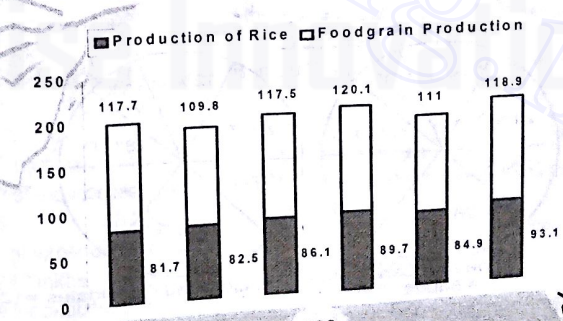
Average production of rice is what percent of the maximum recorded production of food grains over the years?
42.5%
38.4%
42.7%
40.7%
The correct Answer is:D
Topper's Solved these Questions
Similar Questions
The bar diagram below shows the production of potatoes (in quintals) form the year 2001 to 2006. Study the diagram and answer the following questions.
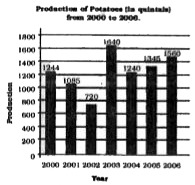
Considering the average production during this period, the number of years in which the production is above average is :
View SolutionThe following graph shows the production of wheat flour (in 1000 tonnes) by three companies X, Y and Z over the years. Study the graph and answer the questions.
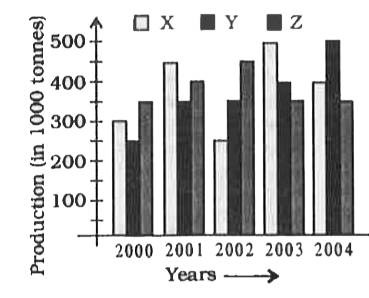
What is the ratio of the average production of company X in the period 2002-2004 to the average production of company Y in the same period ?
View Solution
Knowledge Check
Study the graph and answer the following questions-
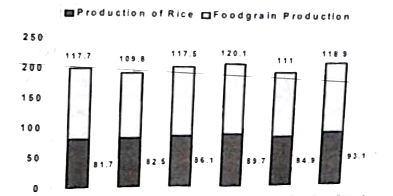
Over the given years what is average production of rice?A86.33 million tonnesB88.66 million tonnesC85 million tonnesD88 million tonnesWhat is the average production of rice in state A over the years.
A6B6.1C5.8D5.9Study the graph carefully and answer the following questions.
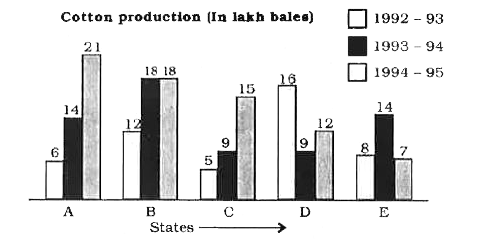
What is the average production of the four states in the year 1994-95 taken together ?A12.3B14.6C15.6D16.3
The following table shows the productions of food-grains (in million tons) in a state for the period 1999-2000 to 2003-2004. Read the table and answer the questions
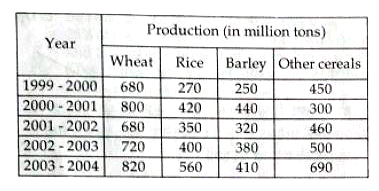
The difference of average production of rice and the average production of barley over the years is
View SolutionStudy the following graph and answer questions
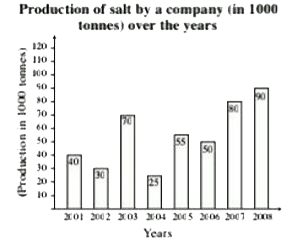
The average production of 2004 and 2005 was exactly equal to the average production of which of the following pairs of years?
View SolutionThe following graph shows the production of wheat flour (in 1000 tonnes) by three companies X, Y and Z over the years. Study the graph and answer the questions.
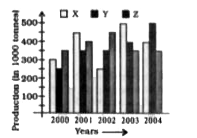
What is the ratio of the average production of company X in the period 2002-2004 to the average production of company Y in the same period ?
View SolutionStudy the graph and answer the question.
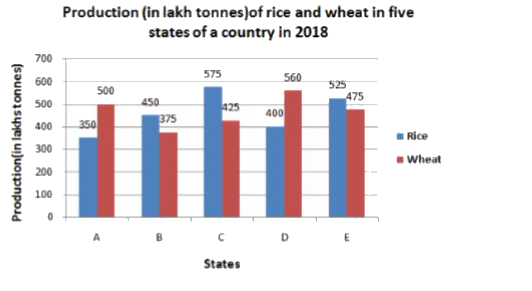
The number of states in which the production of rice is more than 20% of the total production of rice in all five states is ............
View SolutionThe following graph shows production (in thousands) of two types (P and Q) of vehicles by a factory over the years 2009 to 2014. Study the graph and answer the given questions.
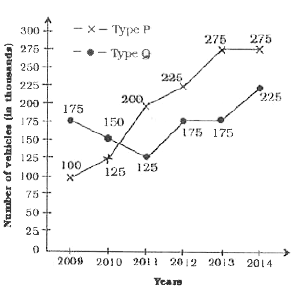
The ratio of total production of Type P vehicles to total production of type Q vehicles over the years is
View Solution
