Which of the following best illustrates feedback in development ?
A
As tissue 'X' develops, it secretes enzyme to inhibit development of tissue 'Y'
B
As tissue 'X' develops, it secreates something that induces tissue 'Y' to develop
C
As tissue 'X' develops, it secretes something that slows down grouwth of tissue 'Y'
D
Tissue 'X' secretes RNA which changes the development of tissue 'Y'.
Video Solution
Text Solution
The correct Answer is:A
In shrimp/crustancean development, 'X' controls reproductive growth while 'Y' controls ecdysis or moulting.
|
Topper's Solved these Questions
- PHYLUM - ARTHROPODABOOK - DINESH PUBLICATION ENGLISHCHAPTER - PHYLUM - ARTHROPODAEXERCISE - CYG
20 Videos
- PHYLUM - ANNELIDABOOK - DINESH PUBLICATION ENGLISHCHAPTER - PHYLUM - ANNELIDAEXERCISE - Check your grasp
10 Videos
- PLANT BREEDING AND DISEASE CONTROLBOOK - DINESH PUBLICATION ENGLISHCHAPTER - PLANT BREEDING AND DISEASE CONTROLEXERCISE - Check your Grasp
10 Videos
Similar Questions
Knowledge Check
Which of the following best illustrates the idea of increasing levels of organizational complexity ?
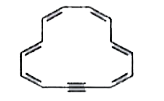
ATissue, chemical, cellular, organ, system, organismicBCellular, chemical, tissue, organismic, organ, systemCChemical, cellular, tissue, organ, system, organismicDChemical, tissue, cellular, organ, organismic, systemWhich of the following may best be called aromatic ?
A B
B C
C D
D
Which of the following declarations illustrate function overloading
Aint callme(int,int) , int callme(int,float)Bfloat callme(int,int) , int callme(int,int)Cint callme(int,int), int callme(int,int,intDBoth a and c
Which of the following is the best imbibant ?
View SolutionNegative feedback
View SolutionA block of ice, initially at −20∘C, is heated a steady rate until the temperature of the sample reaches 120∘C. Which of the following graphs best illustrates the temperature of the sample as a function of time?
View SolutionWhich of the following best describes the picture:

View SolutionWhich of the following best describes the picture:

View Solution

