The following graph illustrates
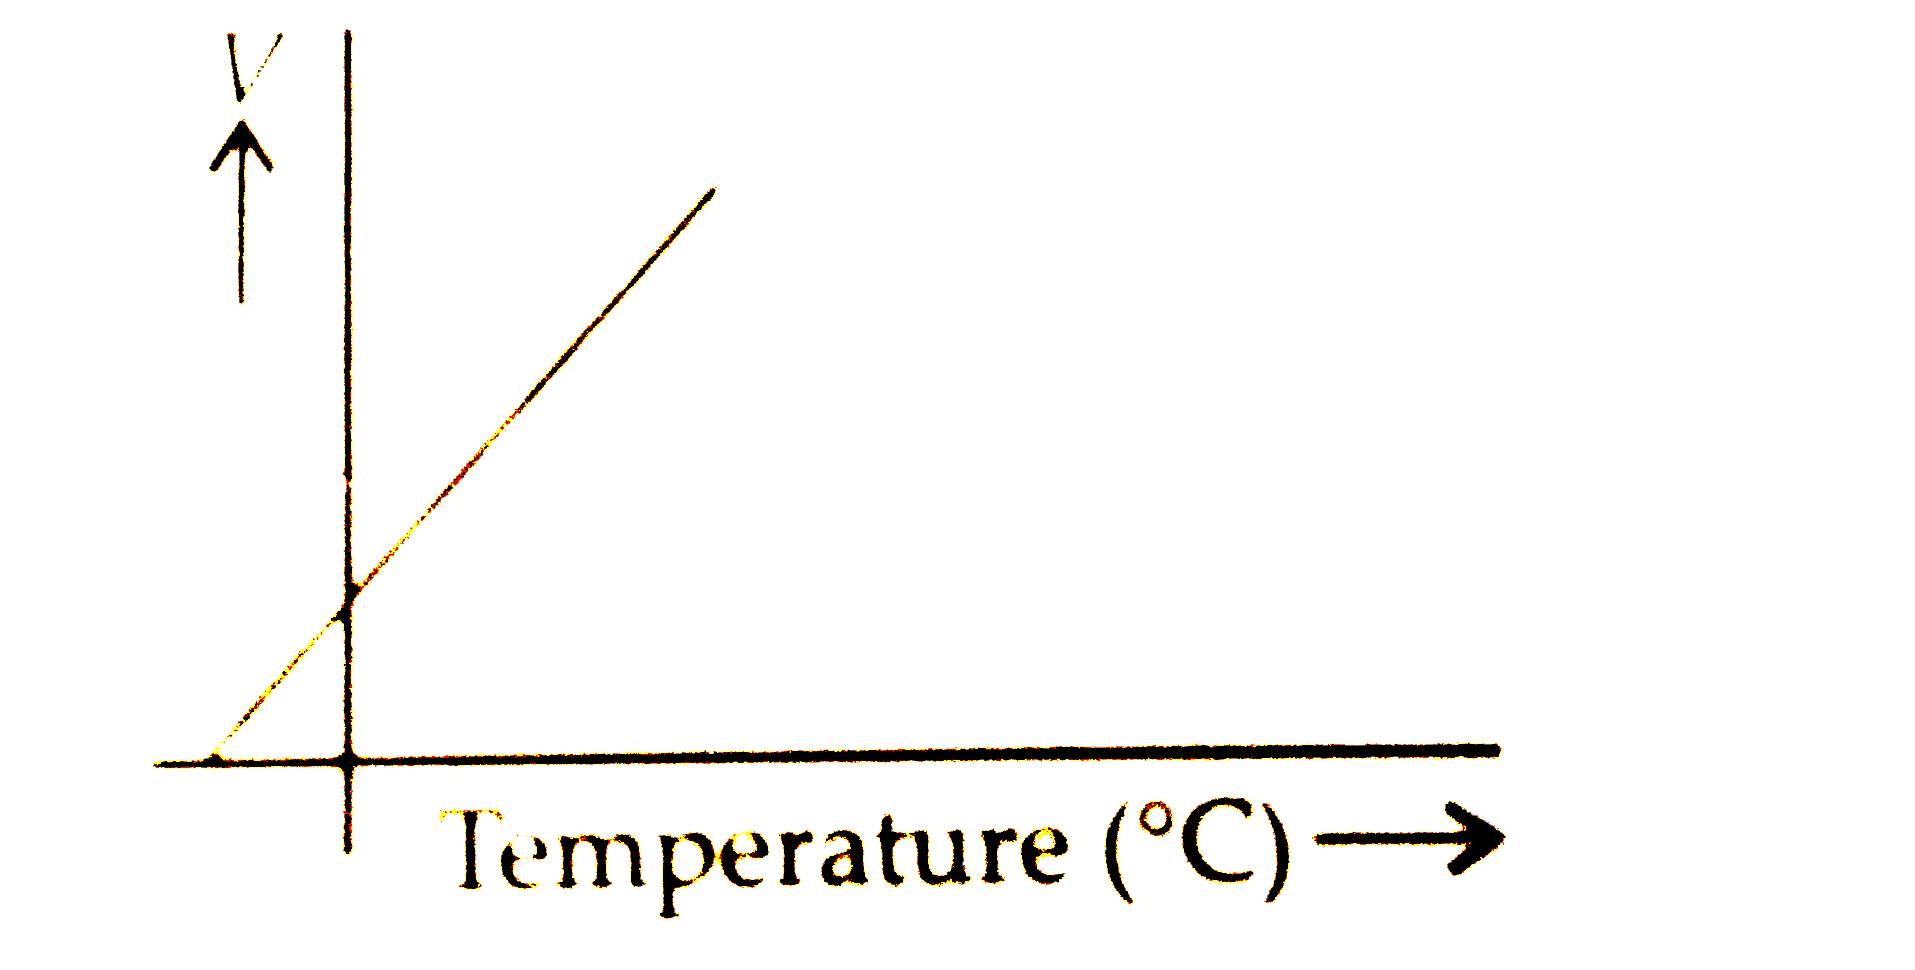
Dalton's law
Charles' law
Boyle's law
Gay-Lussac's law
The correct Answer is:B
Step by step video & image solution for The following graph illustrates by Chemistry experts to help you in doubts & scoring excellent marks in Class 11 exams.
Updated on:21/07/2023Topper's Solved these Questions
- PRACTICE PAPER 1BOOK - NCERT FINGERTPS ENGLISHCHAPTER - PRACTICE PAPER 1EXERCISE - Practice Paper 1
44 Videos
- ORGANIC CHEMISTRY-SOME BASIC PRINCIPLES AND TECHNIQUES BOOK - NCERT FINGERTPS ENGLISHCHAPTER - ORGANIC CHEMISTRY-SOME BASIC PRINCIPLES AND TECHNIQUES EXERCISE - Assertion And Reason
12 Videos
- PRACTICE PAPER 2BOOK - NCERT FINGERTPS ENGLISHCHAPTER - PRACTICE PAPER 2EXERCISE - Practice Paper 2
44 Videos
Similar Questions
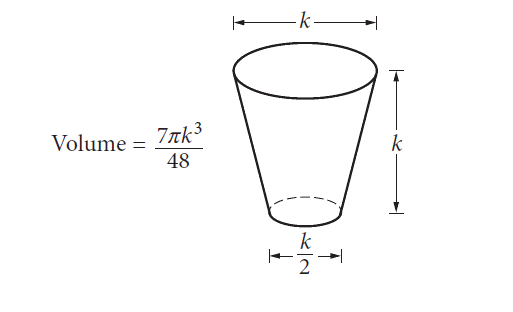
The glass pictured above can hold a maximum volume of 473 cubic centimeters, which is approximately 16 fluid ounces.
Water pours into the glass slowly and at a constant rate. Which of the following graphs best illustrates the height of the water level in the glass as it fills?
View SolutionWhich of the following best illustrates feedback in development ?
View Solution
Knowledge Check
A block of ice, initially at −20∘C, is heated a steady rate until the temperature of the sample reaches 120∘C. Which of the following graphs best illustrates the temperature of the sample as a function of time?
A B
B C
C D
D
Which of the following best illustrates the idea of increasing levels of organizational complexity ?
ATissue, chemical, cellular, organ, system, organismicBCellular, chemical, tissue, organismic, organ, systemCChemical, cellular, tissue, organ, system, organismicDChemical, tissue, cellular, organ, organismic, systemWhich of the following graphs is the graph of function g(x)|x−1|−1?
A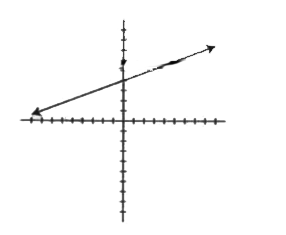 B
B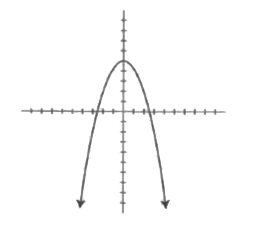 C
C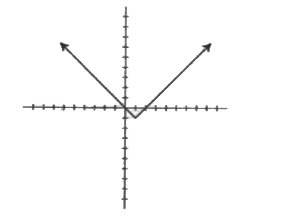 D
D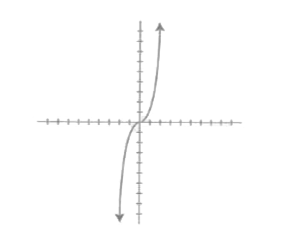
Which of the following does not illustrate the anomalous behaviour of lithium ?
View SolutionWhich of the following does not illustrate the phenomenon of natural selection?
View SolutionWhich of the following does not illustrate the phenomenon of natural selection?
View SolutionWhich of the following does not illustrate the anomalous properties of lithium?
View Solution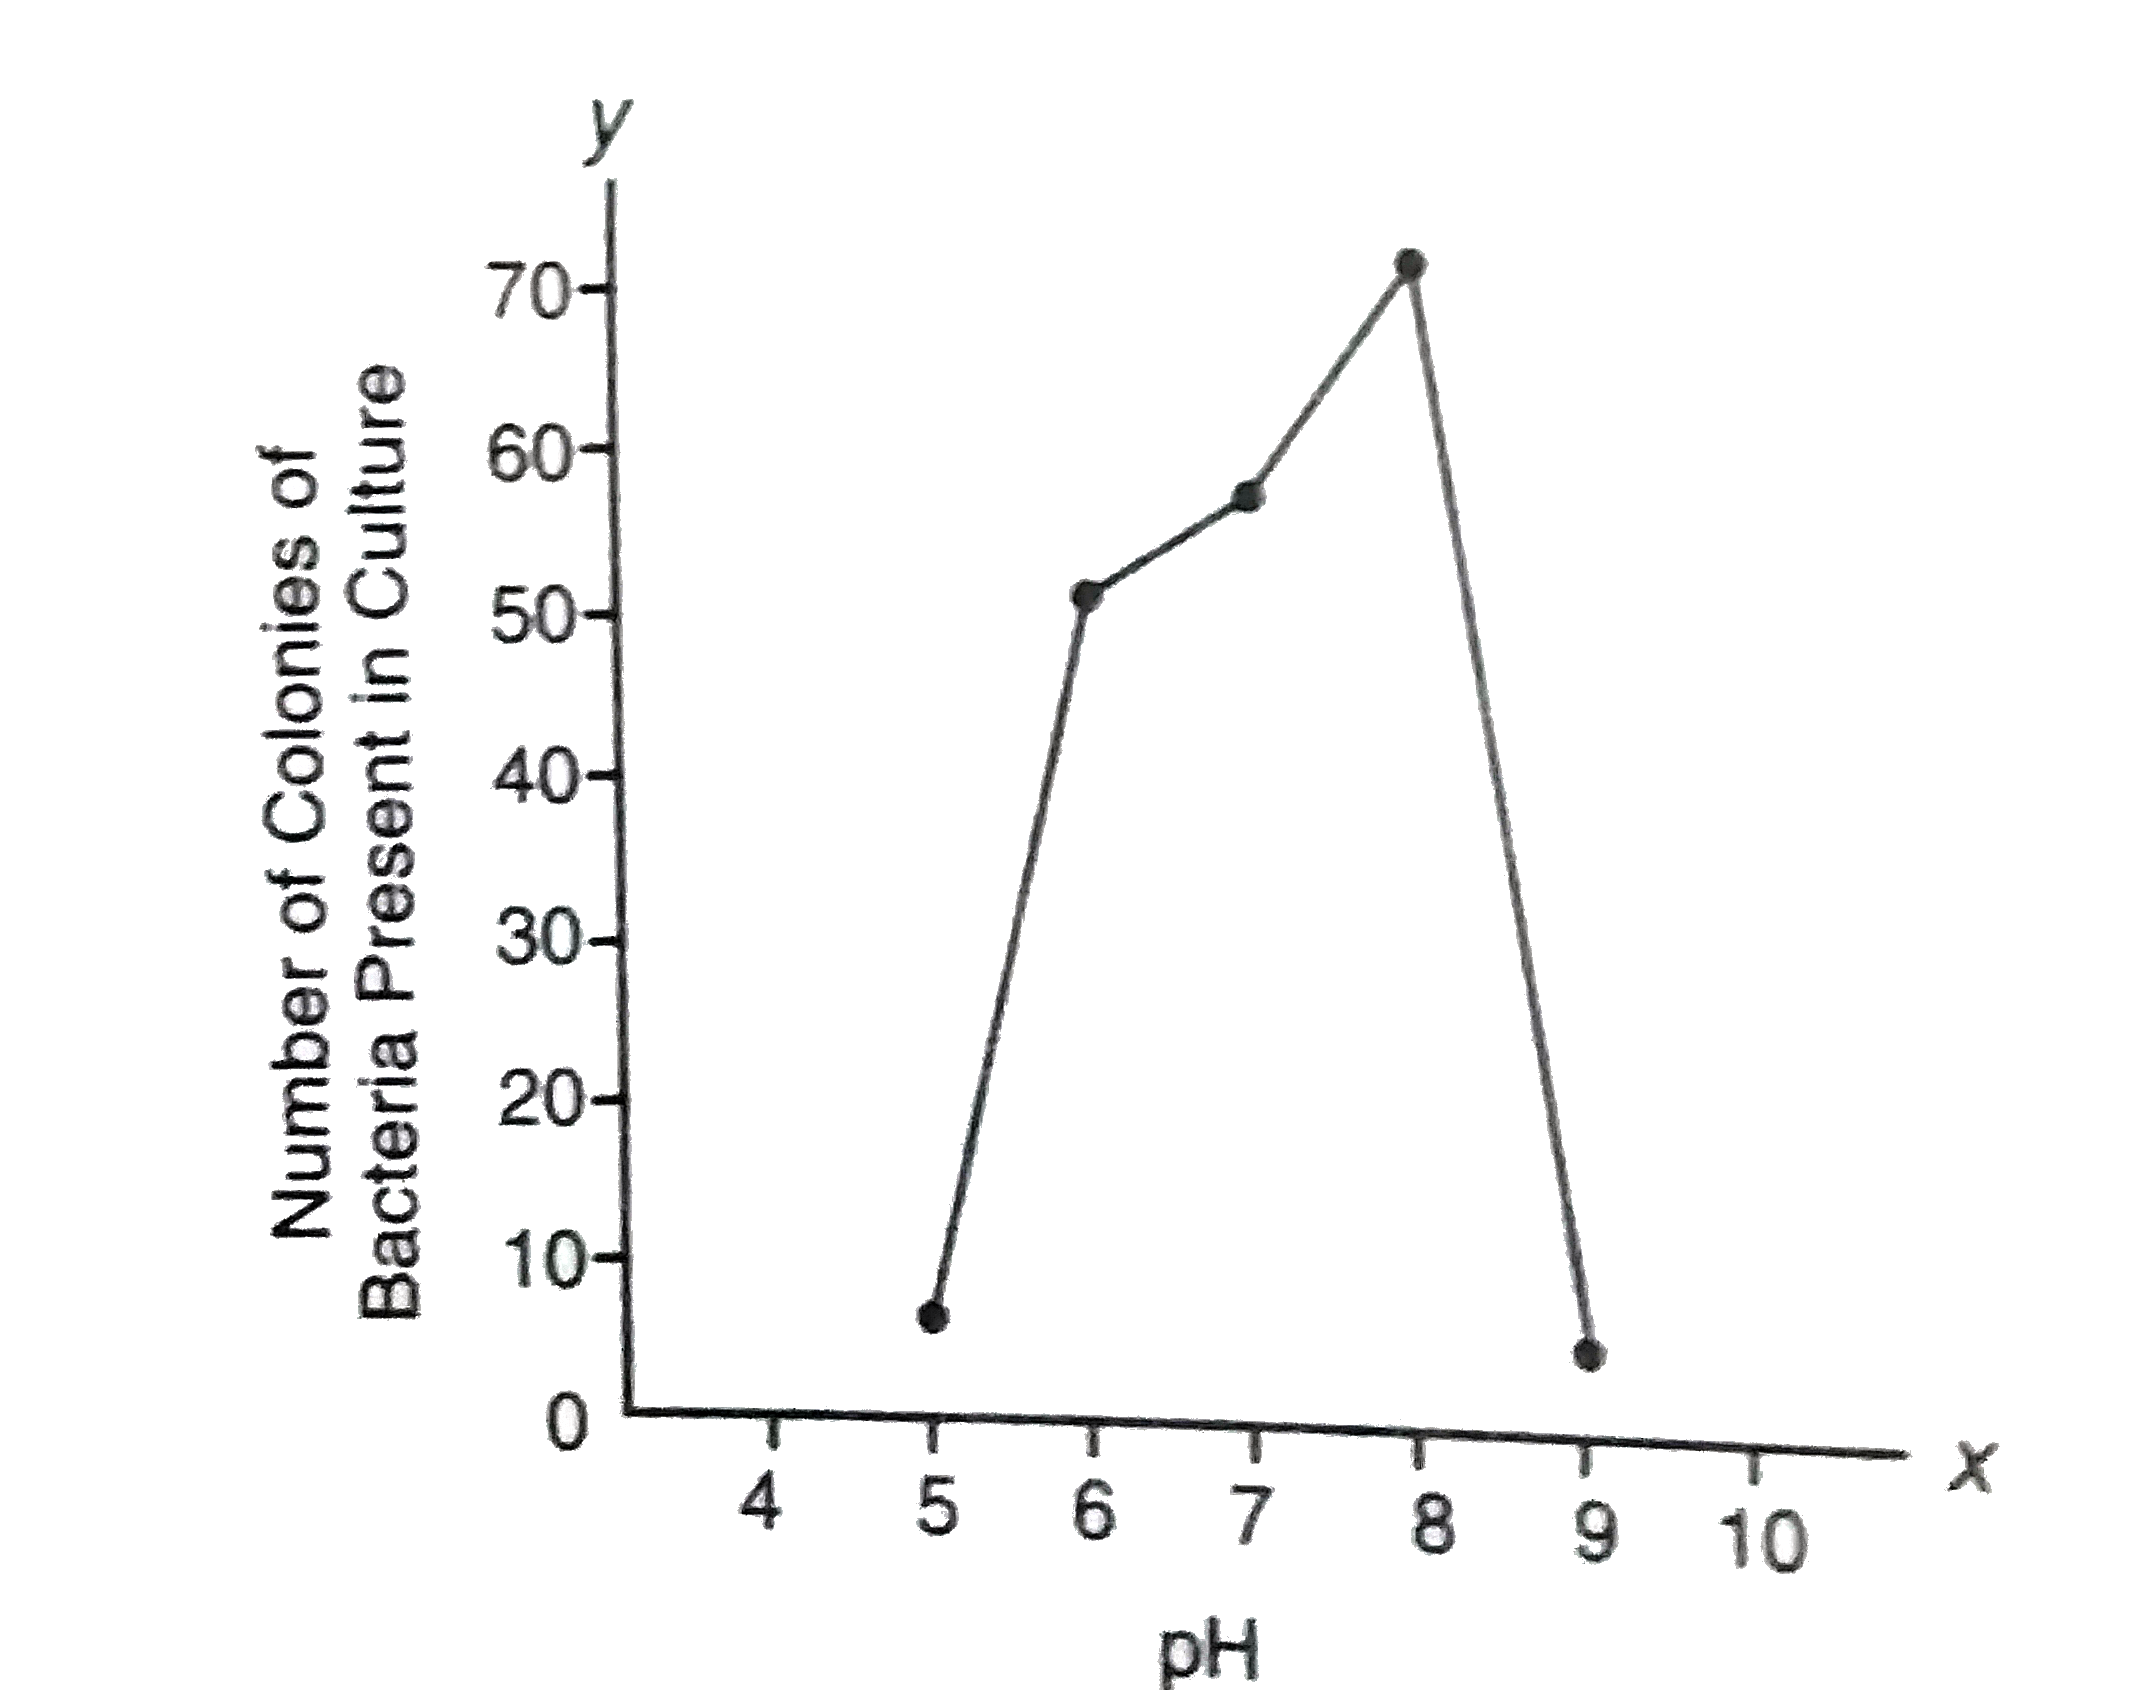
The accompanying graph illustrates the presence of a certain strain of bacteria at various pH levels. Between which two pH values is the rate at which the number of colonies of bacteria increasing at the lowest rate?
View Solution
