Which of the-given graphs correctly represents growth in living organisms?
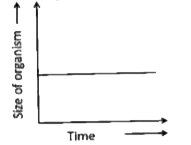
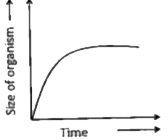
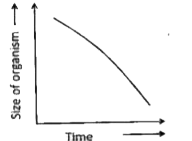
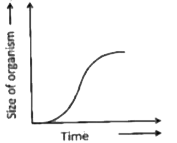
To determine which graph correctly represents growth in living organisms, follow these steps:
Step 1: Understand Growth Patterns
Living organisms exhibit specific growth patterns over time. Growth is not constant; it can vary based on age, environmental factors, and species.
Step 2: Identify Growth Phases
Typically, growth in living organisms can be divided into phases:
- Initial Growth Phase: Rapid growth occurs after birth.
- Mature Phase: Growth slows down as the organism reaches maturity.
- Stability Phase: Once maturity is reached, growth may plateau or stop.
Step 3: Analyze the Graphs
Look at the provided graphs and identify which one reflects the growth phases described:
- A graph that shows rapid growth initially, followed by a gradual slowdown, and eventually stabilizing would be the correct representation of growth in living organisms.
Step 4: Select the Correct Graph
Based on the analysis, select the graph that best illustrates the growth pattern:
- The correct graph is likely to show an initial steep incline (indicating rapid growth), followed by a tapering off as the organism reaches maturity.
Final Step: Confirm Your Choice
Ensure that the selected graph aligns with the understanding of growth in living organisms, which includes initial rapid growth, followed by a slowdown and stabilization.
Conclusion
The correct option is the one that shows growth starting rapidly, then slowing down, and finally stabilizing, which corresponds to the typical growth pattern of living organisms.
---
Living organisms exhibit specific growth patterns over time. Growth is not constant; it can vary based on age, environmental factors, and species.
Typically, growth in living organisms can be divided into phases:
- Initial Growth Phase: Rapid growth occurs after birth.
- Mature Phase: Growth slows down as the organism reaches maturity.
- Stability Phase: Once maturity is reached, growth may plateau or stop.
Look at the provided graphs and identify which one reflects the growth phases described:
- A graph that shows rapid growth initially, followed by a gradual slowdown, and eventually stabilizing would be the correct representation of growth in living organisms.
Based on the analysis, select the graph that best illustrates the growth pattern:
- The correct graph is likely to show an initial steep incline (indicating rapid growth), followed by a tapering off as the organism reaches maturity.
Ensure that the selected graph aligns with the understanding of growth in living organisms, which includes initial rapid growth, followed by a slowdown and stabilization.
The correct option is the one that shows growth starting rapidly, then slowing down, and finally stabilizing, which corresponds to the typical growth pattern of living organisms.
Topper's Solved these Questions
- BOOK - BETOPPERSCHAPTER - LIFE ON EARTHEXERCISE - CONCEPTIVE WORKSHEET14videos
LIFE ON EARTH
- BOOK - BETOPPERSCHAPTER - LIFE ON EARTHEXERCISE - SUMMATIVE WORKSHEET (MULTIPLE CHOICE QUESTIONS)5videos
LIFE ON EARTH
- BOOK - BETOPPERSCHAPTER - HEALTH AND HYGIENEEXERCISE - SUMMATIVE WORKSHEET34videos
HEALTH AND HYGIENE
- BOOK - BETOPPERSCHAPTER - OUR ENVIRONMENTEXERCISE - SUMMATIVE WORKSHEET (ANSWER THE FOLLOWING QUESTIONS:)24videos
OUR ENVIRONMENT
Similar Questions
Knowledge Check
- Question 1 - Select One
Growth in living organisms occurs by
ADivision of cellsBIncrease in mass of the living structureCAccumulation of material by external agencyDBoth (1) & (2) - Question 2 - Select One
Which of the following graph is correctly represented?
A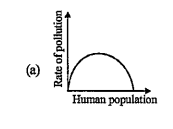 B
B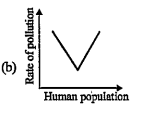 C
C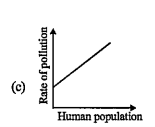 D
D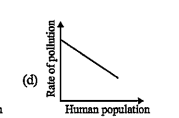
- Question 3 - Select One
Which one decribes the given graph correctly
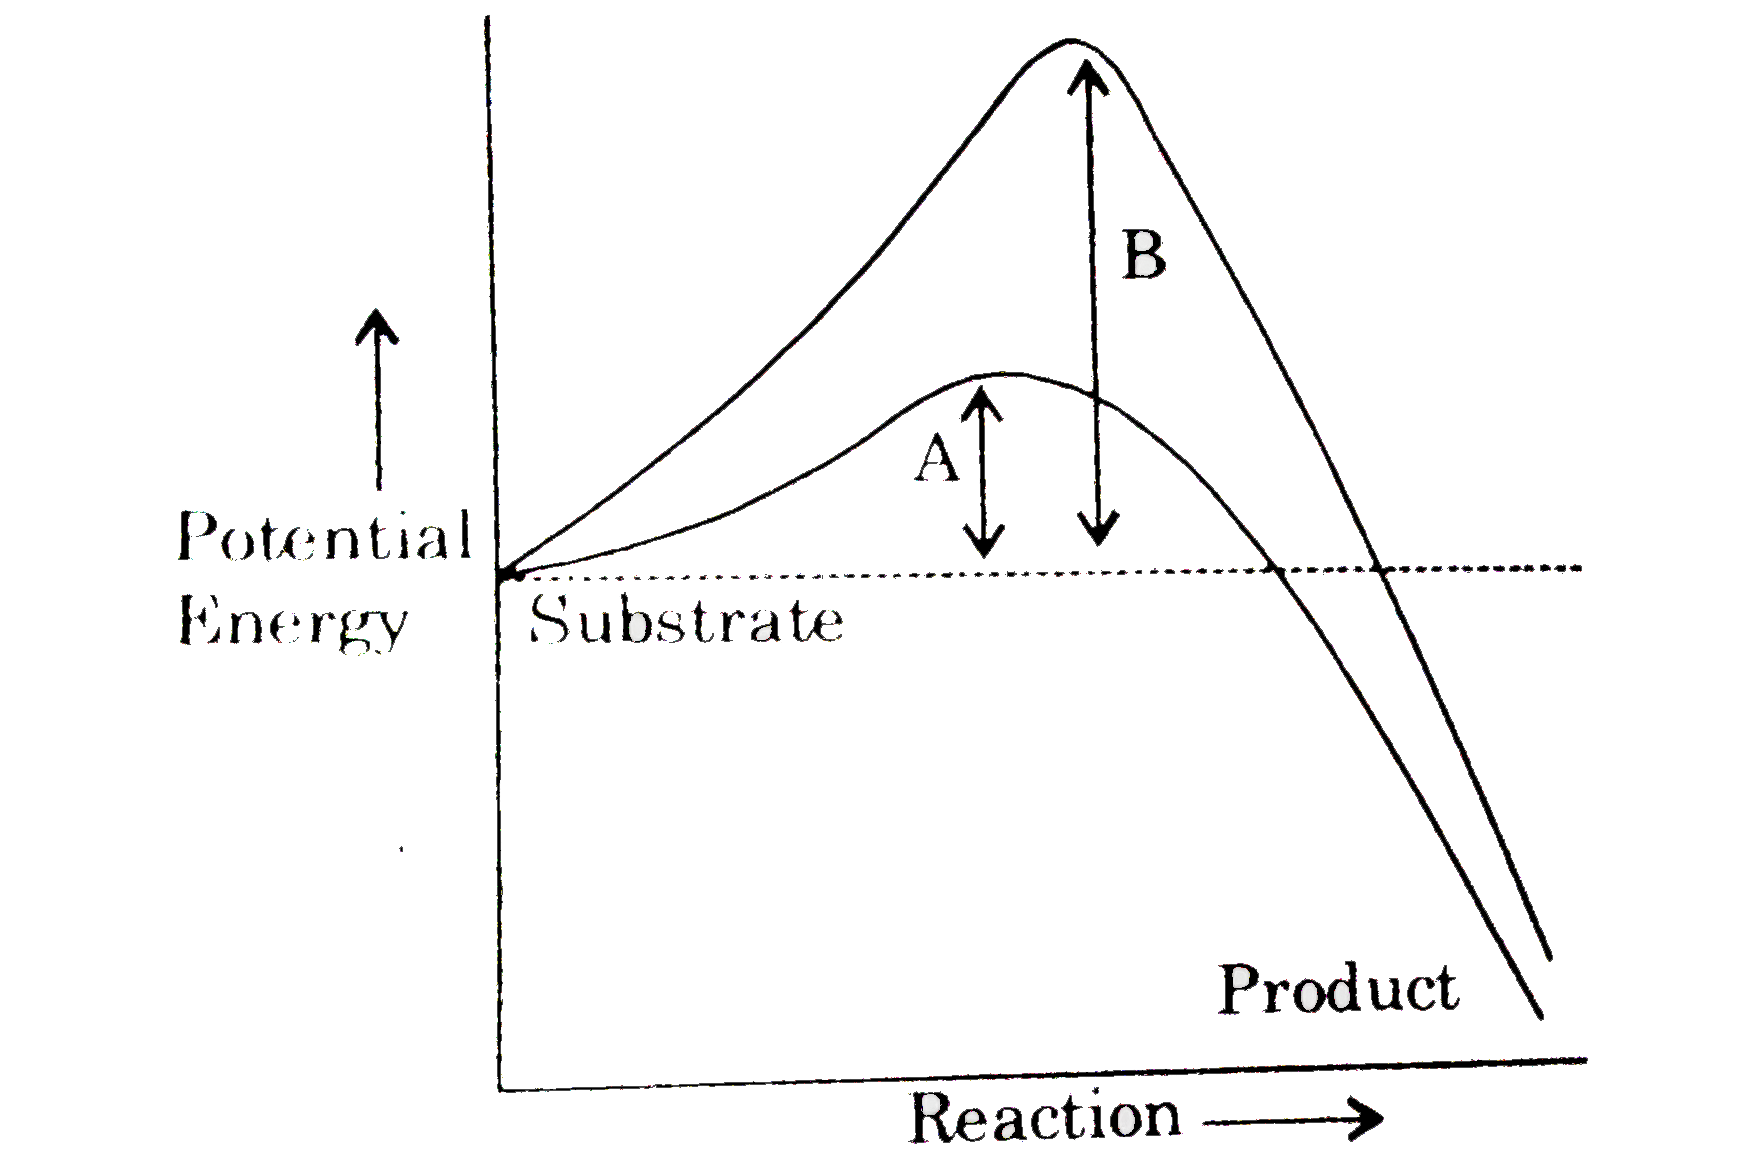 AExothermic reaction with energy A in the absence of enzyme and B in the presence of enzymeBEndothermic reaction with energy A in the presence of enzyme and B in the absence of enzymeCExothermic reaction with energy A in the presence of enzyme and B in the absence of enzyme.DEndothermic reaction with energy A in the absence of enzyme and B in the presence of enzyme.
Which of the given options correctly represents the Parent acid and base of Calcium Carbonate?
 View Solution
Which of the following graphs correctly represents the variation of particle momentum with associated de Broglie wavelength?
View SolutionA simple pendulum of length φ oscillates with the time period T . Then which of the following graph correctly represents the relation ?
View SolutionThe velocity -displacement graph of a particle is as shown in the figure. Which of the following graphs correctly represents the variation of acceleration with displacement?
 View Solution
Which of the following graphs correctly represents the variation of β=−(dV/dP)/V with P for an ideal gas at constant temperature?
View Solution

