A simple pendulum of length φ oscillates with the time period T . Then which of the following graph correctly represents the relation ?


The correct Answer is:B
Topper's Solved these Questions
- PHYSICS PART-IIIBOOK - FIITJEECHAPTER - PHYSICS PART-IIIEXERCISE - MCQ (MULTIPLE CORRECT)
18 Videos
- PHYSICS PART-IIIBOOK - FIITJEECHAPTER - PHYSICS PART-IIIEXERCISE - ASSERTION -REASONING MCQ (SINGLE CORRECT)
12 Videos
- PHYSICS PART-IIIBOOK - FIITJEECHAPTER - PHYSICS PART-IIIEXERCISE - ASSIGNMENT SECTION-II SUBJECTIVE
27 Videos
- OPTICSBOOK - FIITJEECHAPTER - OPTICSEXERCISE - NUMERICAL BASED QUESTIONS
2 Videos
- PHYSICS PART2BOOK - FIITJEECHAPTER - PHYSICS PART2EXERCISE - Numerical Based Question Decimal Type
6 Videos
Similar Questions
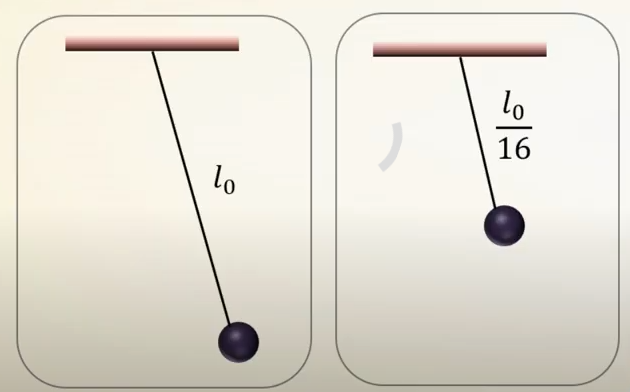
A simple pendulum of length l0 can perform simple harmonic oscillations with a time period T0. If the length of the pendulum is decreased to l016 then the time time period of oscillation will become.

View SolutionA simple pendulum is executing simple harmonic motion with a time period T. If the length of the pendulum is increased by 21%, the percentage increase in the time period of the pendulum of is
View Solution
Knowledge Check
A simple pendulum oscillates in air with time period T and amplitude A . As the time passes
AT and A both decreaseBT increases and A is constantCT increases and A decreasesDT decrases and A is constantFor a simple pendulum the graph between length and time period will be
AhyperbolaBparabolaCstraight lineDnone of theseIf a simple pendulum oscillates in water instead of air then the time period will -
Adecrease slightlyBincrease slightlyCremain the sameDdecrease considerably
A simple pendulum oscillating with a small amplitude has a time period of T=1.0s . A horizontal thin rod is now placed beneath the point of suspension at a distance equal to half the length of the pendulum. The string collides with the rod once in each oscillation and there is no loss of energy in such collisions. Find the new time period T of the pendulum
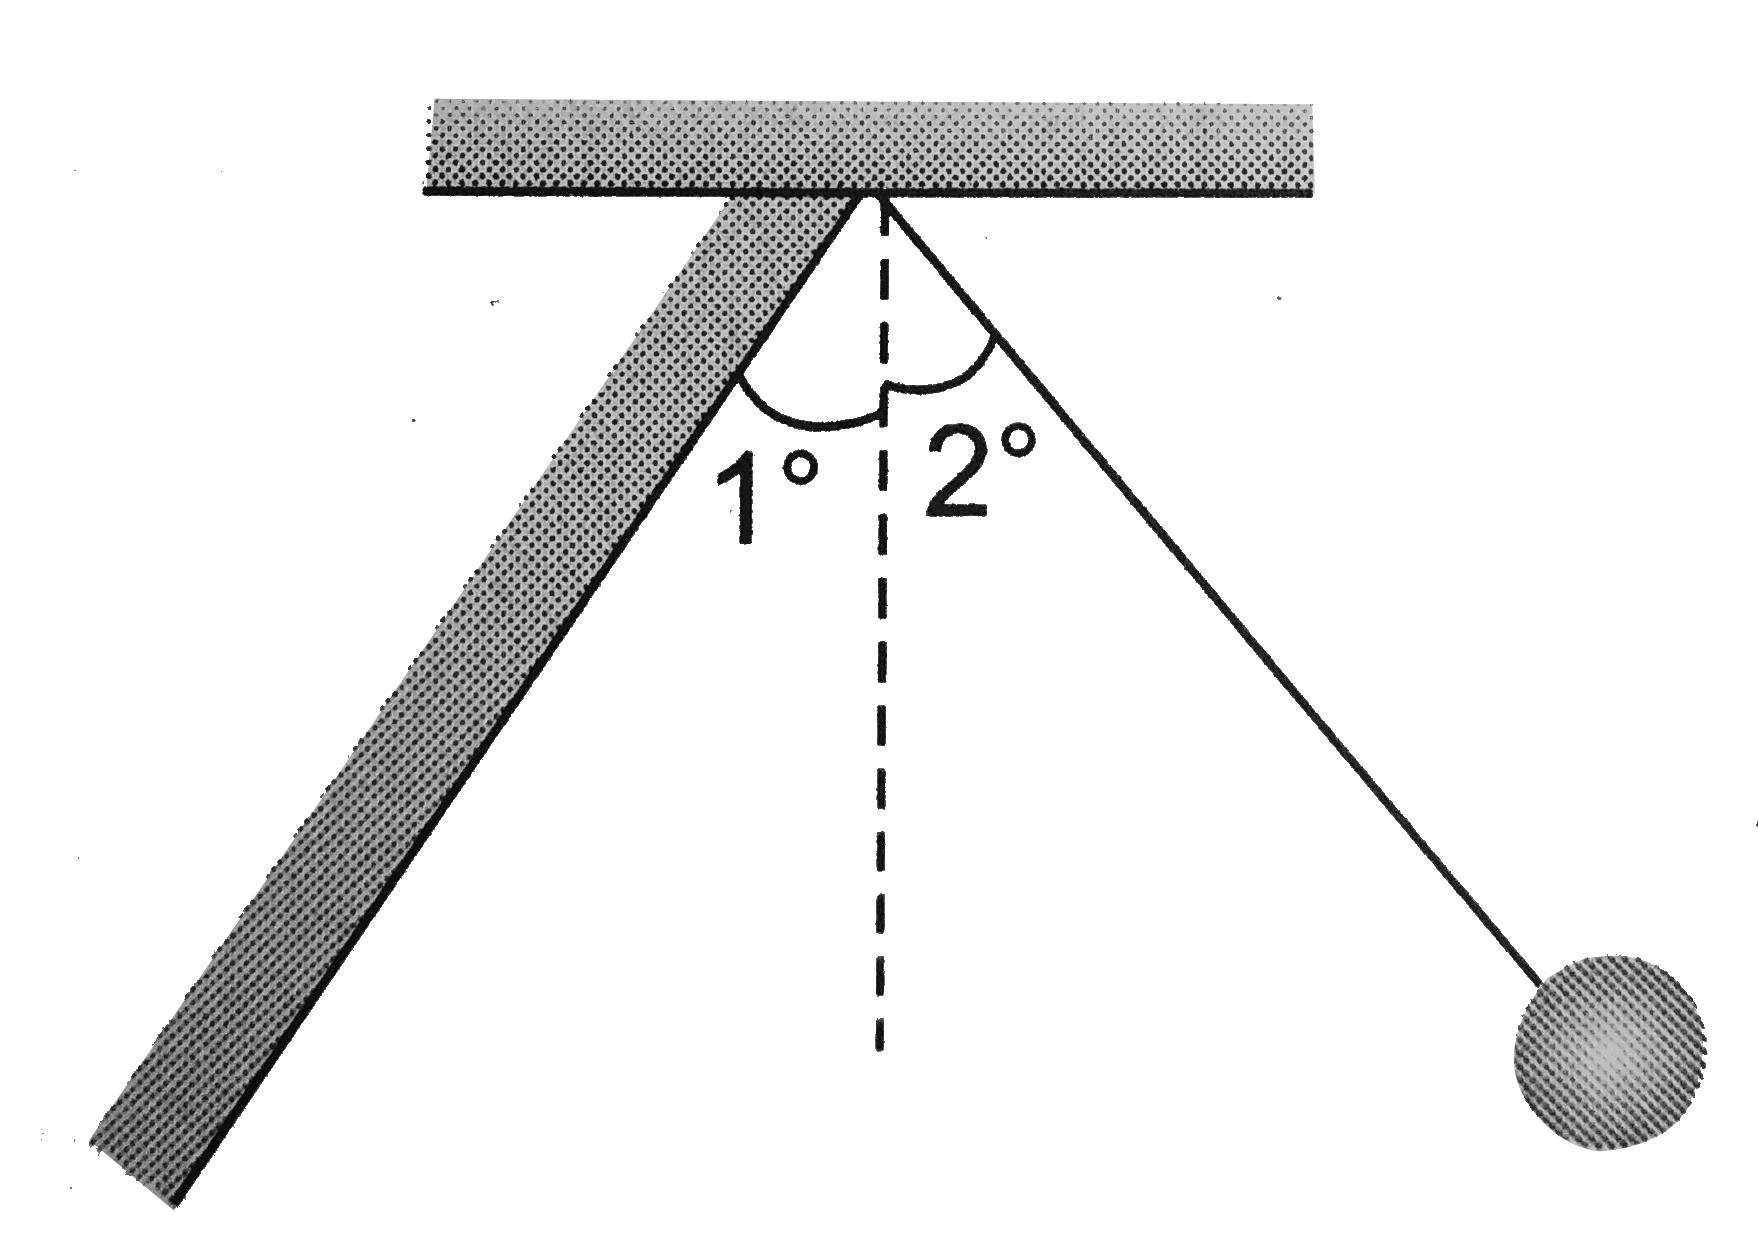
View SolutionA simple pendulum of length 1m is allowed to oscillate with amplitude 2∘. it collides at T to the vertical its time period will be (use g=π2)

View SolutionFor a simple pendulum, the graph between T2andL (where T is the time period & Lis the length) is
View SolutionA simple pendulum of length 1m is allowed to oscillate with amplitude 2∘. it collides at T to the vertical its time period will be (use g=π2)

View SolutionSimple pendulum is executing simple harmonic motion with time period T. If the length of the pendulum is increased by 21%, then the increase in the time period of the pendulum of the increased length is:
View Solution
