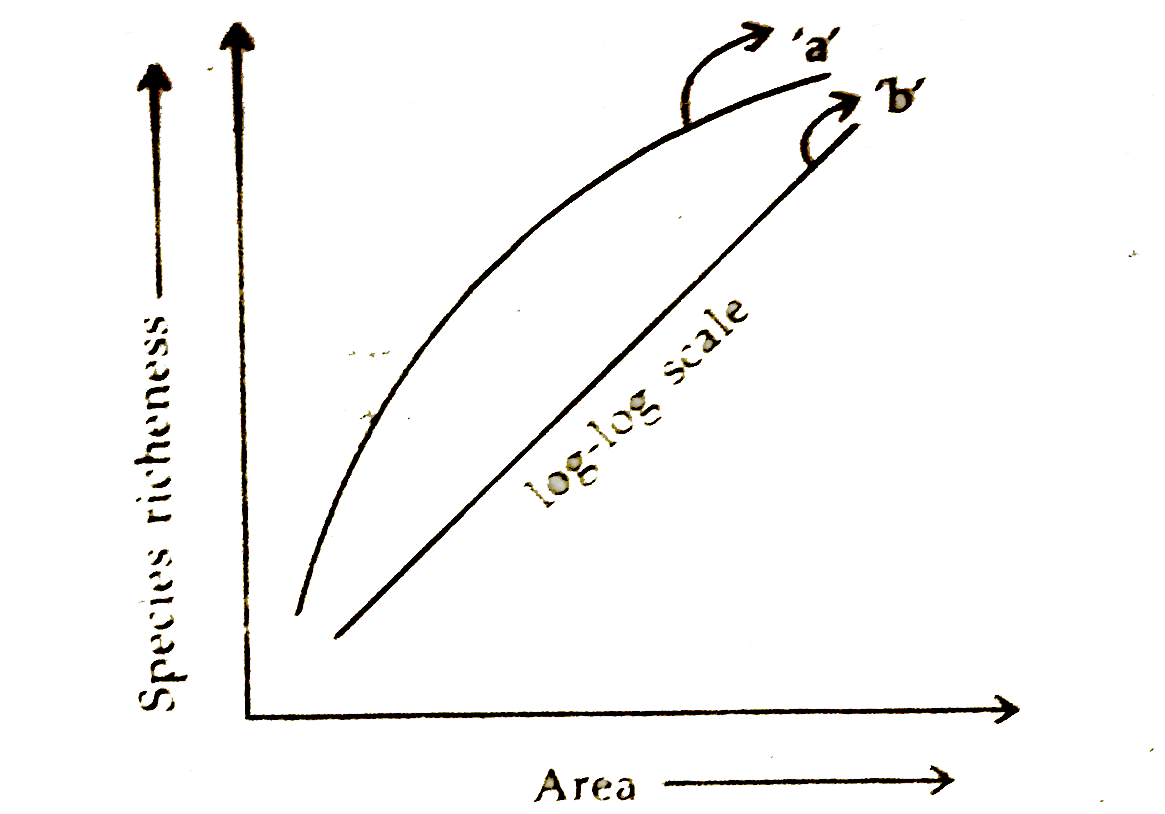
Z value in a much steeper slope ranges between :
The correct Answer is:A
Topper's Solved these Questions
- BIODIVERSITY AND CONSERVATIONBOOK - KUMAR PRAKASHANCHAPTER - BIODIVERSITY AND CONSERVATIONEXERCISE - SECTION - F (MCQs A SKED IN COMPETITIVE EXAM)
70 Videos
- BIODIVERSITY AND CONSERVATIONBOOK - KUMAR PRAKASHANCHAPTER - BIODIVERSITY AND CONSERVATIONEXERCISE - SECTION - E (SOLUTION OF NCERT EXEMPLAR)(LONG ANSWER TYPE QUESTIONS)
8 Videos
- BIOTECHNOLOGY : PRINCIPLES AND PROCESSESBOOK - KUMAR PRAKASHANCHAPTER - BIOTECHNOLOGY : PRINCIPLES AND PROCESSESEXERCISE - SECTION - F (MCQs ASKED IN COMPETITIVE EXAM)
78 Videos
Similar Questions
The following graph shows the species area relationship. Answers the Questions as directed.
(a) Name the naturalist who studied the kind of relationship shown in the graph.
Write the observations made by him.
(b) Write the situations as discovered by the ecologists when the value of 'Z' (slope of the line) lies between
(i) 0.1 and 0.2, (ii) 0.6 and 1.2
What does 'Z' stand for ?
(c ) When would the slope of the line 'b' become steeper ?

View SolutionThe following graph shows the species area relationship. Answers the Questions as directed.
(a) Name the naturalist who studied the kind of relationship shown in the graph.
Write the observations made by him.
(b) Write the situations as discovered by the ecologists when the value of 'Z' (slope of the line) lies between
(i) 0.1 and 0.2, (ii) 0.6 and 1.2
What does 'Z' stand for ?
(c ) When would the slope of the line 'b' become steeper ?

View Solution
Knowledge Check
The slope of a line is 3 times the slope of the other line and the tangent of the angle between them is 4/13, sum of their slopes is equal to
A2B4C6D8If we analyse the species-area relationships among very large areas like the entire continents, then slope of line becomes much steeper in the range of
A0.1 to 0.6B0.1 to 0.2C0.6 to 1.2D0.2 to 0.6During the analysing the surface area relationship among very large area like entire continents, the slope of the line is found much steeper and the Z values ranges
A0.1to0.2B1.15to3C0D0.6to1.2
The following graph shows the species area relationship. Answers the Questions as directed.
(a) Name the naturalist who studied the kind of relationship shown in the graph.
Write the observations made by him.
(b) Write the situations as discovered by the ecologists when the value of 'Z' (slope of the line) lies between
(i) 0.1 and 0.2, (ii) 0.6 and 1.2
What does 'Z' stand for ?
(c ) When would the slope of the line 'b' become steeper ?

View SolutionAccording to Moseley's law, the ratio of the slope of graph between √f and Z for Kβ and Kα is
View SolutionAccording to Moseley's law, the ratio of the slope of graph between √f and Z for Kβ and Kα is
View SolutionA widely stretched flat-topped high land, with relatively steeper slopes, rising above the adjoining plain or sea is called a:
View SolutionAccording to Mseley's law, the ratio of the slope of graph between √f and Z for Kβ and Kα is
View Solution
