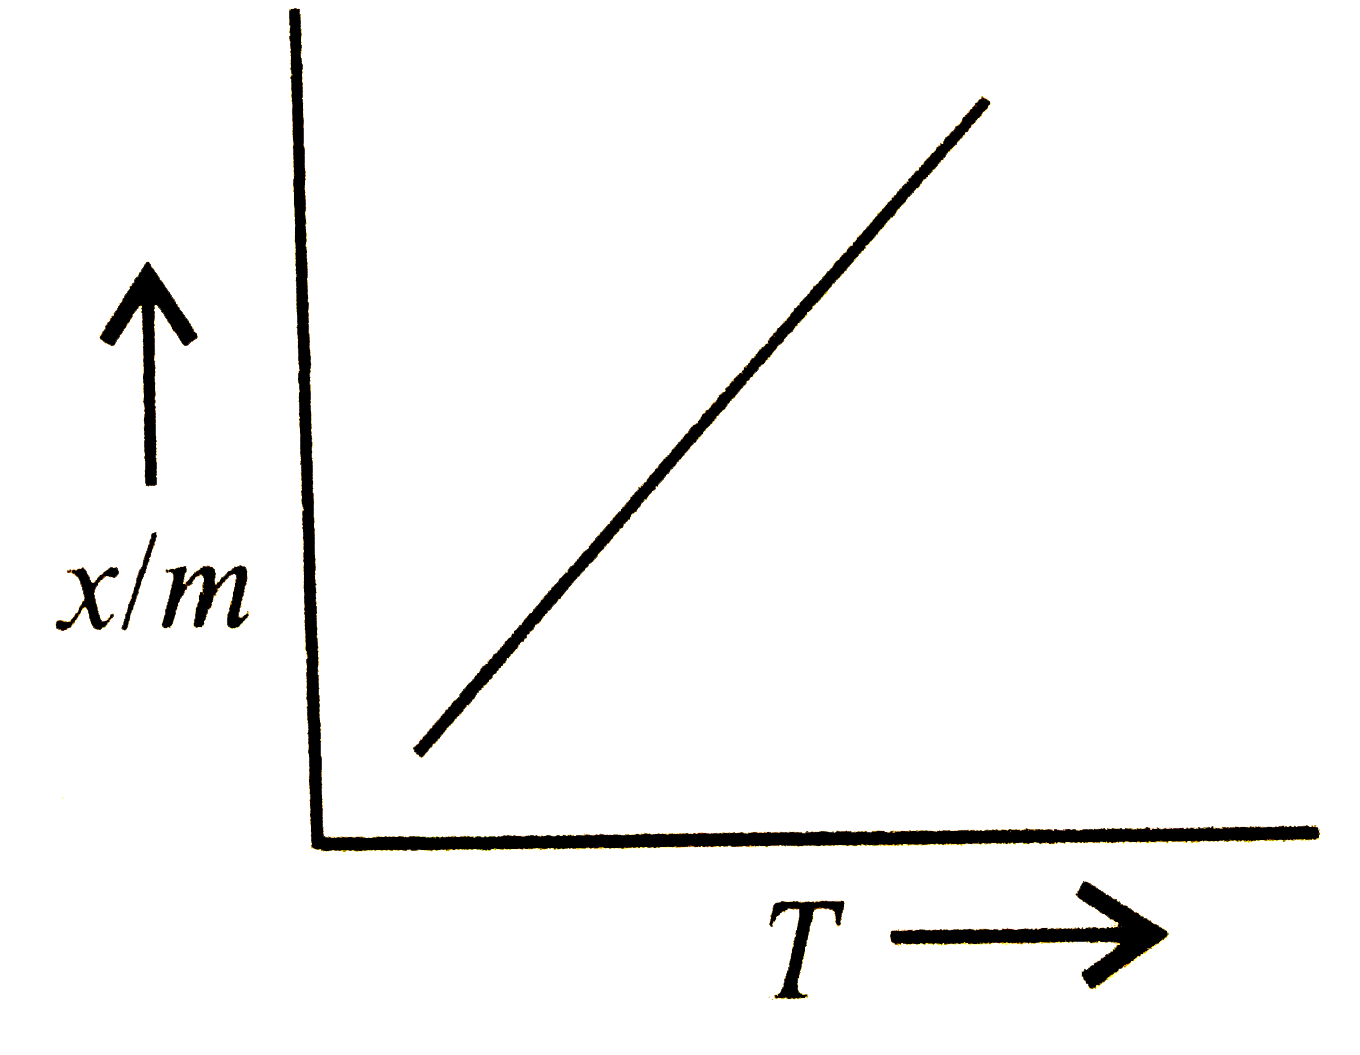
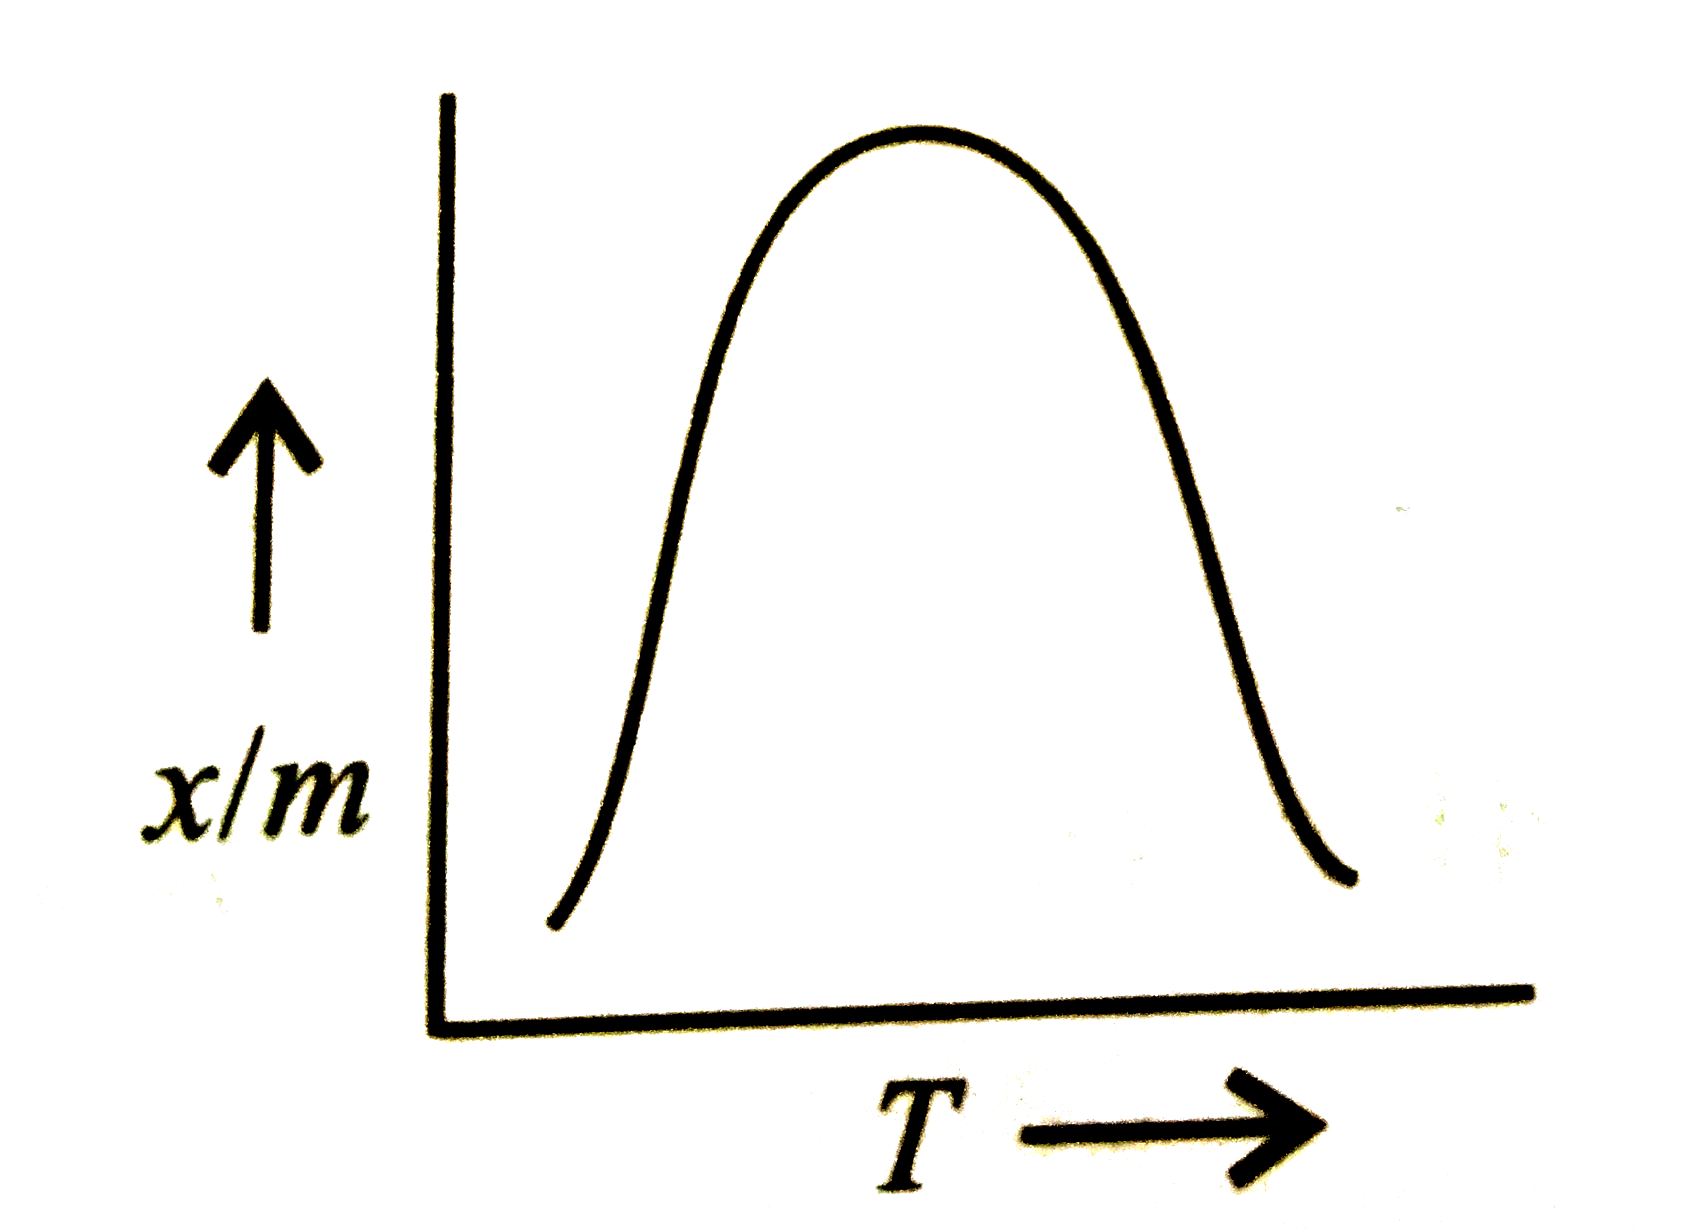
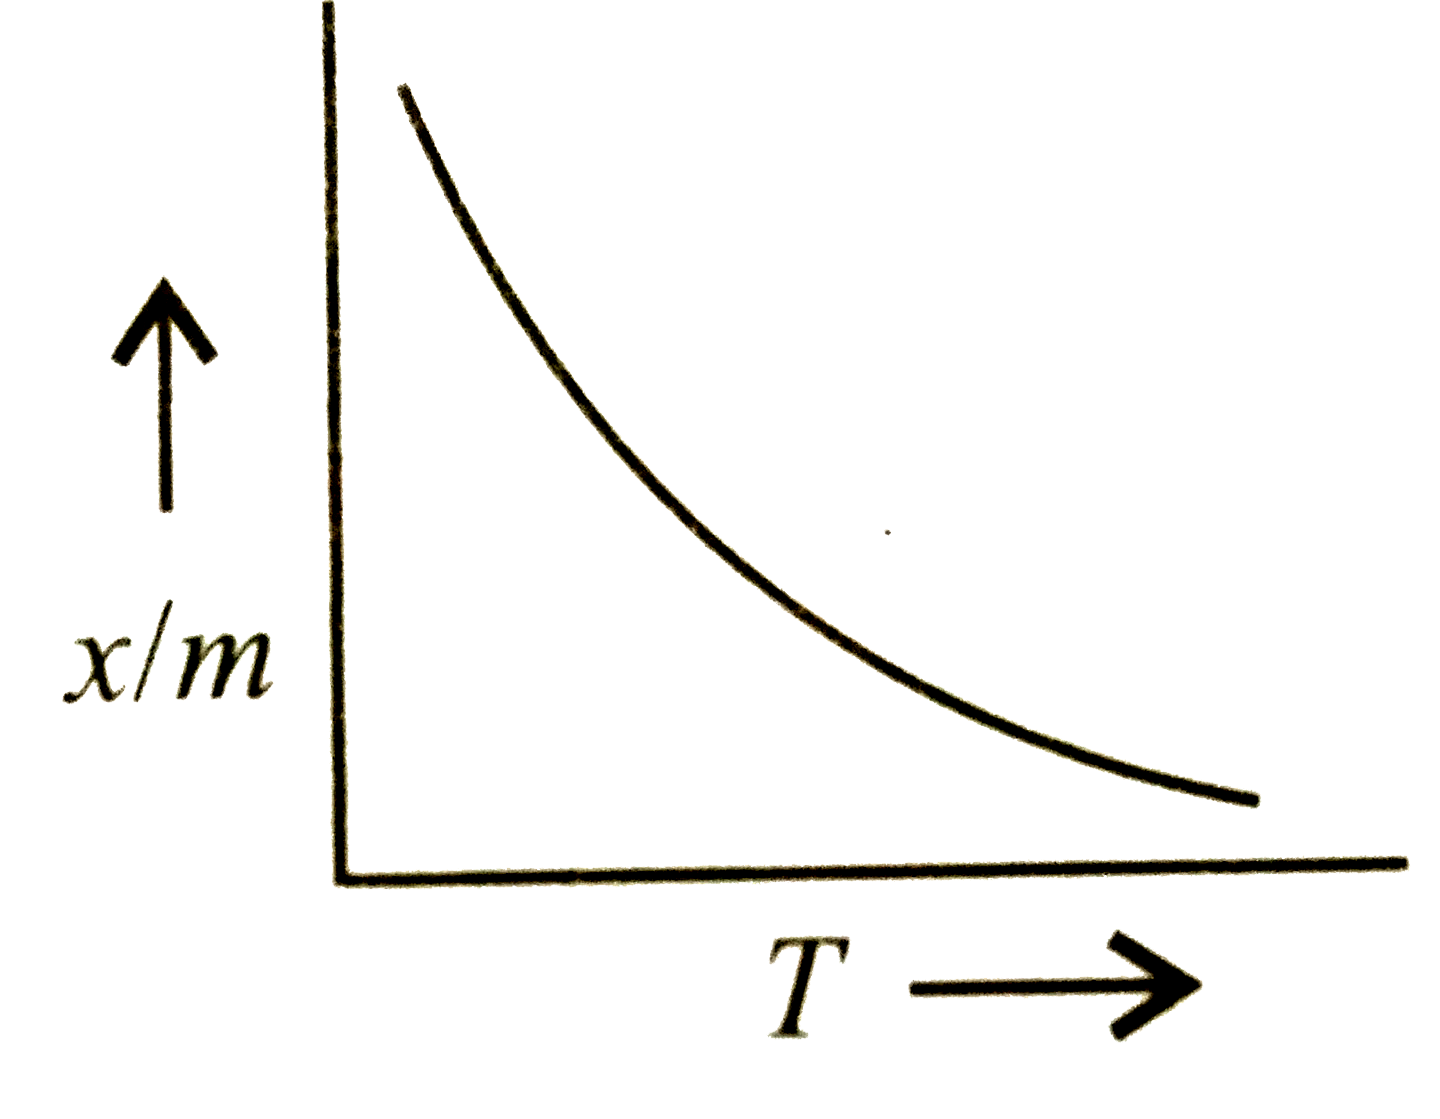
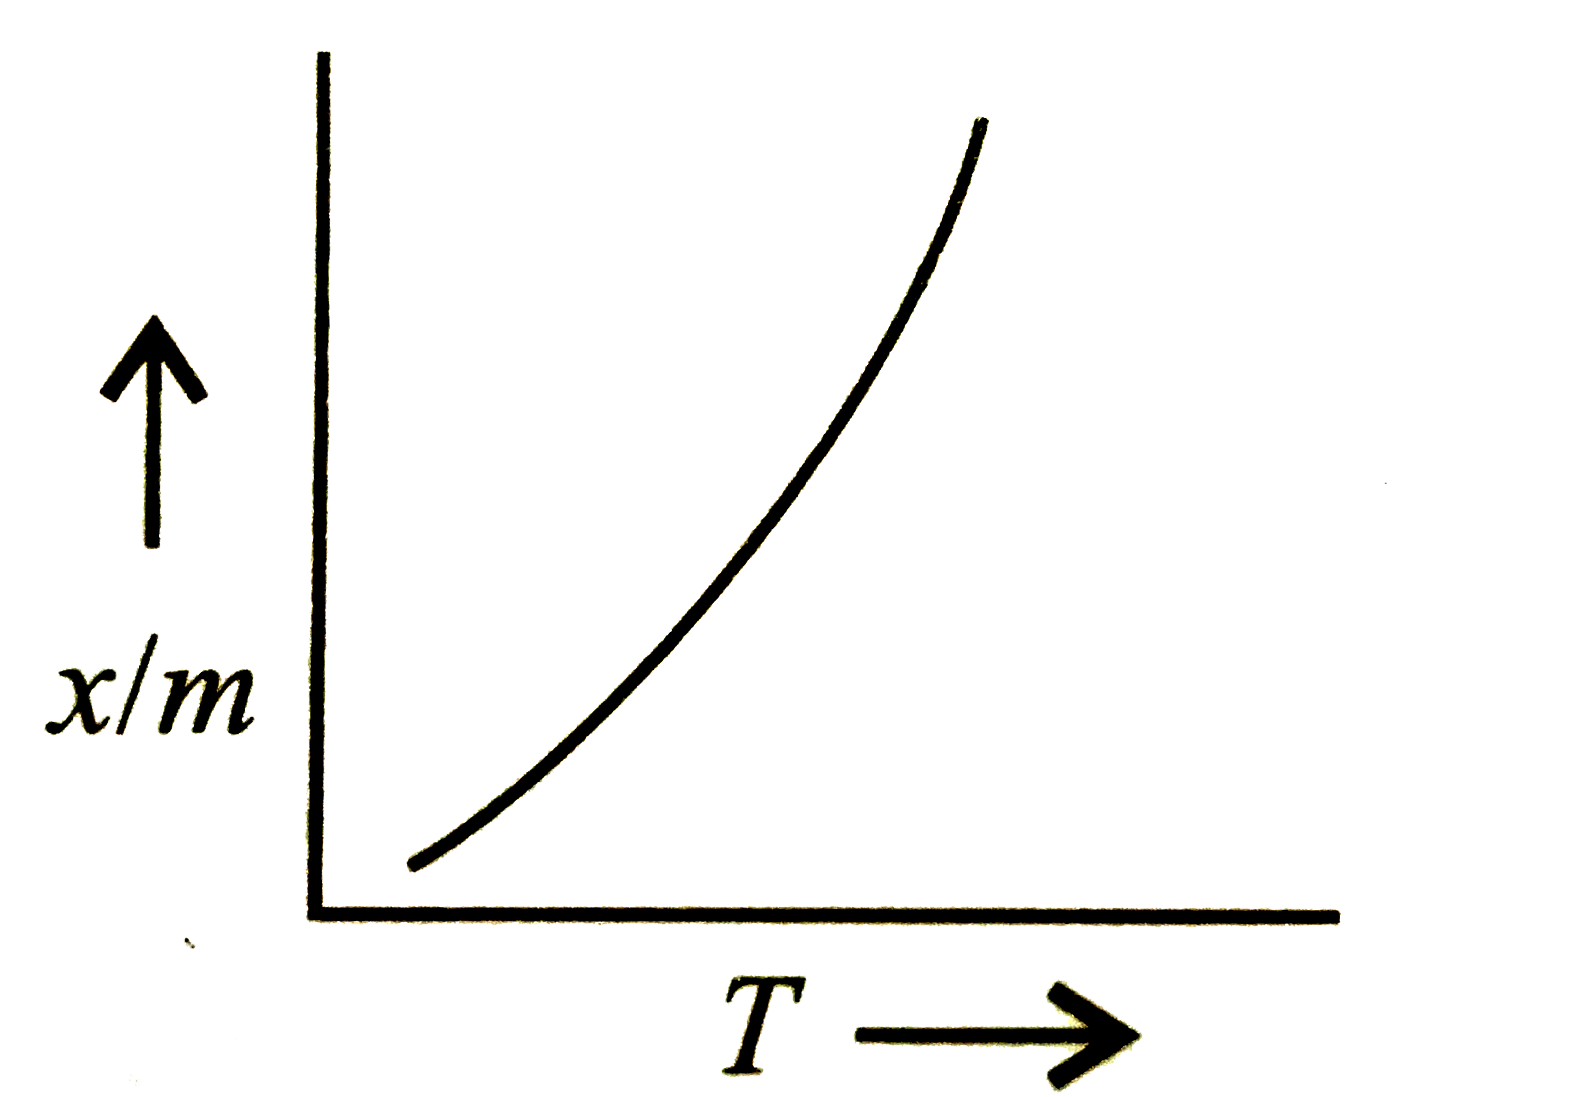
A chemist studied the phenomenon of adsorption by putting blood charcoal in KCL solution. He observed difference in the behaviour with dilute KCL solution and with concentrated KCL solution. He also studied the adsorption of different gases on solid adsorbent and the effect of temperature on adsorption. He put forward a mathematical relationship relating x/m with equilibrium pressure.
Which of the following plot will be liner? (More than one correct)
Plot of log x/m versus P
Plot of m/x versus 1/P
Plot of log Pm/m versus P
Plot of log m/x versus log P
The correct Answer is:A, B, C
To determine which plots will be linear based on the adsorption isotherm, we can follow these steps:
1. Understanding the Adsorption Isotherm:
The Freundlich adsorption isotherm is given by the equation:
xm=kP1n
where x is the mass of adsorbate, m is the mass of adsorbent, P is the equilibrium pressure, k is a constant, and n is a constant related to the adsorption intensity.
2. Rearranging the Equation:
To analyze the relationship, we can take logarithms of both sides:
log(xm)=log(k)+1nlog(P)
This can be compared to the linear equation y=mx+c, where:
- y=log(xm)
- x=log(P)
- Slope m=1n
- Intercept c=log(k)
Conclusion: The plot of log(xm) versus log(P) will be linear.
3. Analyzing Other Plots:
- Plot of mx versus 1P:
From the original equation, we can express mx as:
mx=1kP−1n
This indicates that mx is proportional to P−1n, which can be rearranged to show a linear relationship when plotted against 1P.
- Plot of log(P) versus mm:
Since m cancels out, we are left with log(P) versus P, which is not linear.
- Plot of log(mx) versus log(P):
This can be derived from the previous equations and will not be linear due to the negative sign introduced when taking logarithms.
4. Final Conclusion:
The plots that will be linear based on the analysis are:
- Plot of log(xm) versus log(P) (Option A)
- Plot of mx versus 1P (Option B)
- Plot of log(P) versus mm (Option C)
Thus, the correct options that yield linear plots are A, B, and C.
The Freundlich adsorption isotherm is given by the equation:
xm=kP1n
where x is the mass of adsorbate, m is the mass of adsorbent, P is the equilibrium pressure, k is a constant, and n is a constant related to the adsorption intensity.
To analyze the relationship, we can take logarithms of both sides:
log(xm)=log(k)+1nlog(P)
This can be compared to the linear equation y=mx+c, where:
- y=log(xm)
- x=log(P)
- Slope m=1n
- Intercept c=log(k)
- Plot of mx versus 1P:
From the original equation, we can express mx as:
mx=1kP−1n
This indicates that mx is proportional to P−1n, which can be rearranged to show a linear relationship when plotted against 1P.
Since m cancels out, we are left with log(P) versus P, which is not linear.
This can be derived from the previous equations and will not be linear due to the negative sign introduced when taking logarithms.
The plots that will be linear based on the analysis are:
- Plot of log(xm) versus log(P) (Option A)
- Plot of mx versus 1P (Option B)
- Plot of log(P) versus mm (Option C)
Topper's Solved these Questions
- SURFACE CHEMISTRYBOOK - CENGAGE CHEMISTRY ENGLISHCHAPTER - SURFACE CHEMISTRYEXERCISE - Exercises Multiple Correct
25 Videos
- SURFACE CHEMISTRYBOOK - CENGAGE CHEMISTRY ENGLISHCHAPTER - SURFACE CHEMISTRYEXERCISE - Exercises Single Correct
52 Videos
- SURFACE CHEMISTRYBOOK - CENGAGE CHEMISTRY ENGLISHCHAPTER - SURFACE CHEMISTRYEXERCISE - Exercises Subjective
10 Videos
- SOLUTIONSBOOK - CENGAGE CHEMISTRY ENGLISHCHAPTER - SOLUTIONSEXERCISE - Ex 2.3 (Objective)
9 Videos
- SYNTHETIC AND NATURAL POLYMERSBOOK - CENGAGE CHEMISTRY ENGLISHCHAPTER - SYNTHETIC AND NATURAL POLYMERSEXERCISE - Exercises Assertion Reasoning
10 Videos
Similar Questions
A chemist studied the phenomenon of adsorption by putting blood charcoal in KCL solution. He observed difference in the behaviour with dilute KCL solution and with concentrated KCL solution. He also studied the adsorption of different gases on solid adsorbent and the effect of temperature on adsorption. He put forward a mathematical relationship relating x/m with equilibrium pressure.
Which of the following is correct ?
View SolutionA chemist studied the phenomenon of adsorption by putting blood charcoal in KCL solution. He observed difference in the behaviour with dilute KCL solution and with concentrated KCL solution. He also studied the adsorption of different gases on solid adsorbent and the effect of temperature on adsorption. He put forward a mathematical relationship relating x/m with equilibrium pressure.
Which of the following result is oberved with the experiment of KCl solution ?
View Solution
Knowledge Check
Which plot is the adsorption isobar for chemisorption?
A B
B C
C D
D
A chemist studied the phenomenon of adsorption by putting blood charcoal in KCL solution. He observed difference in the behaviour with dilute KCL solution and with concentrated KCL solution. He also studied the adsorption of different gases on solid adsorbent and the effect of temperature on adsorption. He put forward a mathematical relationship relating x/m with equilibrium pressure.
The correct order of the adsorption of gases will be
View SolutionThe physical adsorption of gases on the solid surface is due to :
View SolutionWhen the temperature is lowered and pressure is raised, the adsorption of a gas on a solid
View SolutionWhen the temperature is lowered and pressure is raised, the adsorption of a gas on a solid
View SolutionDiscuss different types of adsorption and their properties.
View Solutionwhich of the following factors affects the adsorption of a gas on solid ?
View SolutionWhich plot is the adsorption isobar for chemisorption?
View Solution
