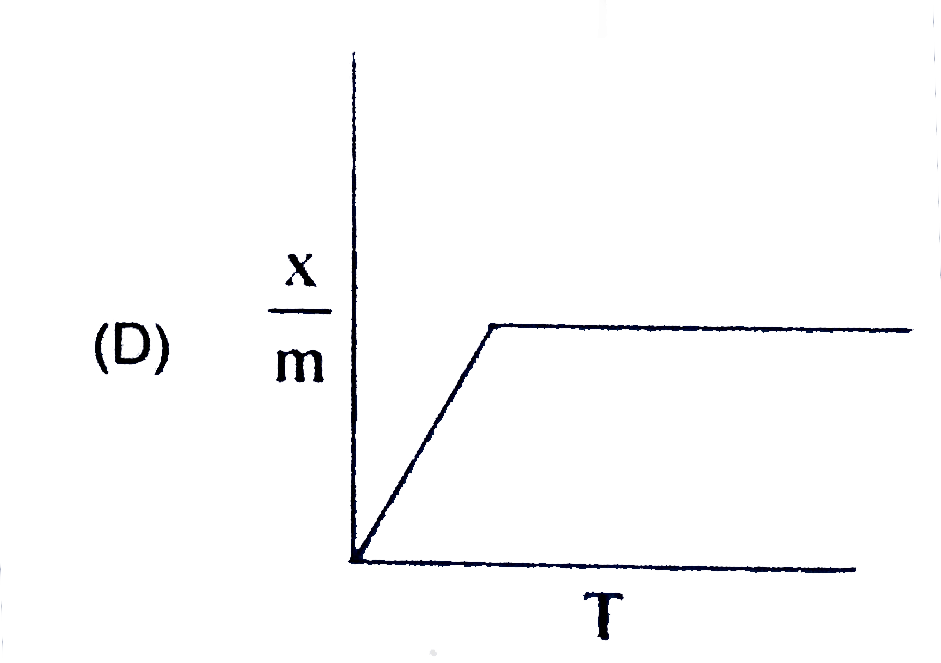
Which plot is the adsorption isobar for chemisorption?


The correct Answer is:C
To determine which plot represents the adsorption isobar for chemisorption, we need to analyze the characteristics of chemisorption and how it behaves with temperature changes.
1. Understanding Chemisorption:
- Chemisorption is a type of adsorption that involves a chemical reaction between the adsorbate and the surface of the adsorbent. It typically requires high activation energy.
2. Effect of Temperature on Chemisorption:
- Initially, as the temperature increases, the rate of adsorption also increases. This is because higher temperatures provide the energy needed to overcome the activation barrier.
- However, after a certain point, further increases in temperature will lead to a decrease in adsorption. This is because the increased kinetic energy at high temperatures can lead to desorption, where the adsorbate molecules leave the surface.
3. Analyzing the Graphs:
- Option A: The graph shows a decreasing trend as temperature increases. This contradicts the initial increase in adsorption with temperature, so we can eliminate this option.
- Option B: Similar to Option A, this graph also shows a decrease in adsorption with increasing temperature from the start. Thus, this option can also be eliminated.
- Option C: This graph shows an initial increase in adsorption with increasing temperature, followed by a decrease after reaching a peak. This behavior aligns with the characteristics of chemisorption, where adsorption increases initially and then decreases at higher temperatures.
4. Conclusion:
- Based on the analysis, Option C is the correct answer as it accurately represents the adsorption isobar for chemisorption.
- Chemisorption is a type of adsorption that involves a chemical reaction between the adsorbate and the surface of the adsorbent. It typically requires high activation energy.
- Initially, as the temperature increases, the rate of adsorption also increases. This is because higher temperatures provide the energy needed to overcome the activation barrier.
- However, after a certain point, further increases in temperature will lead to a decrease in adsorption. This is because the increased kinetic energy at high temperatures can lead to desorption, where the adsorbate molecules leave the surface.
- Option A: The graph shows a decreasing trend as temperature increases. This contradicts the initial increase in adsorption with temperature, so we can eliminate this option.
- Option B: Similar to Option A, this graph also shows a decrease in adsorption with increasing temperature from the start. Thus, this option can also be eliminated.
- Option C: This graph shows an initial increase in adsorption with increasing temperature, followed by a decrease after reaching a peak. This behavior aligns with the characteristics of chemisorption, where adsorption increases initially and then decreases at higher temperatures.
- Based on the analysis, Option C is the correct answer as it accurately represents the adsorption isobar for chemisorption.
Similar Questions
Knowledge Check
- Question 1 - Select One
The rate of chemisorption :
Ais independent of pressureBdecreases with increase of pressureCincreases with increase of pressureDnone of these
Which one is not the characteristic of chemisorption:
View SolutionWhat is meant by chemisorption?
View SolutionWhat do you understand by adsorption isotherm and adsorption isobar ? Explain Freundlich adsorption isotherm for the adsorption of gases on solids.
View SolutionWhich one of the following is incorrect for chemisorption?
View SolutionWhich of the following is true with respect to chemical adsorption (chemisorption)?
View SolutionDefine adsorption. Write any two features which distinguish physisorption from chemisorption.
View SolutionWhich statement is incorrect for chemisorption?
View Solution

