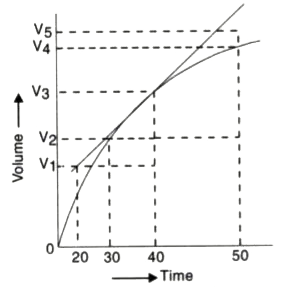
A graph of volume of hydrogen released vs time for the reaction between zinc and dil. HCl is given in Fig. On the basis of this mark the correct option.

Average rate upto 40 second isV3−V240
Average rate up to 40 seconds isV3−V240−30
Average rate upto 40 seconds is V340
Average rate upto 40 seconds isV3−V140−20
The correct Answer is:C
Average rate at 40 s =Increase in volumeTime=V340
Topper's Solved these Questions
- BOOK - ICSECHAPTER - CHEMICAL KINETICSEXERCISE - EXERCISE (PART- I (OBJECTIVE QUESRTIONS) C. CORRECT THE FOLLOWING STATEMENTS BY CHANGING THE UNDERLINED PART OF THE STATEMENT ( DO NOT CHANGE THE WHOLE SENTENCE .))39videos
CHEMICAL KINETICS
- BOOK - ICSECHAPTER - CHEMICAL KINETICSEXERCISE - EXERCISE (PART- I (OBJECTIVE QUESRTIONS) D. MATCH THE FOLLOWING )3videos
CHEMICAL KINETICS
- BOOK - ICSECHAPTER - CHEMICAL KINETICSEXERCISE - EXERCISE (PART- I (OBJECTIVE QUESRTIONS)A.FILL IN THE BLANKS)54videos
CHEMICAL KINETICS
- BOOK - ICSECHAPTER - BIOMOLECULESEXERCISE - ISC EXAMINATION QUSTIONS (PART-I)(DESCRIPTIVE QUESTIONS)21videos
BIOMOLECULES
- BOOK - ICSECHAPTER - CHEMISTRY IN EVERYDAY LIFEEXERCISE - EXERCISE (PART - II (DESCRIPTIVE QUESTIONS) (LONG ANSWER QUESTIONS))19videos
CHEMISTRY IN EVERYDAY LIFE
Similar Questions
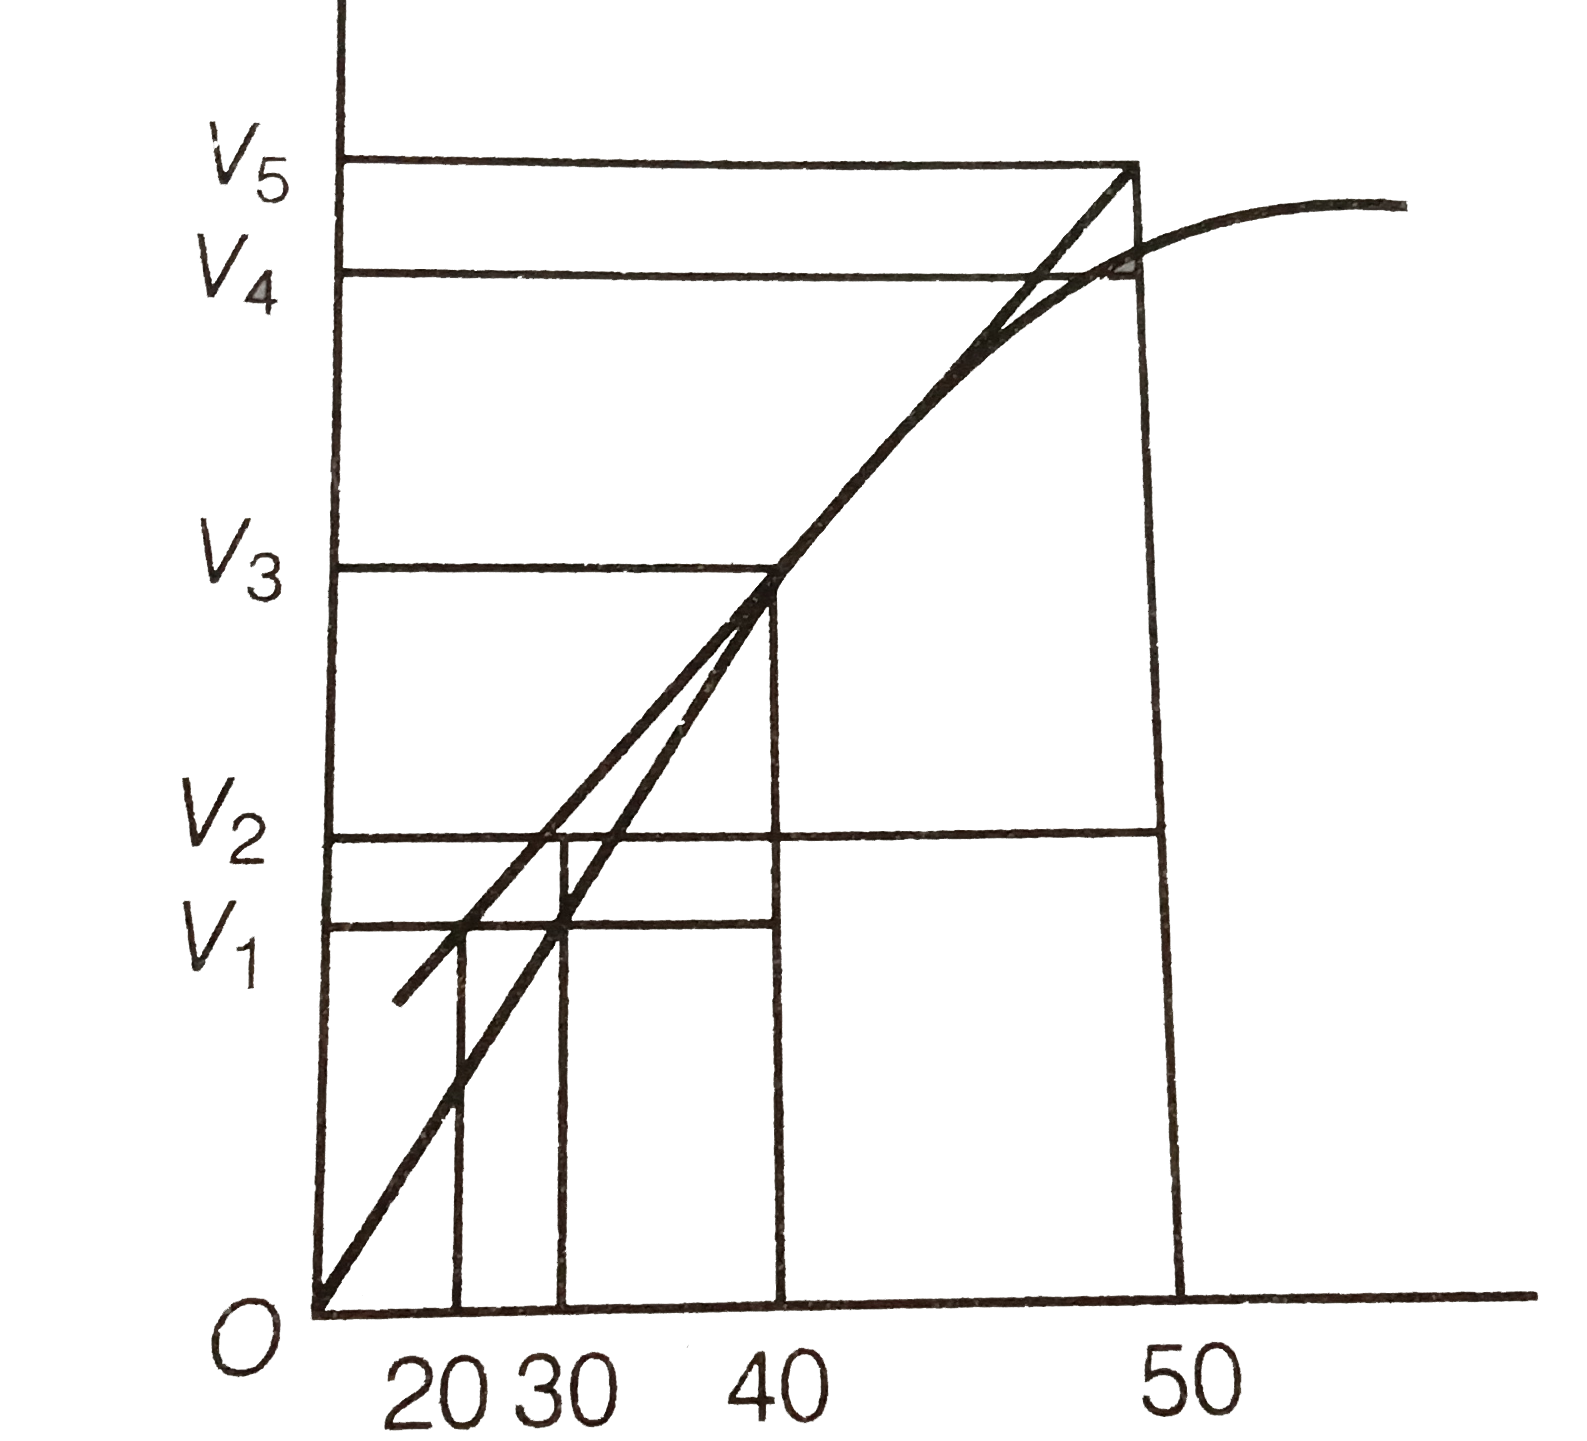
A graph of volume of hydrogen released vs time for the reaction between zinc and dil. HCl is given in figure . On the basis of this markt the correct options.
 View Solution
Two students performed the same experiment separately and each one of them recorded two readings of mass which are given below. Correct reading of mass is 3.0 g. On the basis of given data, mark the correct option out of the following statements.
 View Solution
Knowledge Check
- Question 1 - Select One
Given graph represents the response of organisms to various abiotic factors. On this basis, select the correct option for (i), (ii) and(iii)
 A(i)(ii)(iii).ConformersRegulatorsPartial regulatorsB(i)(ii)(iii).RegulatorsPartial regulatorsConformersC(i)(ii)(iii).Partial regulatorsRegulatorsConformersD(i)(ii)(iii).RegulatorsConformersPartial regulators
A comet is in highly elliptical orbit around the Sun. The period of the comet's orbit is 90 days. Some statements are given regarding the collision between the comet and the earth. Mark the correct statement. [Mass of the Sun =2×1030kg, mean distance between the earth and the Sun =1.5×10¹¹m.]
View SolutionConsider a uniform wire of length l. Cross-sectional area A, Young's modulus of the material of the wave is Y. Some information related to the wire is given in column-1 and dependence of the result is given in column-2. Then match the approprite choice between the columns and match the list given in options
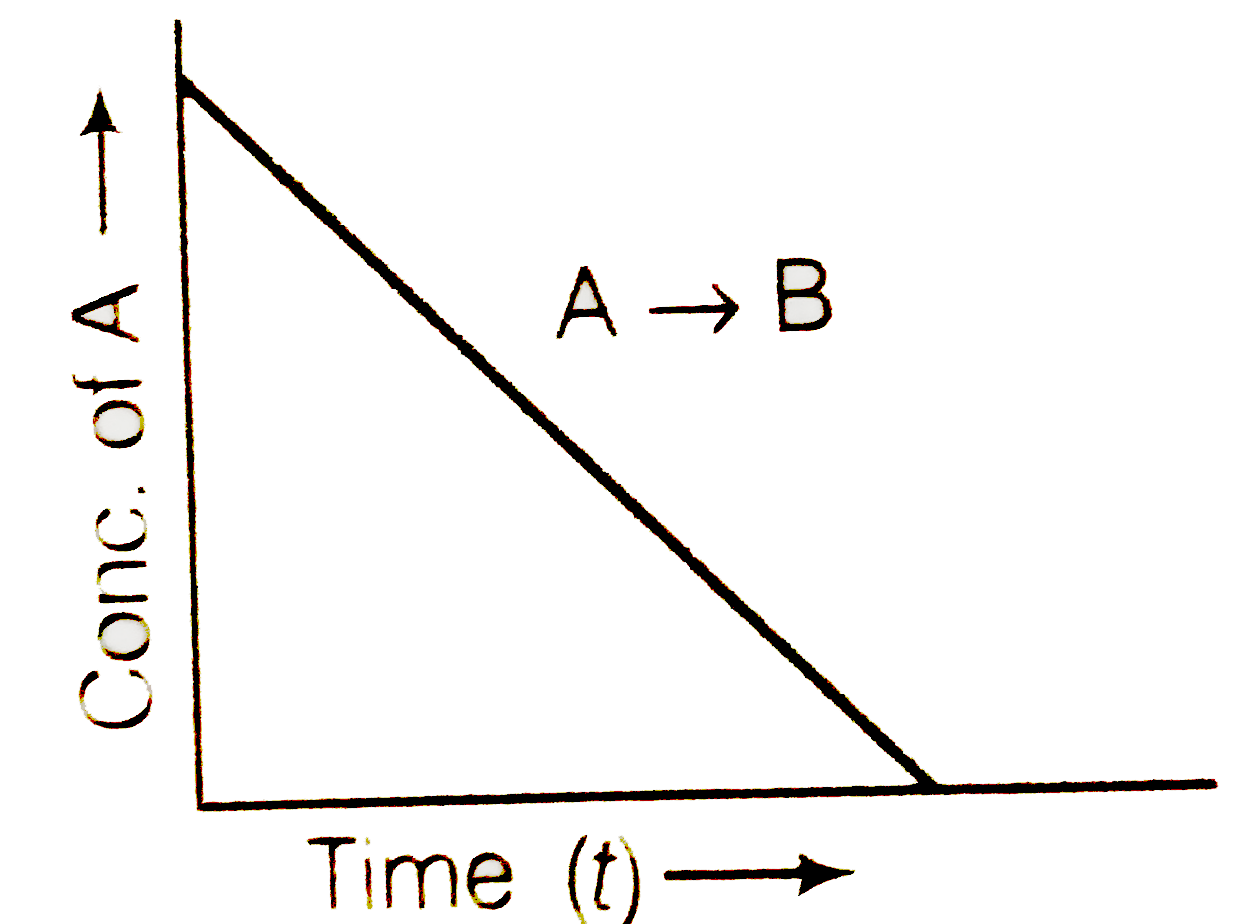
Column-I Column-II(A) Let us suspend wire vertically from a (p) Young'sModulusrigud support and attach a mass m atits lower end. If the mass is slightly pulleddown and released, it executes S.H.Mof a time period which will depend on(B) Work done in stretching the wire up to length (q) elongation (x)l+xwill depend on(C) If the given is fixed between two rigid (r) length (l)supports and its temperature is decreasedthermal stress that develops in the wirewill depend on(D) If the wire is pulled at its ends equal and (s) area of cross-section (A) opposite forces of magnitude F so that itundergoes an elongation x, according toHook's law, F=kx, where k is the forceconstant.Force constant (k) of the wirewill depend onView SolutionFor a general reaction A→B, plot of concentration of A vs time is given in figure. Answer the following questions on the basis of this graph.
(i) what is the order of the reaction?
(ii) What is the slope of the curve ?
(iii) What are the units of rate constant?
 View Solution
Potential for some half cell reactions are given below. On the basis of these mark the correct answer.
(i) H+(aq)+e−→(12)H2(g) E∘cell=0.00V
(ii) 2H2O(l)→O2(g)+4H+(aq)+4e−, Ecell=1.23V
(iii) 2SO2−4(aq)→S2O2−8(aq)+2e−,E∘cell=1.96VView Solution
Strong acid versus strong base:
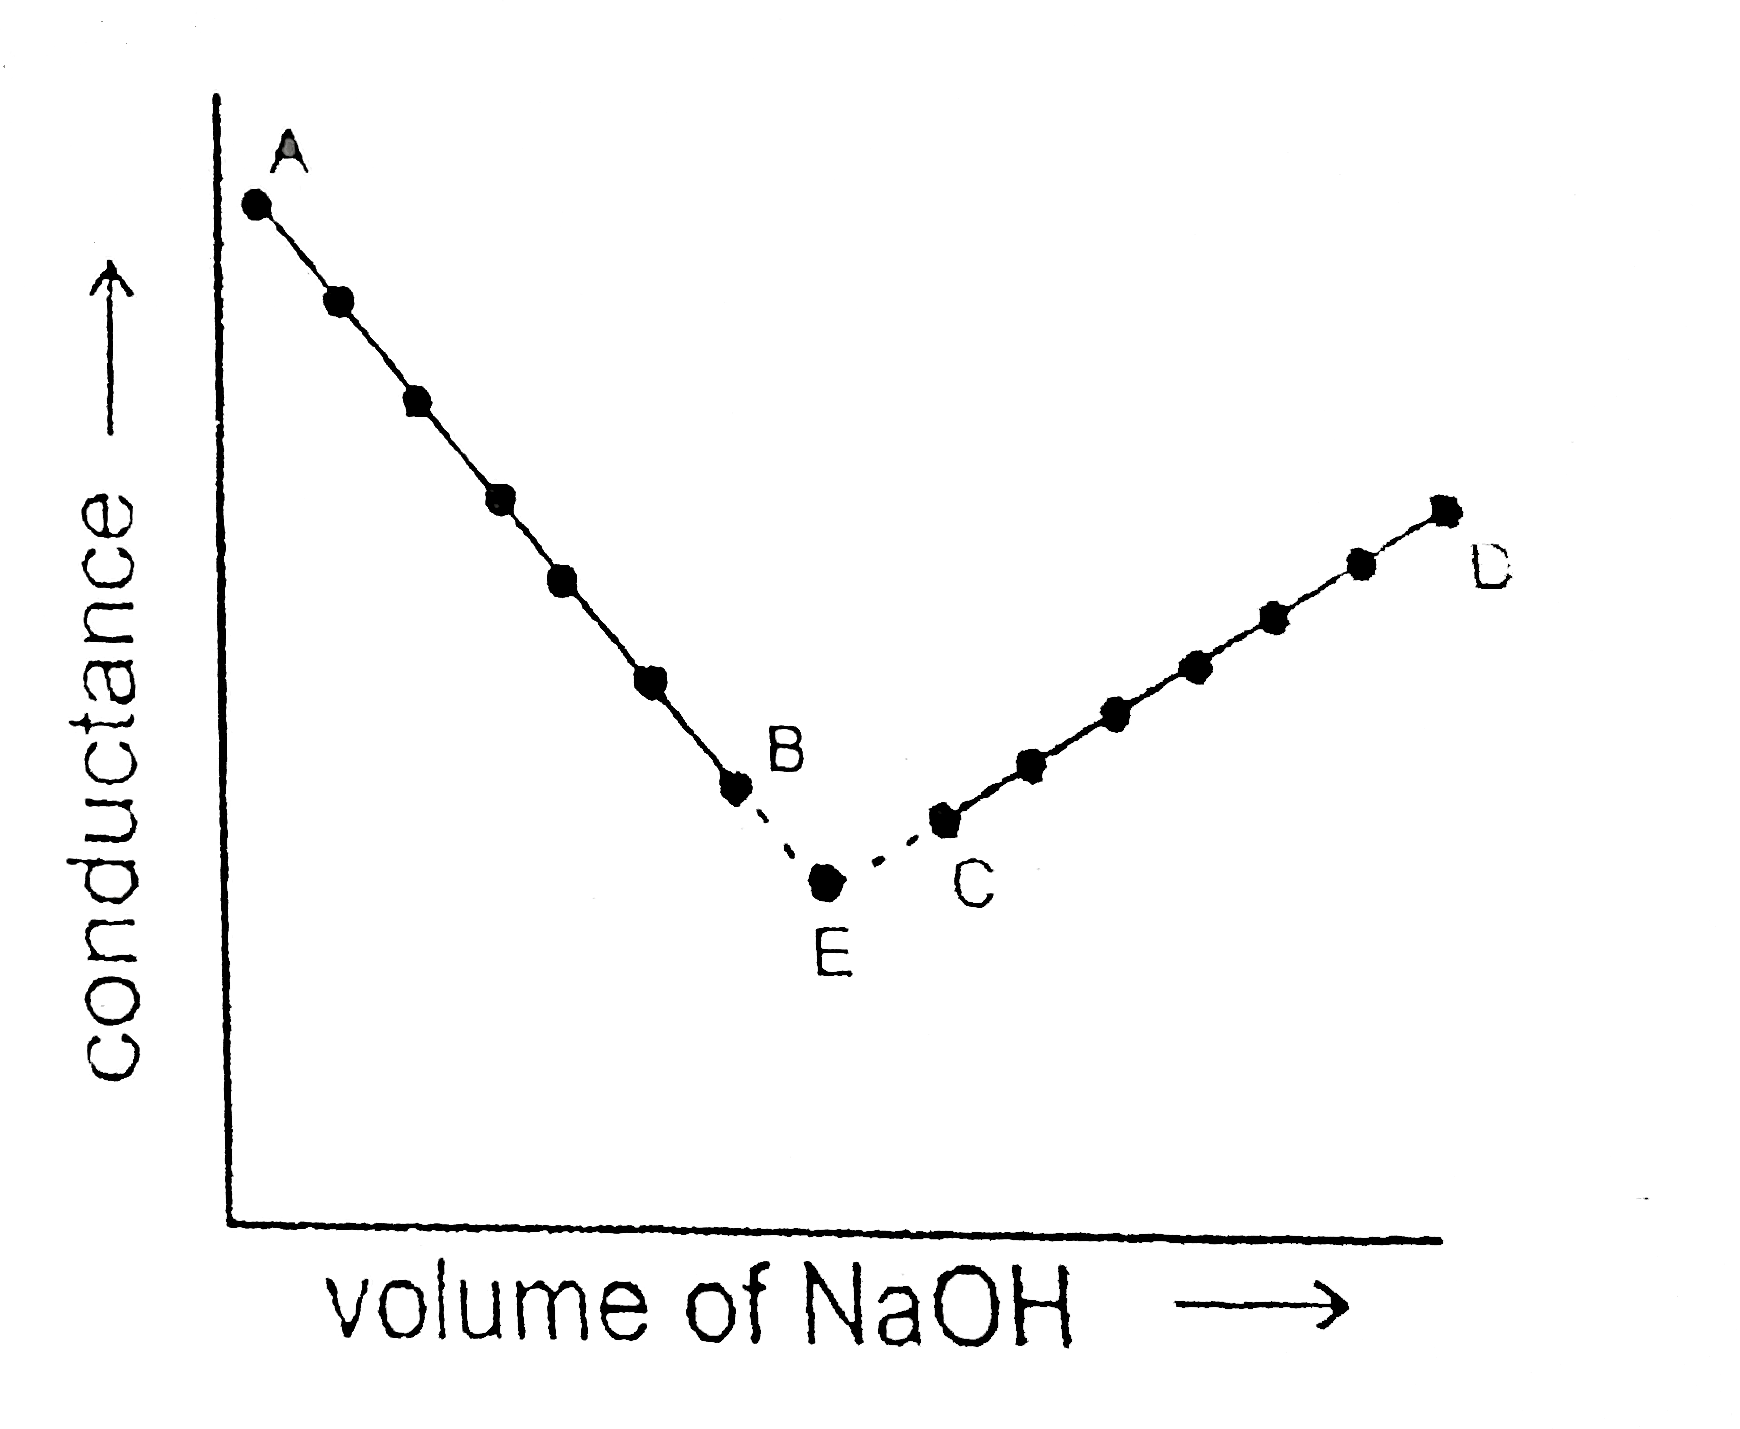
The principle of conductometric titrations is based on the fact that during the titration, one of the ions is replaced by the other and invariable these two ions differ in the ionic conductivity with the result that thhe conductivity of the solution varies during the course of the titration. take, for example, the titration between a strong acid, say HCl, and a string base, say NaOH before NaOH is added, the conductance of HCl solution has a high value due to the presence of highly mobile hydrogen ions. As NaOH is added, H+ ions are replaced by relatively slower moving Na+ ions. consequently the conductance of the solution decreases and this continues right upto the equivalence point where the solution contains only NaCl. Beyond the equivalence point, if more of NaOH is added, then the solution contains a excess of the fast moving OH− ions with the result that its conductance is increased ad it condinues to increase as more and more of NaOH is added. If we plot the conductance value versus the amount of NaOH added, we get a curve of the type shown in Fig. The descending portion AB represents the conductances before the equivalence point (solution contains a mixture of acid HCl and the salt NaCl) and the ascending portion CD represents the conductances after the equivalence point (solution contains the salt NaCl and the excess of NaOH). The point E which represent the minium conductance is due to the solution containing only NaCl with no free acid or alkali and thus represents the equivalence point. this point can, however, be obtained by the extrapolation of the lines AB and DC, and therefore, one is not very particular in locating this point expermentally as it is in the case of ordinary acid-base titrations involving the acid-base indicators.
Weak acid versus strong base:
Let us take specific example of acetic acid being titrated against NaOH. Before the addition of alkali, the solution shows poor conductance due to feeble ionization of acetic acid. Initially the addition of alkali causes not only the replacement of H+ by Na+ but also suppresses the dissociation of acetic acid due to the common ion Ac− and thus the conductance of the solution decreases in the beginning. but very soon the conductance start increasing as addition of NaOH neutralizes the undissociated HAc to Na+Ac− thus causing the replacement of non-conducting HAc with Strong-conducting electrolyte Na+Ac−. the increase in conductance continuous right up to the equivalence point. Beyond this point conductance increases more rapidly with the addition of NaOH due to the highly conducting OH− ions, the graph near the equivalence point is curved due to the hydrolysis of the salt NaAc. The actual equivalence point can, as usual, be obtained by the extrapolation method.
In all these graphs it has been assumed that the volume change due addition of solution from burrette is negnigible, hence volume change of the solution in beaker the conductance of which is measured is almost constant throughout the measurement.
Q. The nature of curve obtained for the titration between weak acid versus strong base as described in the above passage will be:View SolutionHydrogen gas is prepared in the laboratory by reacting dilute HCl with granulated zinc, Following reaction takes place
Zn+2HCl→ZnCl2+H2
Calculate the volume of hydrogen gas liberated at STP when 32.65 g of zinc reacts with HCl. 1 mole of a gas occupies 22.7 L volume at STP, atomic mass of Zn=65 .3uView SolutionConsider the reactions given below .On the basis of these reactions ,Find out which of the algebraic relations given in options (a) to(d) is correct?
(p)C(g)+4H(g)→CH4(g),ΔrH=xKJmol−1
(Q)C(graphite)+2H2(g)→CH4(g),
ΔrH=yKJmol−1View Solution
