An ideal gas undergoes a reversible isothermal expansion from state I to state II followed by a reversible adiabatic expansion from state II to state III. The correct plot(s) representing the changes from state I to state III is(are)


The correct Answer is:A:B:D
To solve the problem of an ideal gas undergoing a reversible isothermal expansion followed by a reversible adiabatic expansion, we need to analyze the processes step by step and determine the correct plots that represent the changes from state I to state III.
Step 1: Understand the Processes
1. Reversible Isothermal Expansion (State I to State II):
- In this process, the temperature remains constant (T = constant).
- As the gas expands, its volume increases (V increases).
- Since the process is isothermal for an ideal gas, the pressure decreases (P decreases) according to the ideal gas law (PV = nRT).
2. Reversible Adiabatic Expansion (State II to State III):
- In this process, there is no heat exchange with the surroundings (Q = 0).
- The gas does work on the surroundings as it expands, which results in a decrease in internal energy (U decreases).
- Consequently, the temperature of the gas decreases (T decreases) during this expansion.
Step 2: Analyze the Graphs
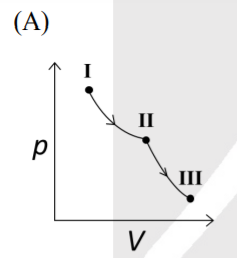
1. Graph A (P vs. V):
- For the isothermal process (I to II), the curve is hyperbolic, showing a decrease in pressure with an increase in volume.
- For the adiabatic process (II to III), the curve is steeper than the isothermal curve, indicating a more significant decrease in pressure with volume increase.
- This graph is correct.
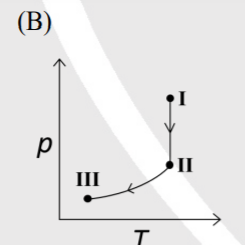
2. Graph B (P vs. T):
- From I to II, since the temperature is constant, the line is horizontal.
- From II to III, as the gas expands adiabatically, the temperature decreases, resulting in a downward slope.
- This graph is also correct.
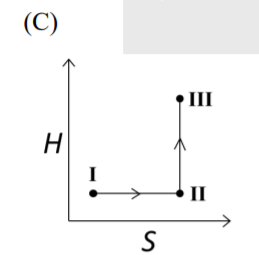
3. Graph C (H vs. S):
- For the isothermal process, enthalpy (H) remains constant, but the entropy (S) increases.
- For the adiabatic process, the temperature decreases, which should lead to a decrease in enthalpy as well.
- If the graph shows an increase in enthalpy while the temperature is decreasing, this is incorrect.
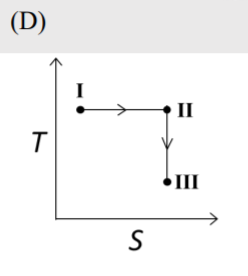
4. Graph D (T vs. S):
- During the isothermal expansion, the temperature remains constant, leading to a horizontal line.
- During the adiabatic expansion, the temperature decreases while entropy increases.
- This graph is correct.
Conclusion
The correct plots representing the changes from state I to state III are:
- Graph A (P vs. V)
- Graph B (P vs. T)
- Graph D (T vs. S)
Incorrect Plot:
- Graph C (H vs. S) is incorrect due to the inconsistency in the expected behavior of enthalpy during the adiabatic process.
Final Answer:
The correct plots are A, B, and D. The incorrect plot is C.
1. Reversible Isothermal Expansion (State I to State II):
- In this process, the temperature remains constant (T = constant).
- As the gas expands, its volume increases (V increases).
- Since the process is isothermal for an ideal gas, the pressure decreases (P decreases) according to the ideal gas law (PV = nRT).
- In this process, there is no heat exchange with the surroundings (Q = 0).
- The gas does work on the surroundings as it expands, which results in a decrease in internal energy (U decreases).
- Consequently, the temperature of the gas decreases (T decreases) during this expansion.
1. Graph A (P vs. V):
- For the isothermal process (I to II), the curve is hyperbolic, showing a decrease in pressure with an increase in volume.
- For the adiabatic process (II to III), the curve is steeper than the isothermal curve, indicating a more significant decrease in pressure with volume increase.
- This graph is correct.
- From I to II, since the temperature is constant, the line is horizontal.
- From II to III, as the gas expands adiabatically, the temperature decreases, resulting in a downward slope.
- This graph is also correct.
- For the isothermal process, enthalpy (H) remains constant, but the entropy (S) increases.
- For the adiabatic process, the temperature decreases, which should lead to a decrease in enthalpy as well.
- If the graph shows an increase in enthalpy while the temperature is decreasing, this is incorrect.
- During the isothermal expansion, the temperature remains constant, leading to a horizontal line.
- During the adiabatic expansion, the temperature decreases while entropy increases.
- This graph is correct.
The correct plots representing the changes from state I to state III are:
- Graph A (P vs. V)
- Graph B (P vs. T)
- Graph D (T vs. S)
- Graph C (H vs. S) is incorrect due to the inconsistency in the expected behavior of enthalpy during the adiabatic process.
The correct plots are A, B, and D. The incorrect plot is C.
Topper's Solved these Questions
Similar Questions
Knowledge Check
In a change from state A to state B
Aq depends only on the initial and final stateBw depends only on the initial and final stateCΔE depends only on the initial and final stateDΔE depends upon the path adopted by A to change into B.In a change from state A to state B
A"q" depends only on the initial and final state.BW depends only on the initial and final state.CΔE depends only on the initial and final state,DΔE depends upon the path adopted by "A" to change into "B"An ideal gas undergoes isothermal process from some initial state i to final state f. Choose the correct alternatives.
AdU=0Bdθ=0Cdθ=dUDdw=dw
An idel gas undrgoes isothermal process from some initial state i to final state f. Choose the correct alternatives.
View SolutionAn ideal gas undergoes change in its state from the initial state I to the final state F via two possible paths as shown. Then

View SolutionIf a system undergoes an adiabatic change from state 1 to state 2, the work done by the gas is:
View SolutionOne mole of an ideal gas goes from an initial state A to final state B via two processs : It first undergoes isothermal expansion from volume V to 3V and then its volume is reduced from 3V to V at constant pressure. The correct P−V diagram representing the two process in (figure)
View SolutionProcess of change of state from gaseous state to liquid state is called
View Solution
