Boyle's Law for an ideal gas can be plotted as shown (→) (n: moles, T: temperature)
Note: T and n are kept constant along line L1, L2, and L3,
It follows from the above graph:
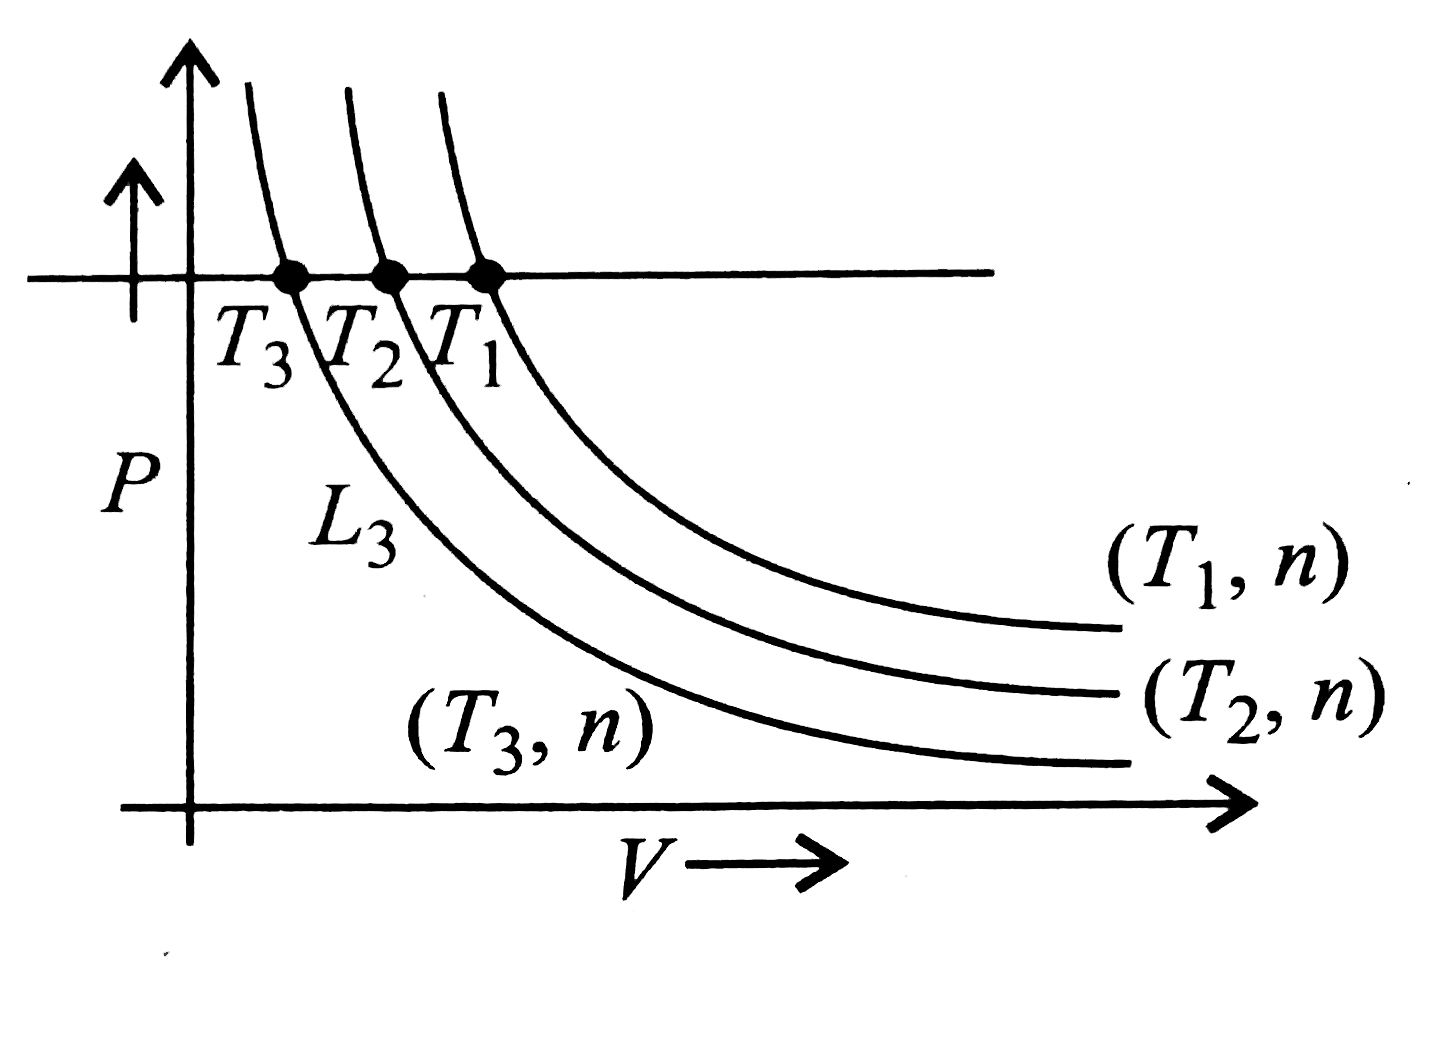
T1>T2>T3
T1<T2<T3
T1=T2=T3
None of these
T1>T2>T3
Topper's Solved these Questions
- BOOK - CENGAGE CHEMISTRYCHAPTER - STATES OF MATTEREXERCISE - Exercises21videos
STATES OF MATTER
- BOOK - CENGAGE CHEMISTRYCHAPTER - STATES OF MATTEREXERCISE - Exercises (Linked Comprehensive)48videos
STATES OF MATTER
- BOOK - CENGAGE CHEMISTRYCHAPTER - SOME BASIC CONCEPTS AND MOLE CONCEPTEXERCISE - Archives Subjective11videos
SOME BASIC CONCEPTS AND MOLE CONCEPT
- BOOK - CENGAGE CHEMISTRYCHAPTER - STOICHIOMETRYEXERCISE - Archives Subjective33videos
STOICHIOMETRY
Similar Questions
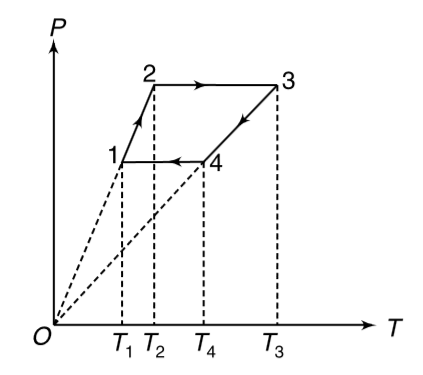
n moles of an ideal gas is taken through a four step cyclic process as shown in the diagram. Calculate work done by the gas in a cycle in terms of temperatures T1,T2,T3 and T4
 View Solution
A monoatomic ideal gas, initially at temperature T1 is enclosed in a cylinder fitted with a frictionless piston. The gas is allowed to expand adiabatically to a temperature T2 by releasing the piston suddenly. If L1 and L2 are the lengths of the gas column. before and after expansion respectively, then T1T2 is given by
View Solution
Knowledge Check
- Question 1 - Select One
Two lines with direction cosines l1,m1,n1andl2,m2,n2 are at right angle of
Al1l2−m1m2−n1n2=0Bl1l2+m1m2+n1n2=0Cl2=l2,m1=m2,n1=n2Dl1l2=m1m2=n1n2 - Question 2 - Select One
When a sample of ideal gas is changed from an initial state to a final state, various curves can be plotted for the process like P-V curve, V-T curve,P-T curve etc.
For example, P-V curve for a fixed amount of an ideal gas at constant temperature is a rectangular hyperbola, V-T curve for a fixed amount of an ideal gas at constant volume is again a straight line. However, the shapes may vary if the constant parameters are also changed.
Now, answer the following questions :
Two moles of an ideal gas is changed from its initial state (16 atm, 6L) to final state (4 atm, 15L) in such a way that this change can be represented by a straight line in P-V curve.The maximum temperature attained by the gas during the above change is :(Take : R=112LatmK−1mol−1)A324 KB648 KC1296 KD972 K - Question 3 - Select One
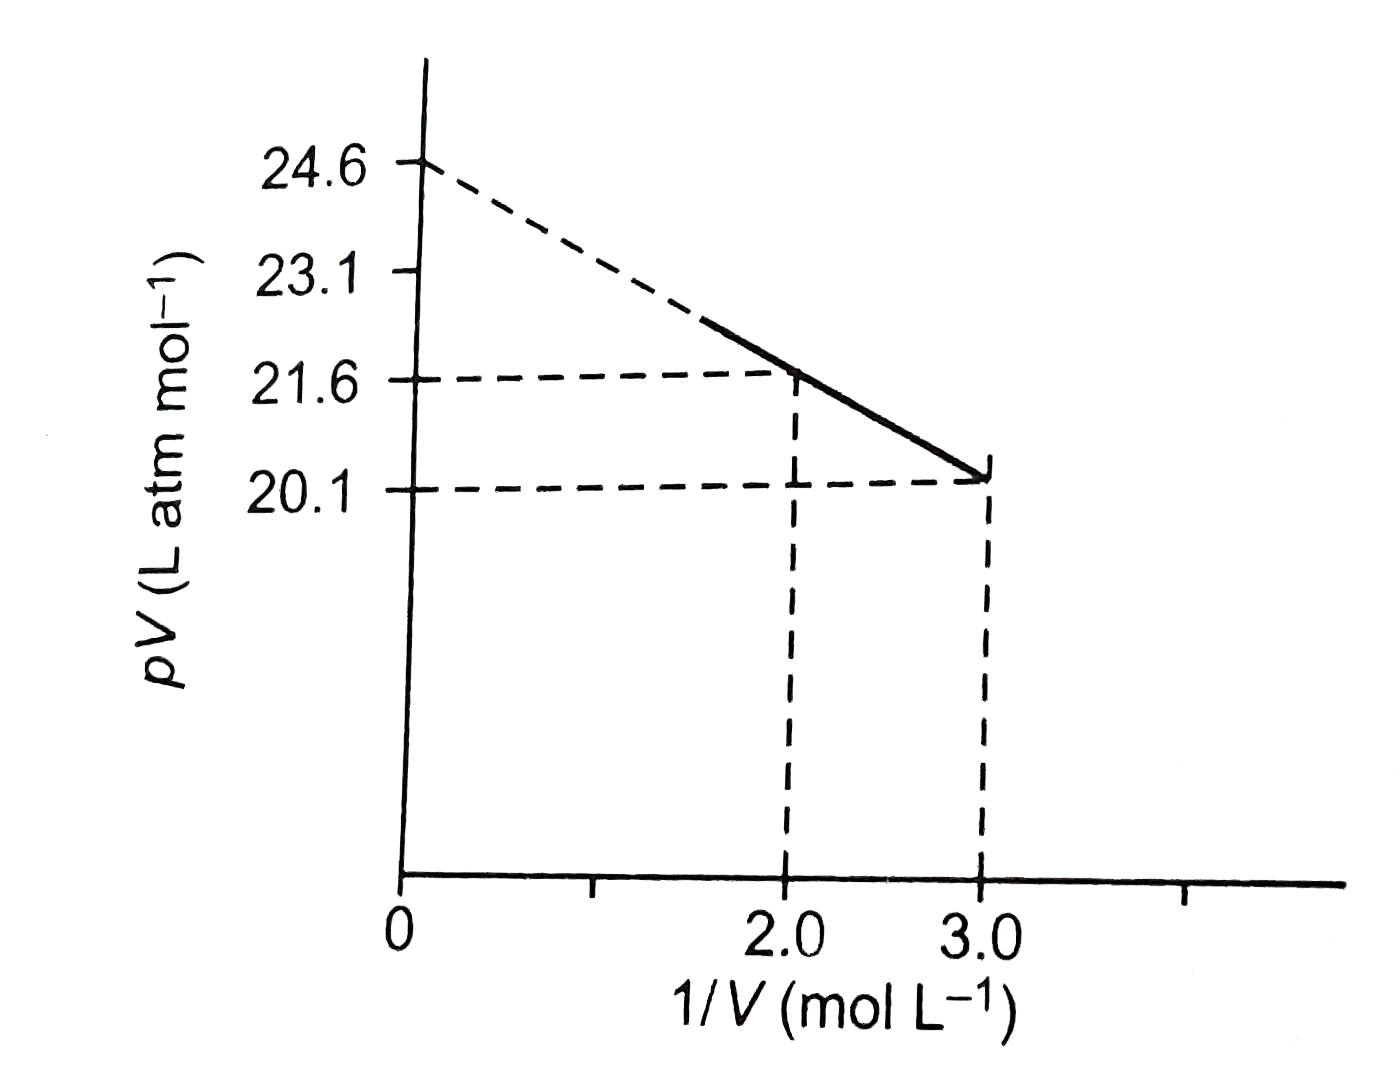
For one mole of a van der Waals' gas when b=0 and T=300K, the pVvs1/V plot is shown below. The value of the vander Waals' constant a(atm Lmol−2)
 A1B4.5C1.5D3
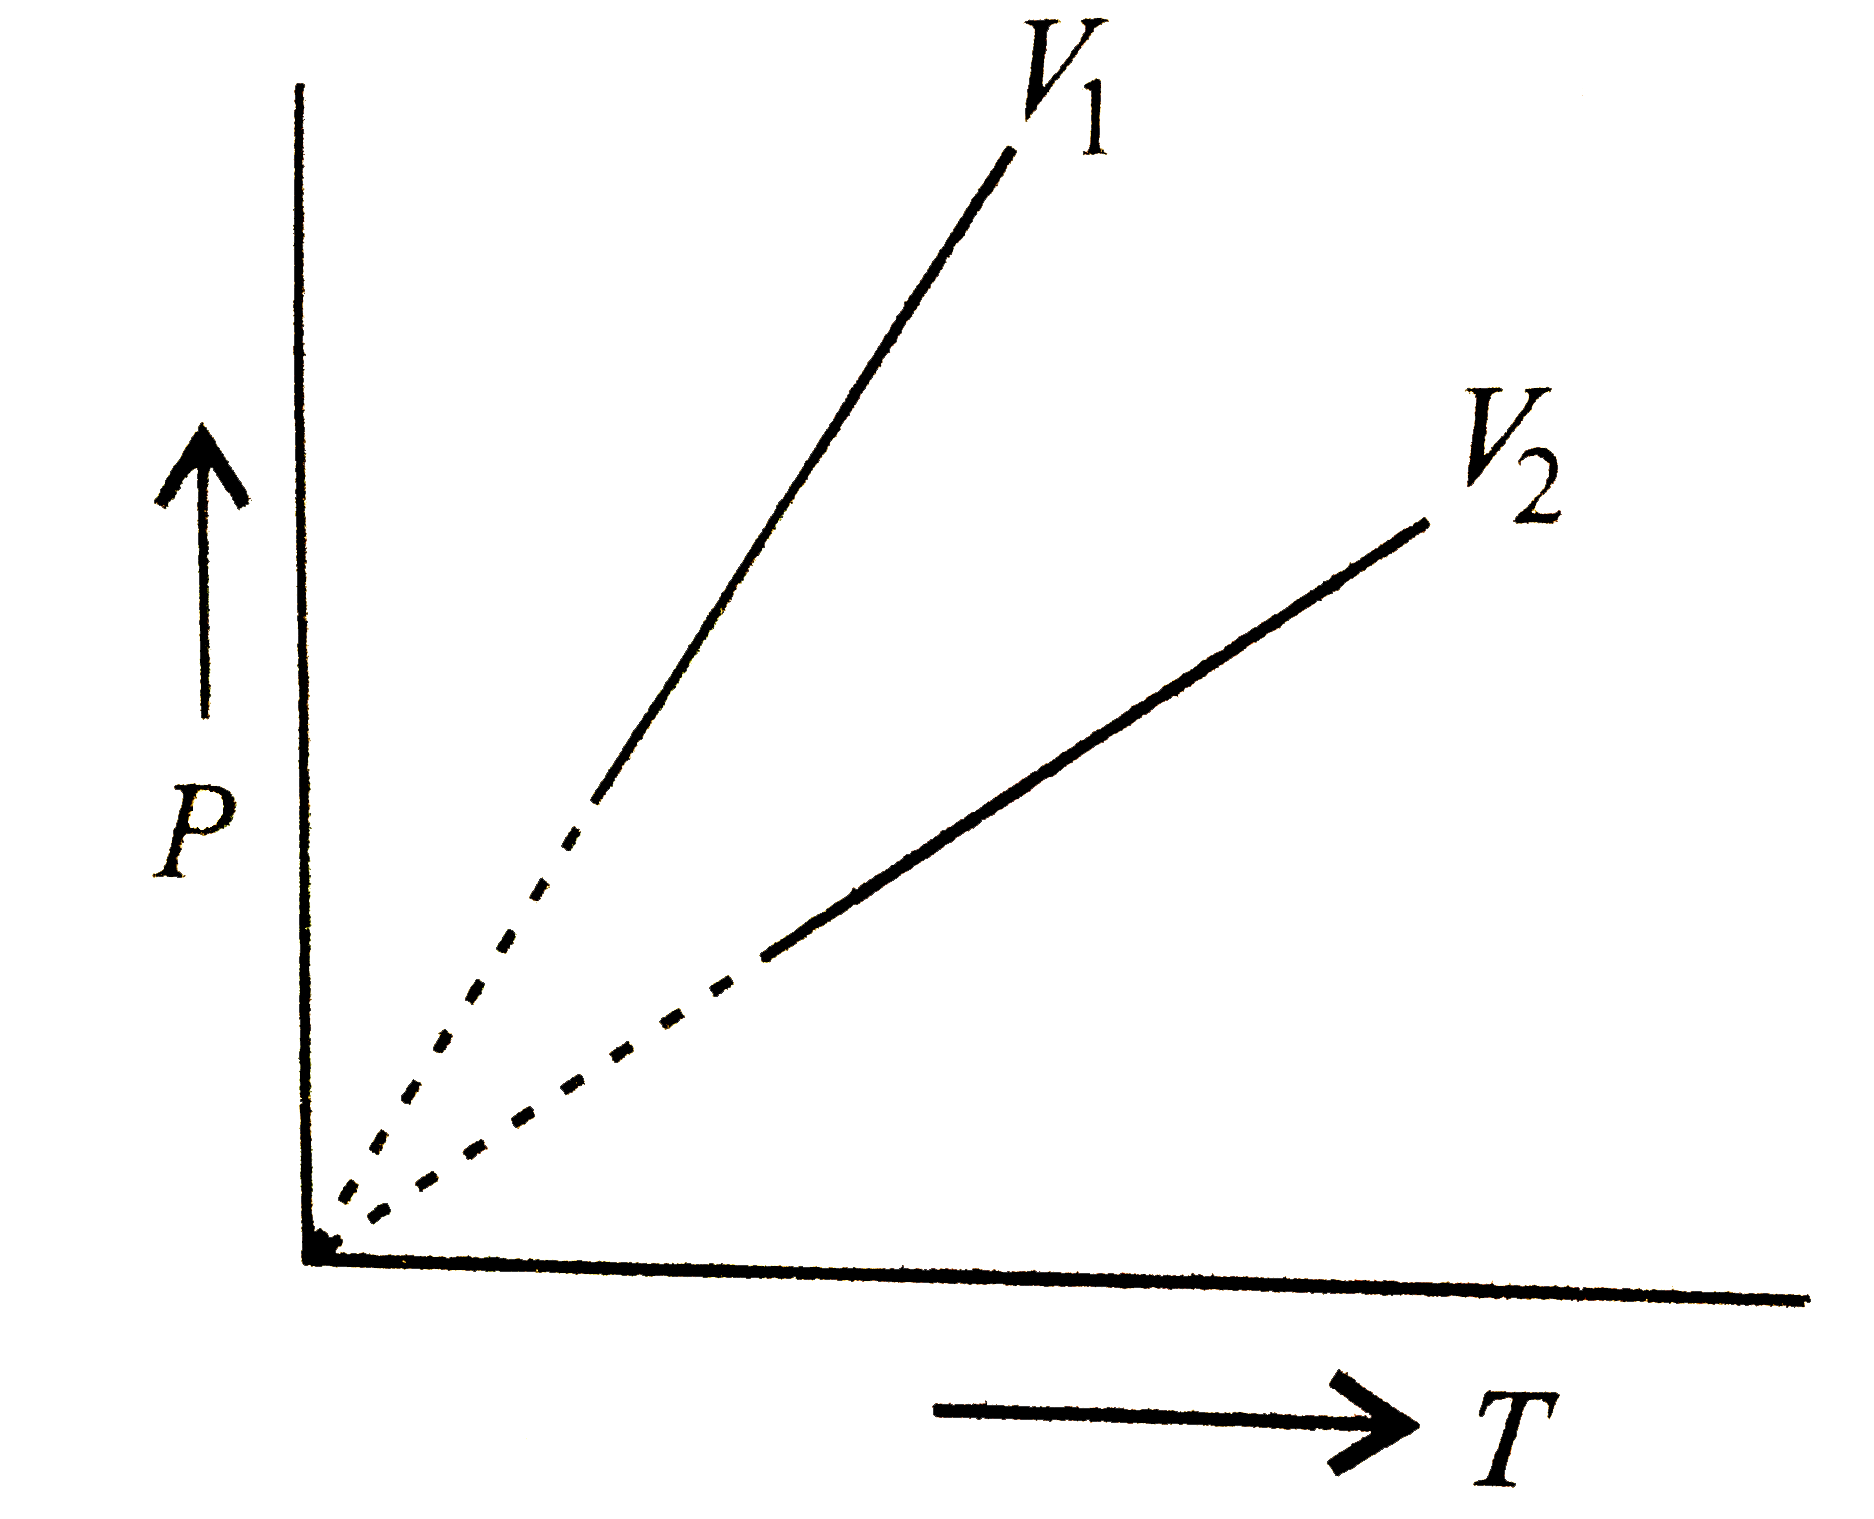
A plot of P vs T for a given mass of gas at constant volume is a straight line . P vs T at constant volumes V1 and V2 for an ideal gas are shown below :
Which of the following is correct ?
 View Solution
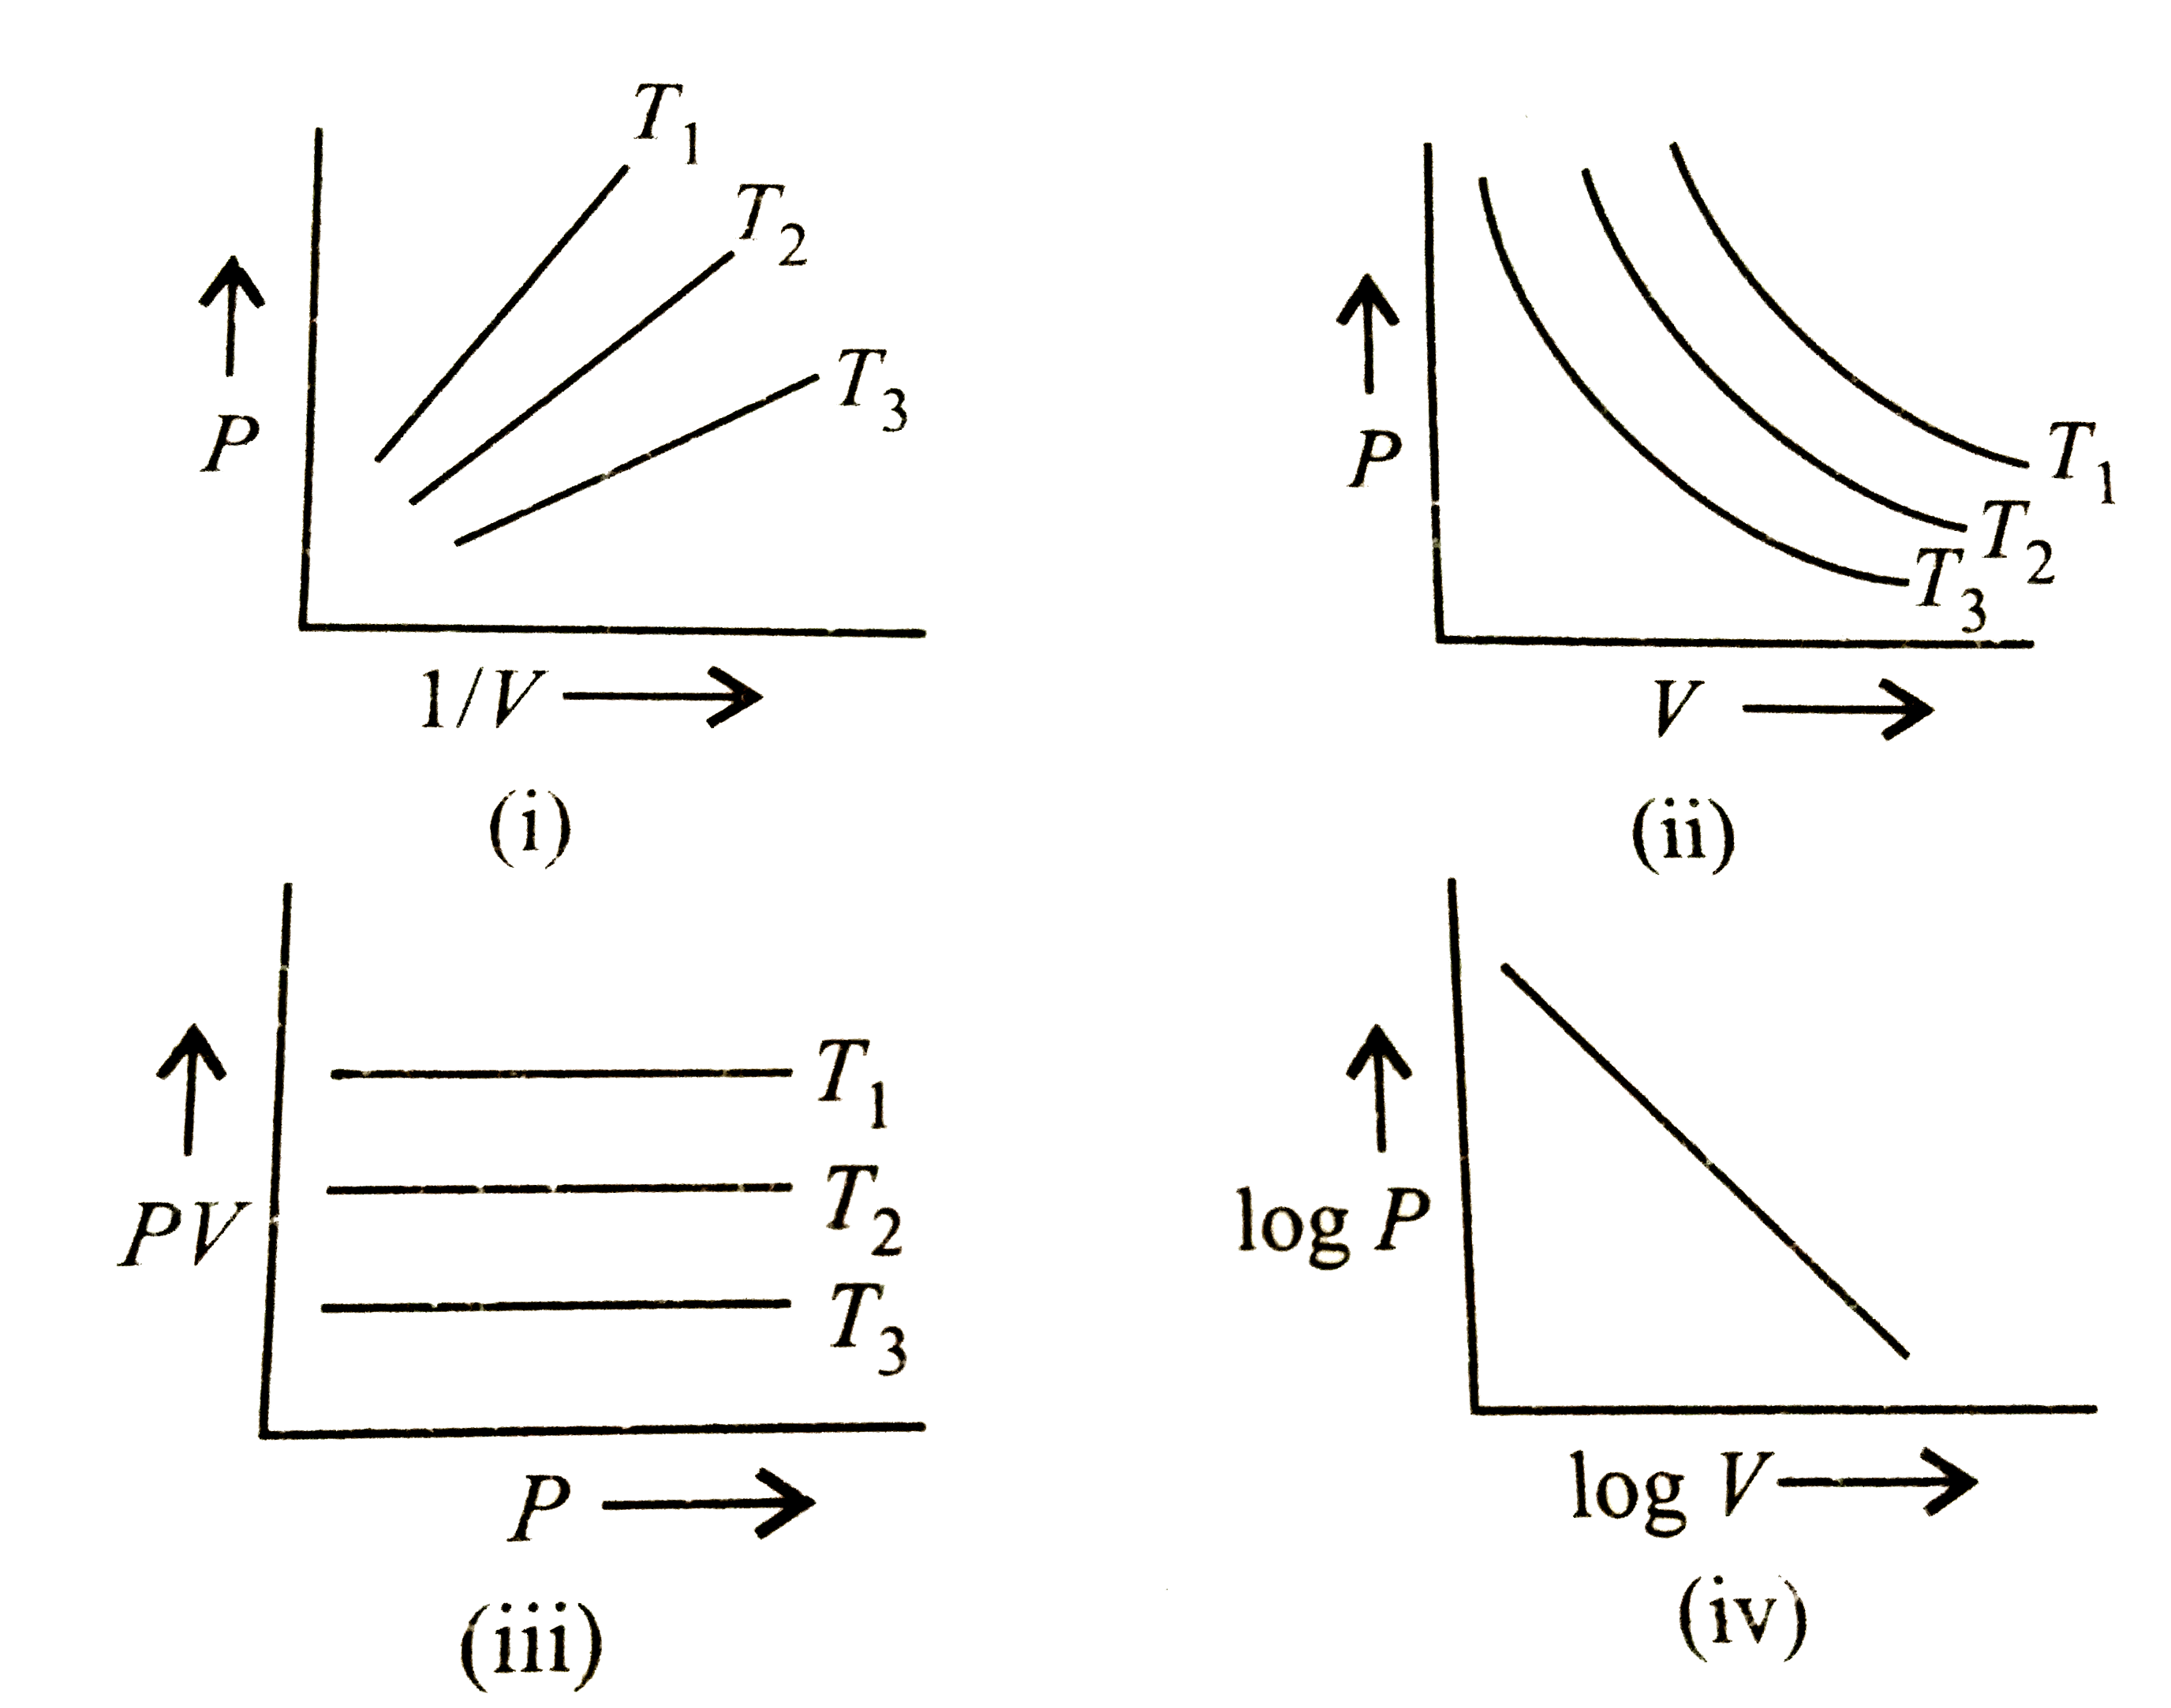
Graphs between pressure and volume are plotted at different temperatures . Which of the following isotherms represent Boyle's law as PV = constant ? (T1>T2>T3)
 View Solution
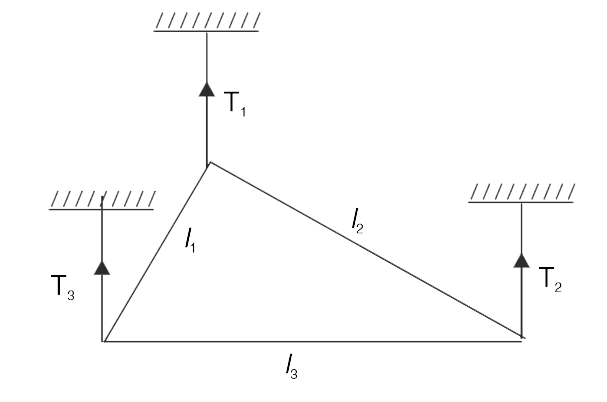
A uniform triangular plate is kept horizontal suspended with the help of three vertical threads as shown. The sides of the plate have length l1,l2 and l3. Find tension T1,T2 and T3 in the three threads. Mass of the plate is M.
 View Solution
If 1 mole of an ideal gas exapands isothermally at 37∘C from 15 L to 25L, the maximum work obtained is
View SolutionLet A be a relation on the set of all lines in a plane defined by (l2,l2)∈ R such that l1∣∣l2, the n R is
View Solution

