A plot of P vs T for a given mass of gas at constant volume is a straight line . P vs T at constant volumes V1 and V2 for an ideal gas are shown below :
Which of the following is correct ?
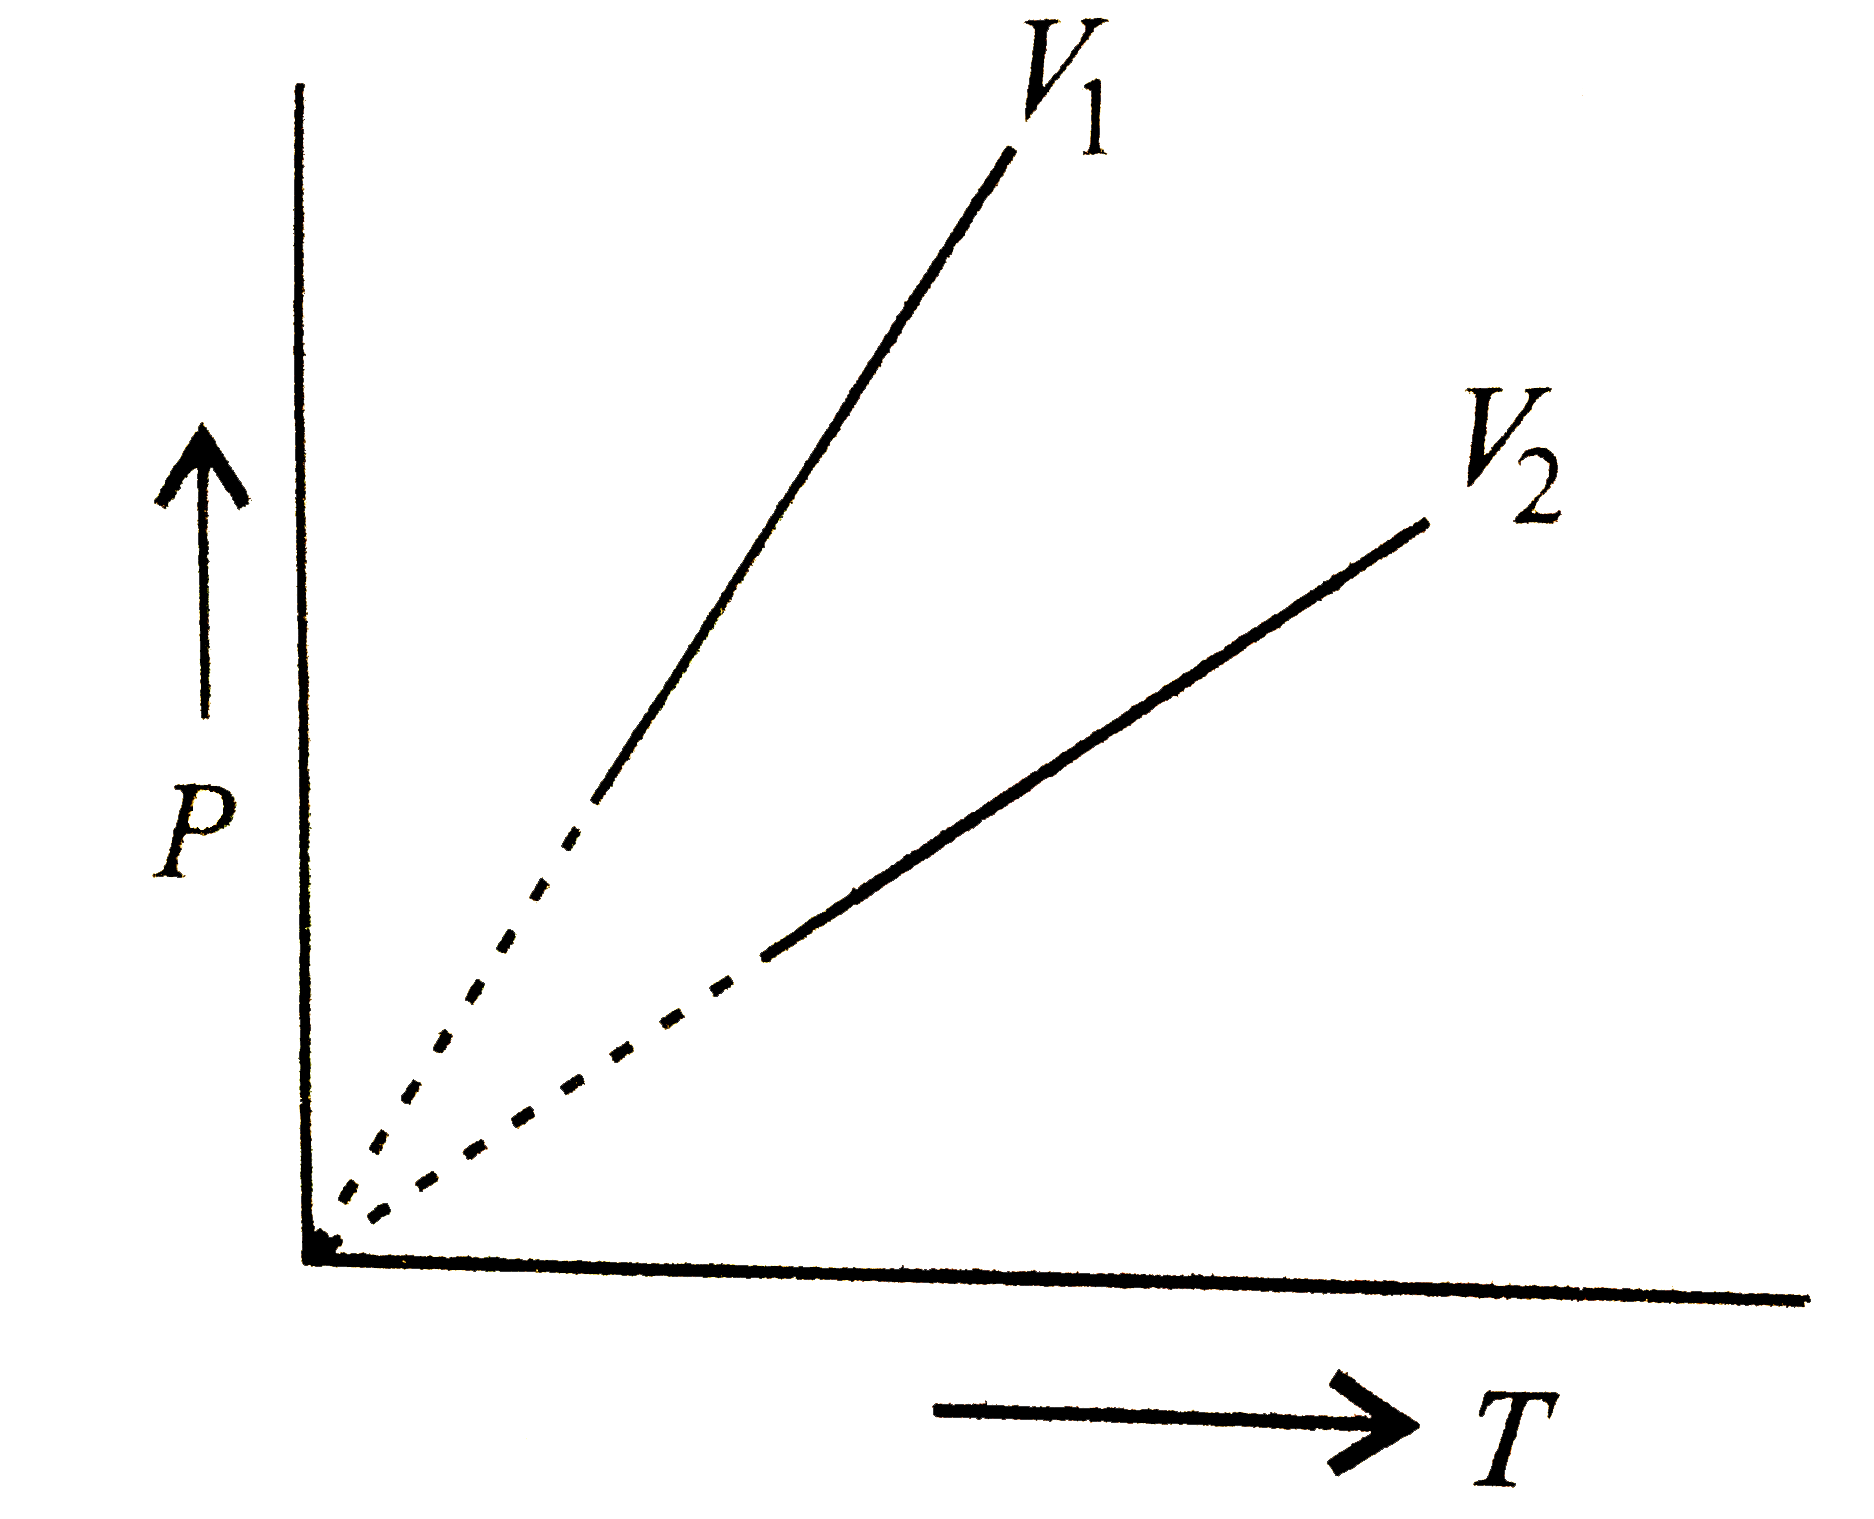
V1>V2
V1<V2
V1=V2
V1=2V2
The correct Answer is:B
Step by step video & image solution for A plot of P vs T for a given mass of gas at constant volume is a straight line . P vs T at constant volumes V_(1) and V_(2) for an ideal gas are shown below : Which of the following is correct ? by Chemistry experts to help you in doubts & scoring excellent marks in Class 11 exams.
Topper's Solved these Questions
- BOOK - NCERT FINGERTIPSCHAPTER - STATES OF MATTER EXERCISE - Ideal Gas Equation33videos
STATES OF MATTER
- BOOK - NCERT FINGERTIPSCHAPTER - STATES OF MATTER EXERCISE - Kinetic Energy And Molecular Speeds4videos
STATES OF MATTER
- BOOK - NCERT FINGERTIPSCHAPTER - STATES OF MATTER EXERCISE - MCQs3videos
STATES OF MATTER
- BOOK - NCERT FINGERTIPSCHAPTER - SOME BASIC CONCEPTS OF CHEMISTRY EXERCISE - Assertion And Reason10videos
SOME BASIC CONCEPTS OF CHEMISTRY
- BOOK - NCERT FINGERTIPSCHAPTER - STRUCTURE OF ATOM EXERCISE - Assertion And Reason15videos
STRUCTURE OF ATOM
Similar Questions
V vs T curves at different pressures P1 and P2 for an ideal gas are shown below:
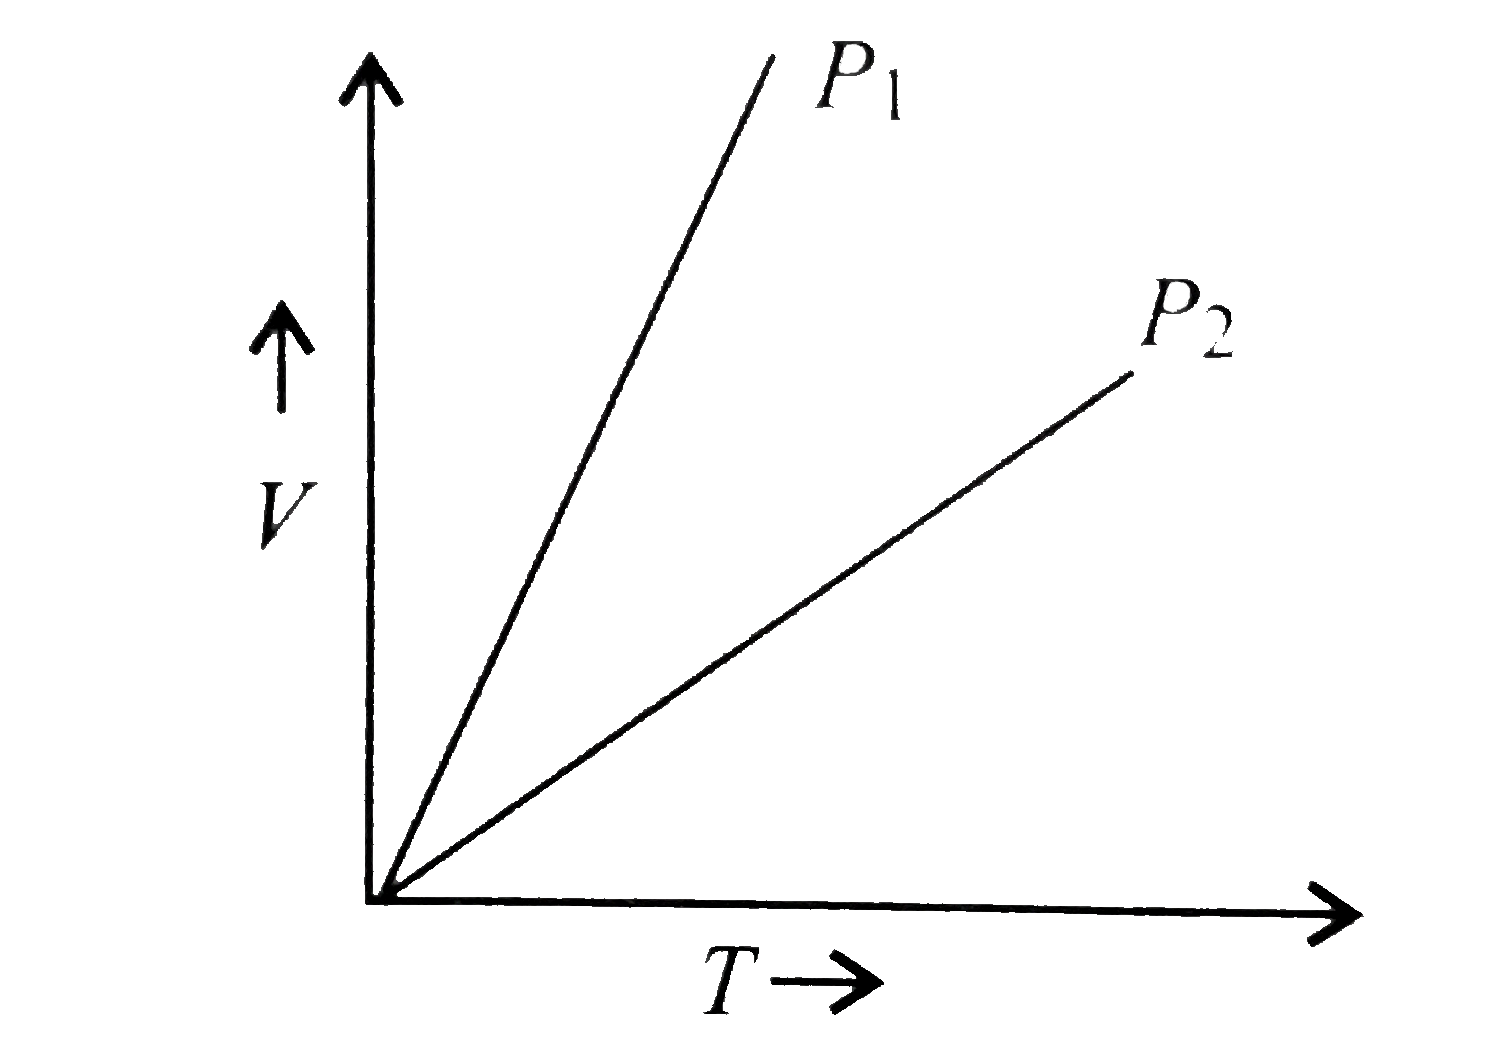
Which one of the following is correct?View SolutionWhen a sample of ideal gas is changed from an initial state to a final state, various curves can be plotted for the process like P-V curve, V-T curve,P-T curve etc.
For example, P-V curve for a fixed amount of an ideal gas at constant temperature is a rectangular hyperbola, V-T curve for a fixed amount of an ideal gas at constant volume is again a straight line. However, the shapes may vary if the constant parameters are also changed.
Now, answer the following questions :
Which of the following graphs is not possible for a fixed amount of ideal gas upon moving from initial state A to final state B :View Solution
Knowledge Check
- Question 1 - Select One
V vs T curves at constant pressure P1 and P2 for an ideal gas are shown below
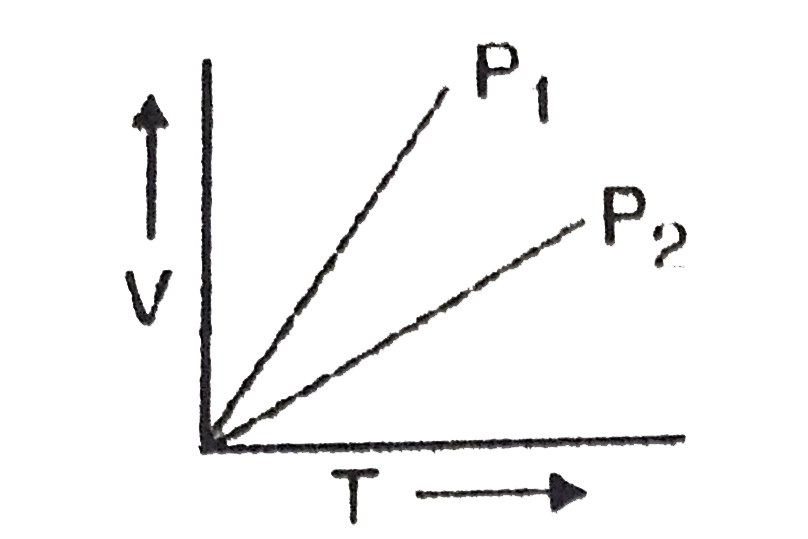
Which is correct ?AP1>P2BP1<P2CP1=P2DAll of the above - Question 2 - Select One
For V versus T curves at constant pressure P1andP2 for and ideal gas shown in figure-
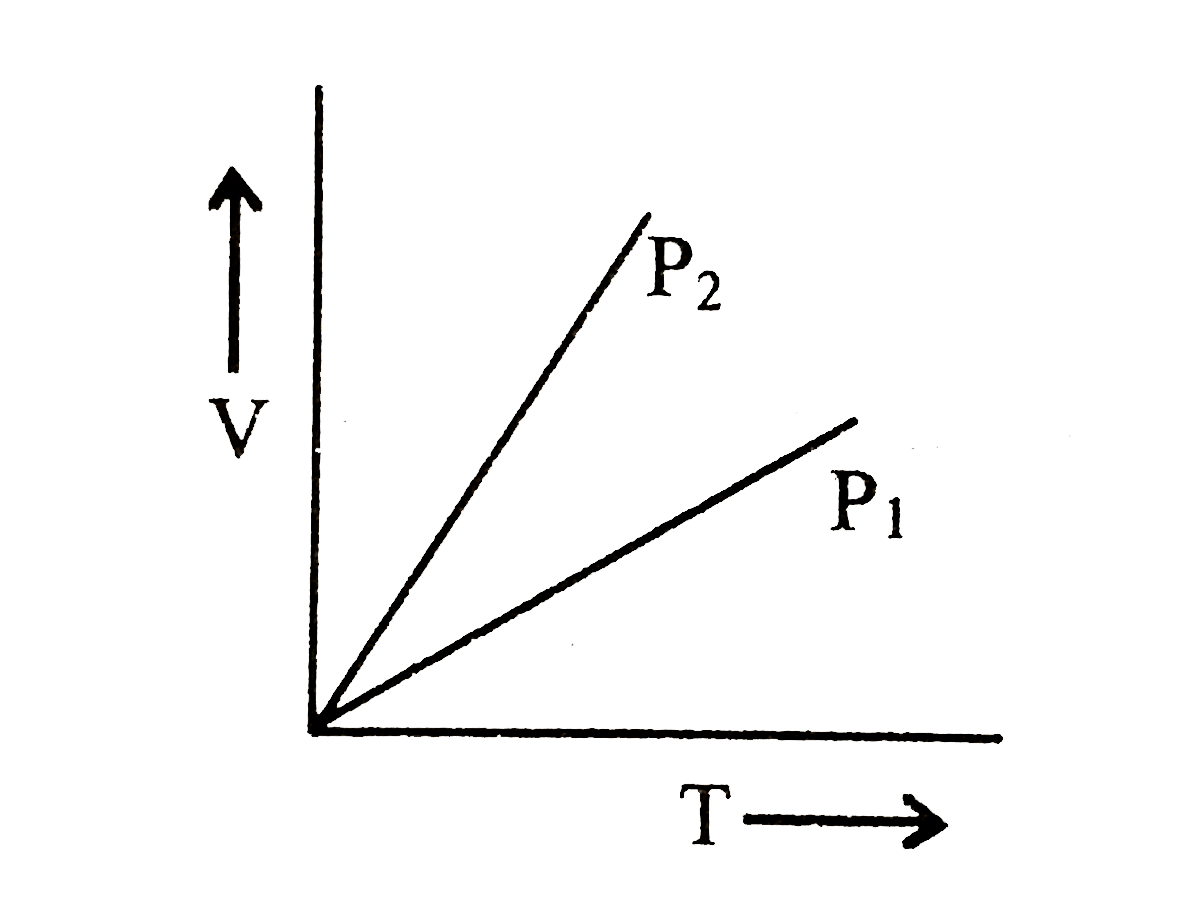 AP1>P2BP1<P2CP1=P2DP1P2
 - Question 3 - Select One
When a sample of ideal gas is changed from an initial state to a final state, various curves can be plotted for the process like P-V curve, V-T curve,P-T curve etc.
For example, P-V curve for a fixed amount of an ideal gas at constant temperature is a rectangular hyperbola, V-T curve for a fixed amount of an ideal gas at constant volume is again a straight line. However, the shapes may vary if the constant parameters are also changed.
Now, answer the following questions :
Which of the following statements is correct regarding a fixed amount of ideal gas undergoing the following process :
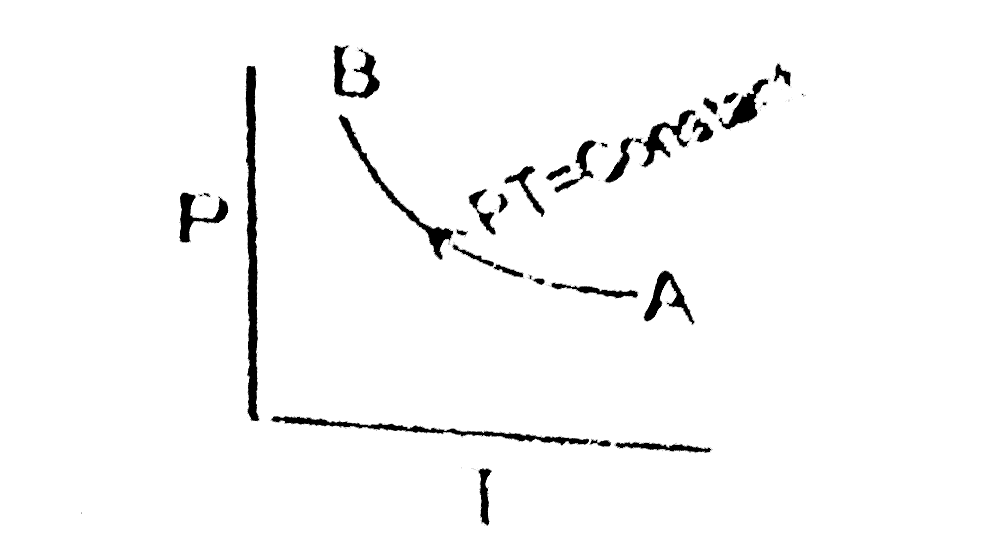 ARoot mean square (RMS) speed of gas molecules increase during the process A→BBDensity of the gas increases during the process A→BCSuch a graph is not possibleDIf PB=4PA then VA=4VB (where PA,VA,PB & VB represent pressure and volume values at states A and B).
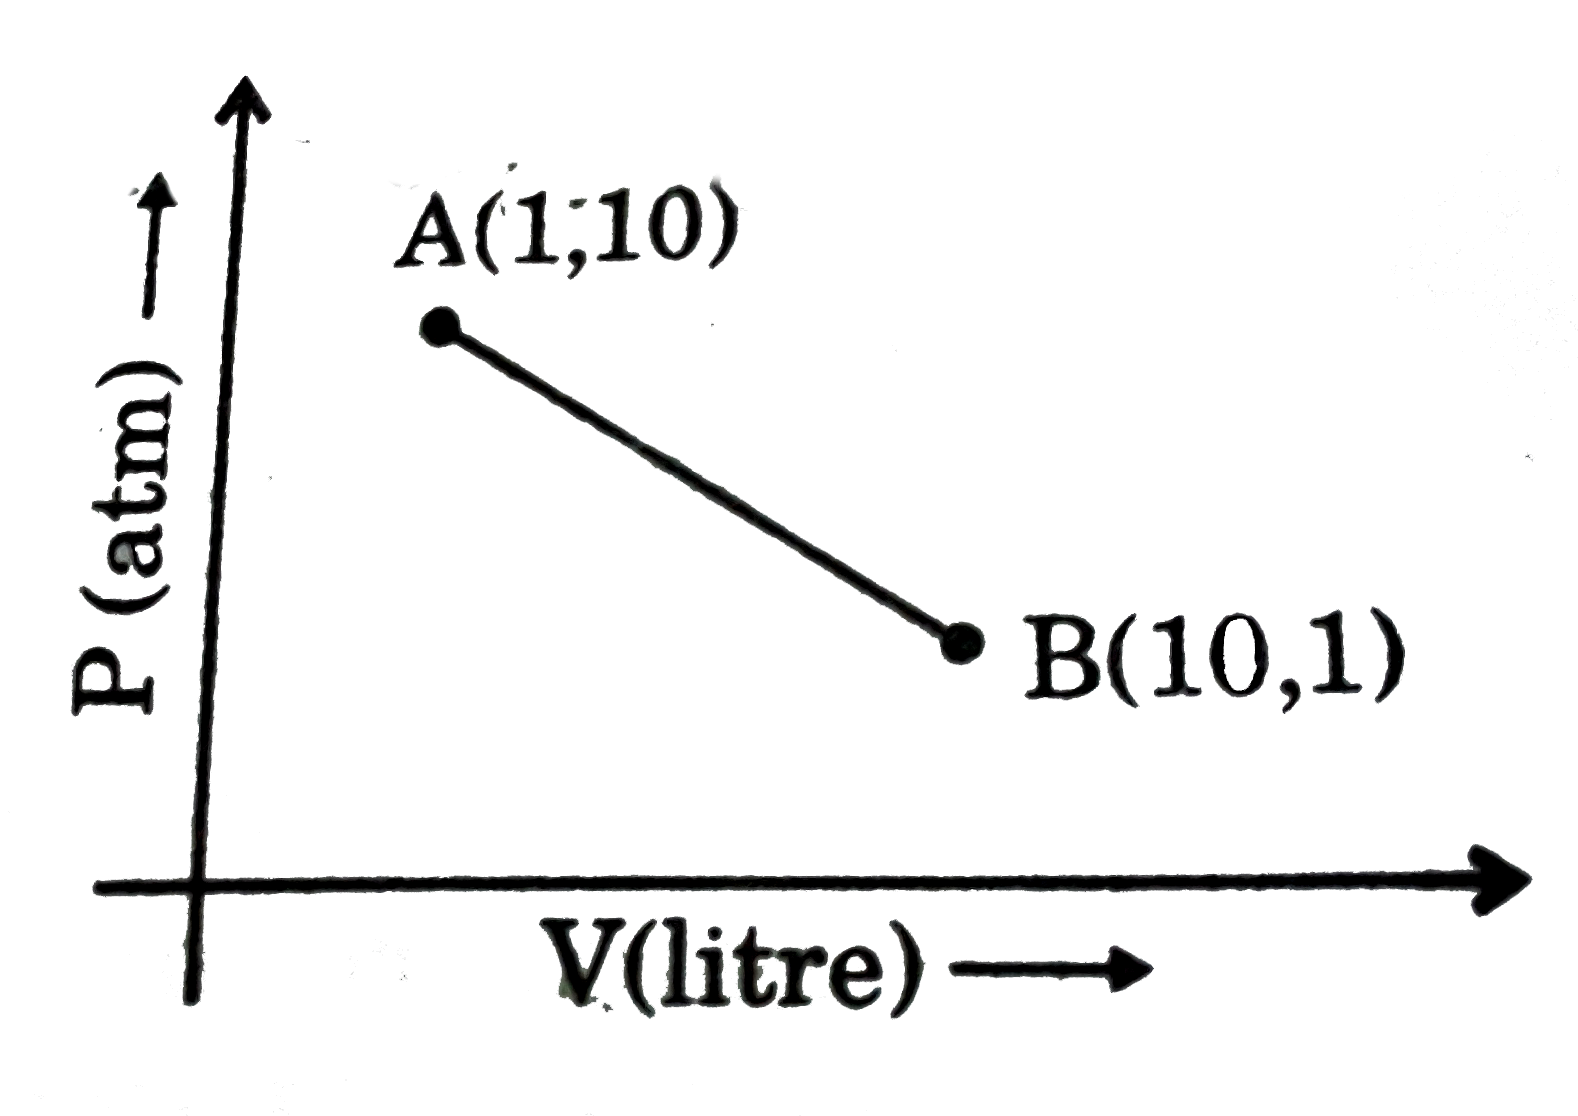
For 1 mole of an ideal gas, a graph of pressure vs volume is plotted as shown. Which of the following option is correct ?
 View Solution
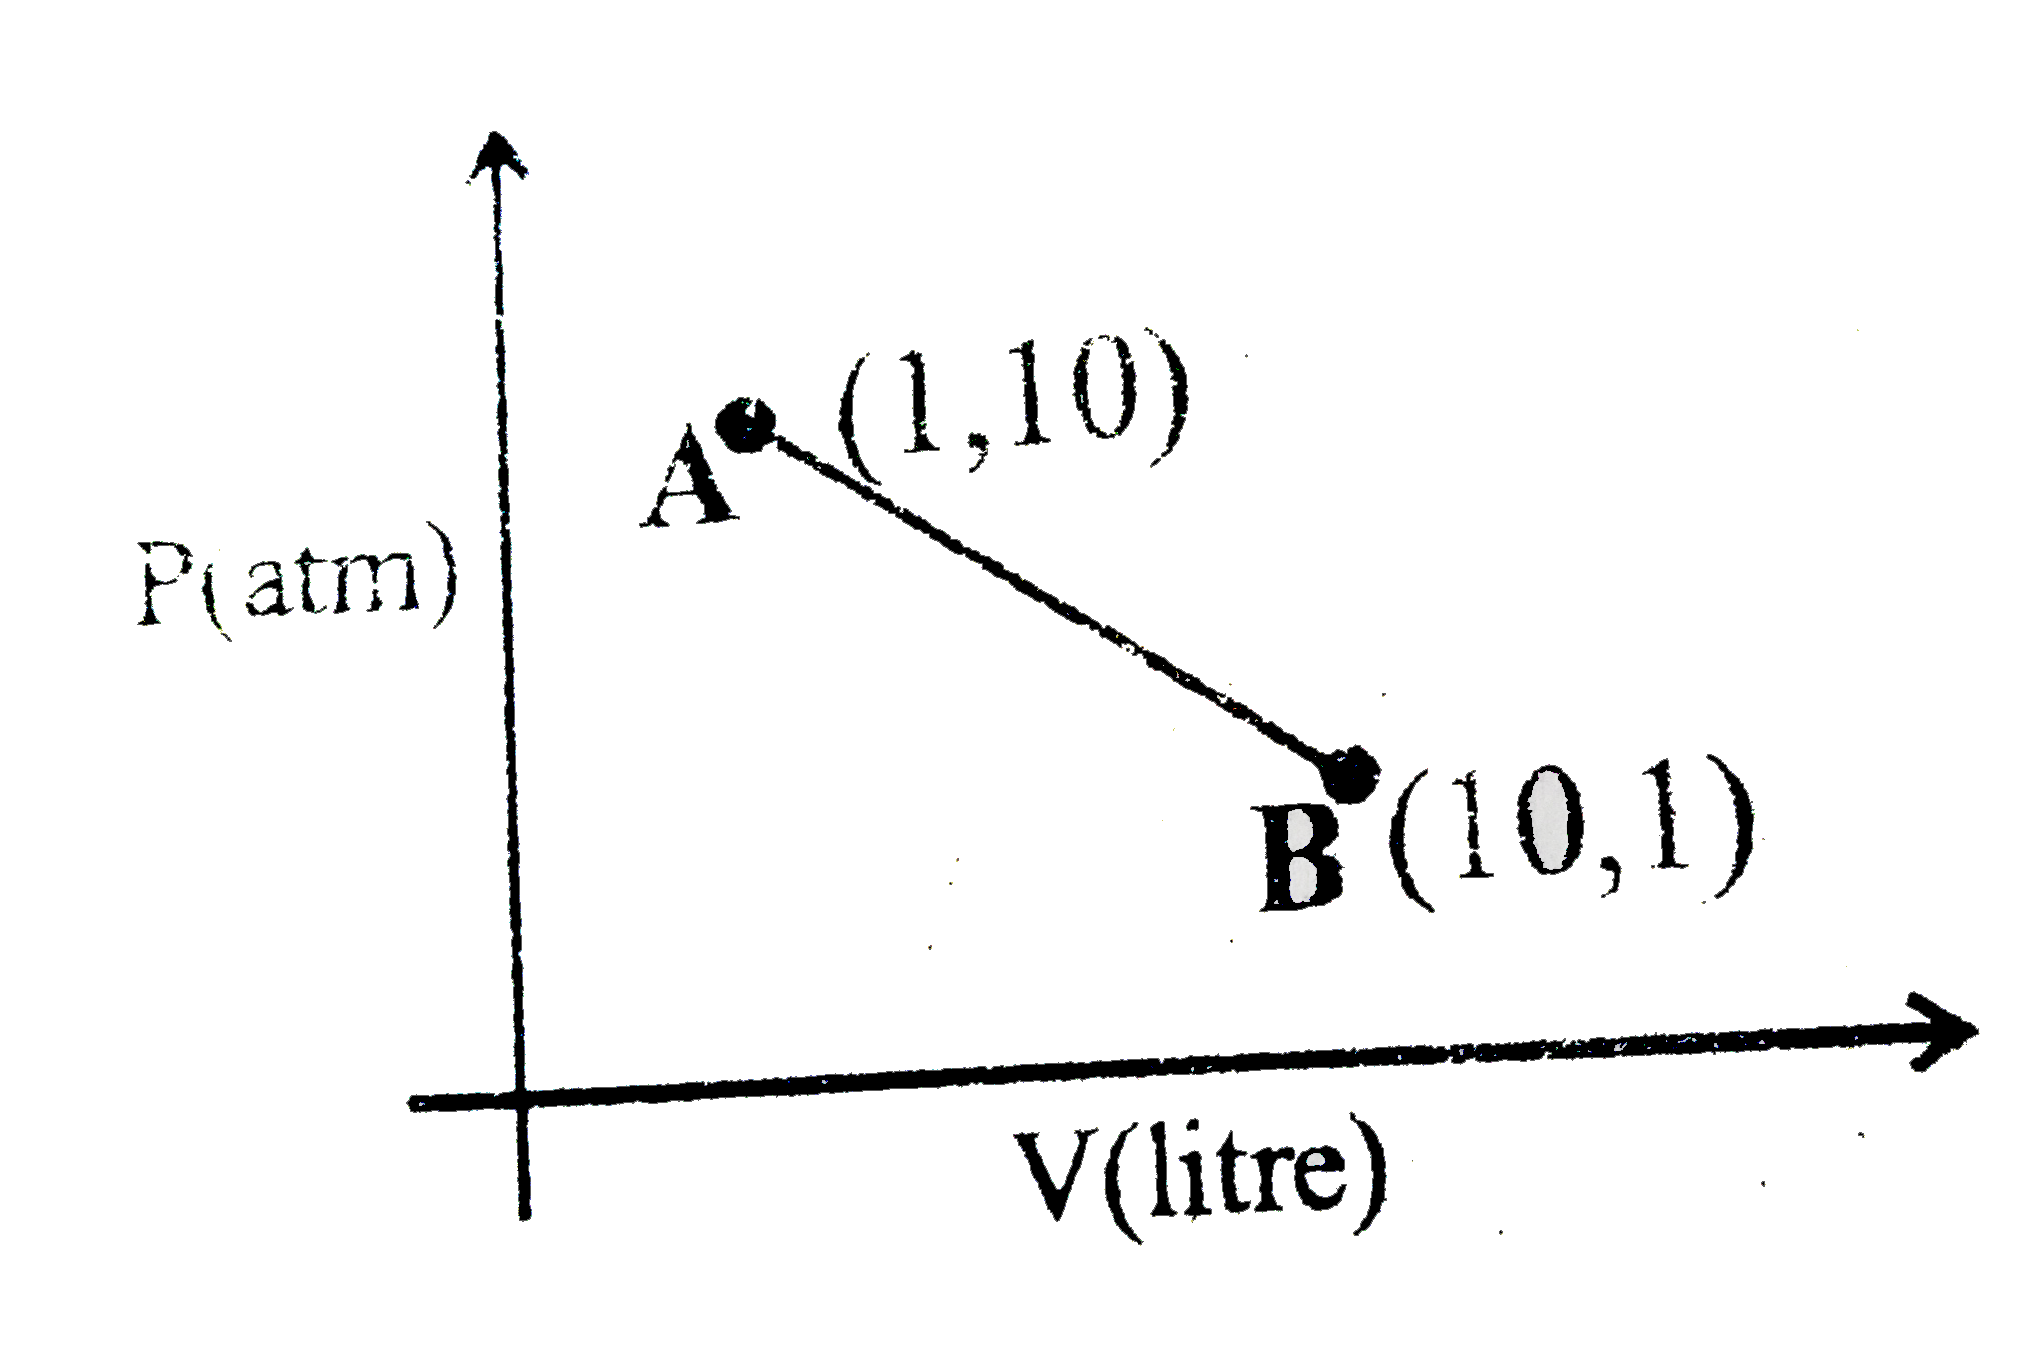
For 1 mole of an ideal gas, a graph of pressure vs volume is plotted as shown. Which of the following options is correct ?
 View Solution
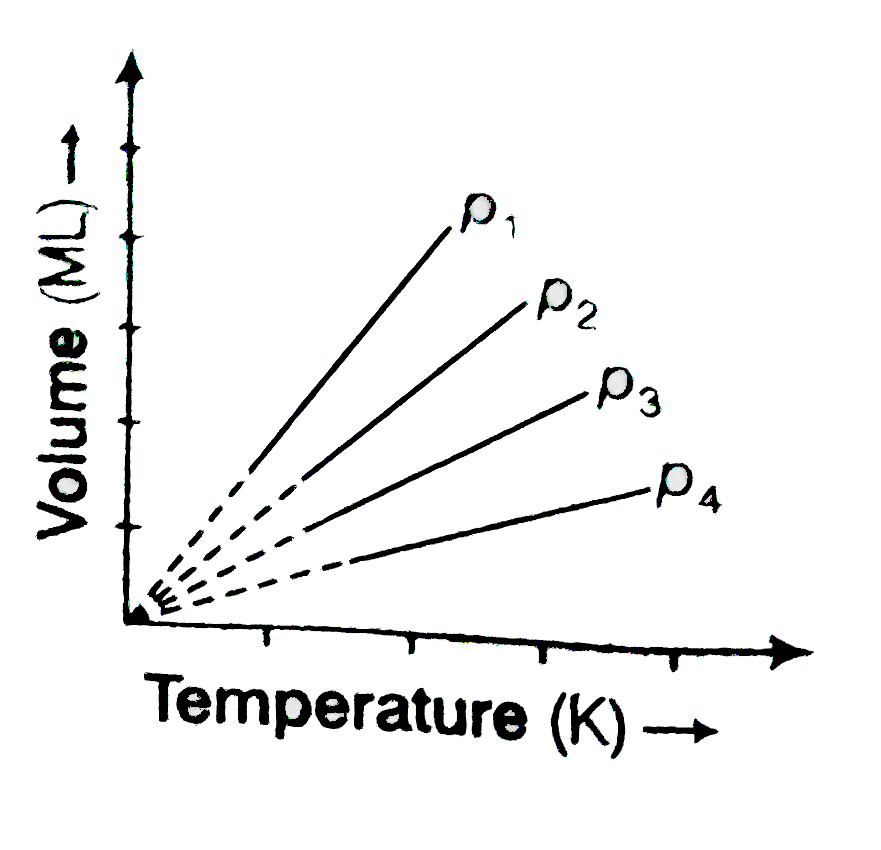
A plot of volume (V) versus temperature (T) for a gas at constant pressure is a straight line passing through the origin. The plots at different values of pressure are shown in figure. Which of the following order of pressure is correct for this gas ?
 View Solution
A plot of volume (V)versus temperature (T) for agas at constant pressure is a straight line passing through the origin the plots at different values of pressure are show in the figure which of the following order of pressure is correct for this gas?
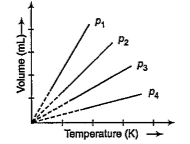 View Solution
The ideal gas equation for 1 mol of ideal gas is PV = nRT
graph between P and T at constant volume, i.e. isochores are plotted as under
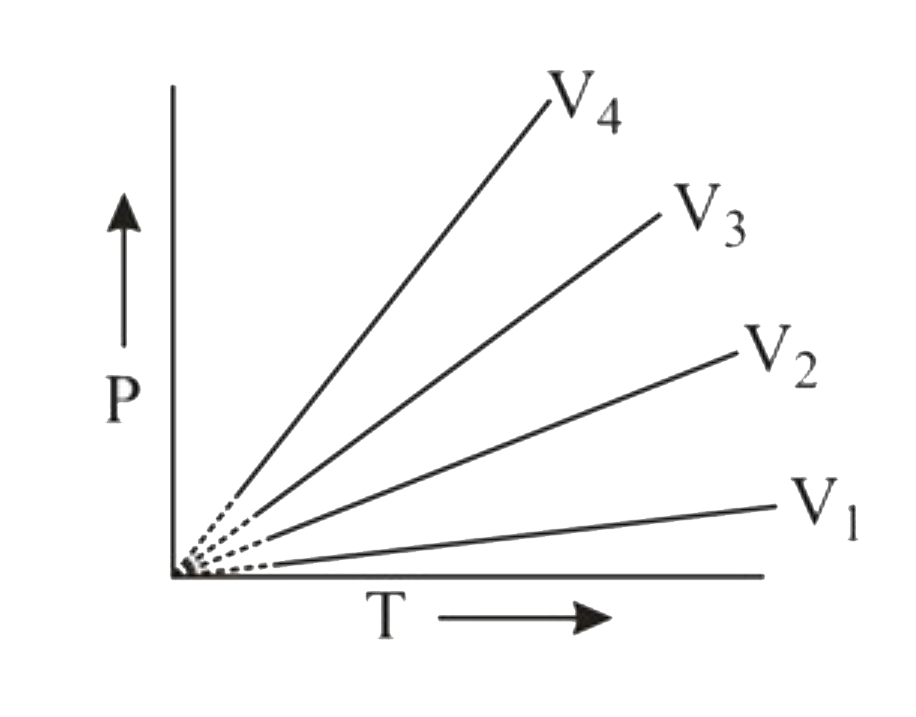
Which of the following order of volume is correct ?View Solution
