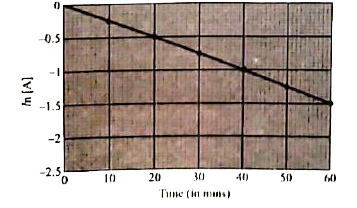
Describe the graphical representation of first order reaction.

A plot of ln(A) vs t for a first order reaction, A→ product with initial concentration of (A)=1.00 M and k=2.5×10⁻¹⁰min−1.
Text Solution
The concentration of the reactant A remaining at definite intervals is experimentally determined, and a plot of ln (A) vs t made. The plot is
|
Topper's Solved these Questions
- CHEMICAL KINETICS BOOK - PREMIERS PUBLISHERSCHAPTER - CHEMICAL KINETICS EXERCISE - OTHER IMPORTANT QUESTIONS & ANSWERS (I. Choose the correct answer.)
28 Videos
- CHEMICAL KINETICS BOOK - PREMIERS PUBLISHERSCHAPTER - CHEMICAL KINETICS EXERCISE - OTHER IMPORTANT QUESTIONS & ANSWERS (II. Answer the following questions.)
52 Videos
- CHEMICAL KINETICS BOOK - PREMIERS PUBLISHERSCHAPTER - CHEMICAL KINETICS EXERCISE - EVALUATION ( TEXTBOOK QUESTIONS & ANSWERS ) ( I. Choose the correct answer.)
23 Videos
- CARBONYL COMPOUNDS AND CARBOXYLIC ACIDSBOOK - PREMIERS PUBLISHERSCHAPTER - CARBONYL COMPOUNDS AND CARBOXYLIC ACIDSEXERCISE - OTHER IMORTENT QUESTIONS & ANSWERS (ANSWER THE FOLLOWING QUESTIONS)
88 Videos
- CHEMISTRY IN EVERYDAY LIFEBOOK - PREMIERS PUBLISHERSCHAPTER - CHEMISTRY IN EVERYDAY LIFEEXERCISE - OTHER IMPORTANT QUESTIONS& ANSWERS (ANSWER THE FOLLOWING QUESTIONS)
63 Videos
Similar Questions
Knowledge Check
For a first order reaction, the plot of log[A]tvs t is linear with a
Apositive slope and zero interceptBpositive slope and non zero interceptCnegative slope and zero interceptDnegative slope and non zero interceptThe slope in the plot of ln[R] vs. time gives in first order reaction
A+kB+k2.303C−kD−k2.303For a first order reaction, the plot of log k against 1/T is a straight line. The slope of the line is equal to
AEaRB2.303Ea×RCEa2.303D−Ea2.303R
In a first-order reaction A→B, if K is the rate constant and initial concentration of the reactant is 0.5M, then half-life is
View SolutionThe rate constant of a first order reaction is 3×10⁻⁶ per second. If the initial concentration is 0.10M, the initial rate of reaction is
View SolutionThe rate constant of a first order reaction is 3×10⁻⁶ per second. If the initial concentration is 0.10M, the initial rate of reaction is
View SolutionThe rate constant of a first order reaction is 3×10⁻⁶ per second. If the initial concentration is 0.10M, the initial rate of reaction is
View SolutionThe rate constant of a first-order reaction is 3×10⁻⁶ per second. If the initial concentration is 0.10m, the initial rate of reaction is
View Solution
