Explain graphical representations of the first order reaction.
Text Solution
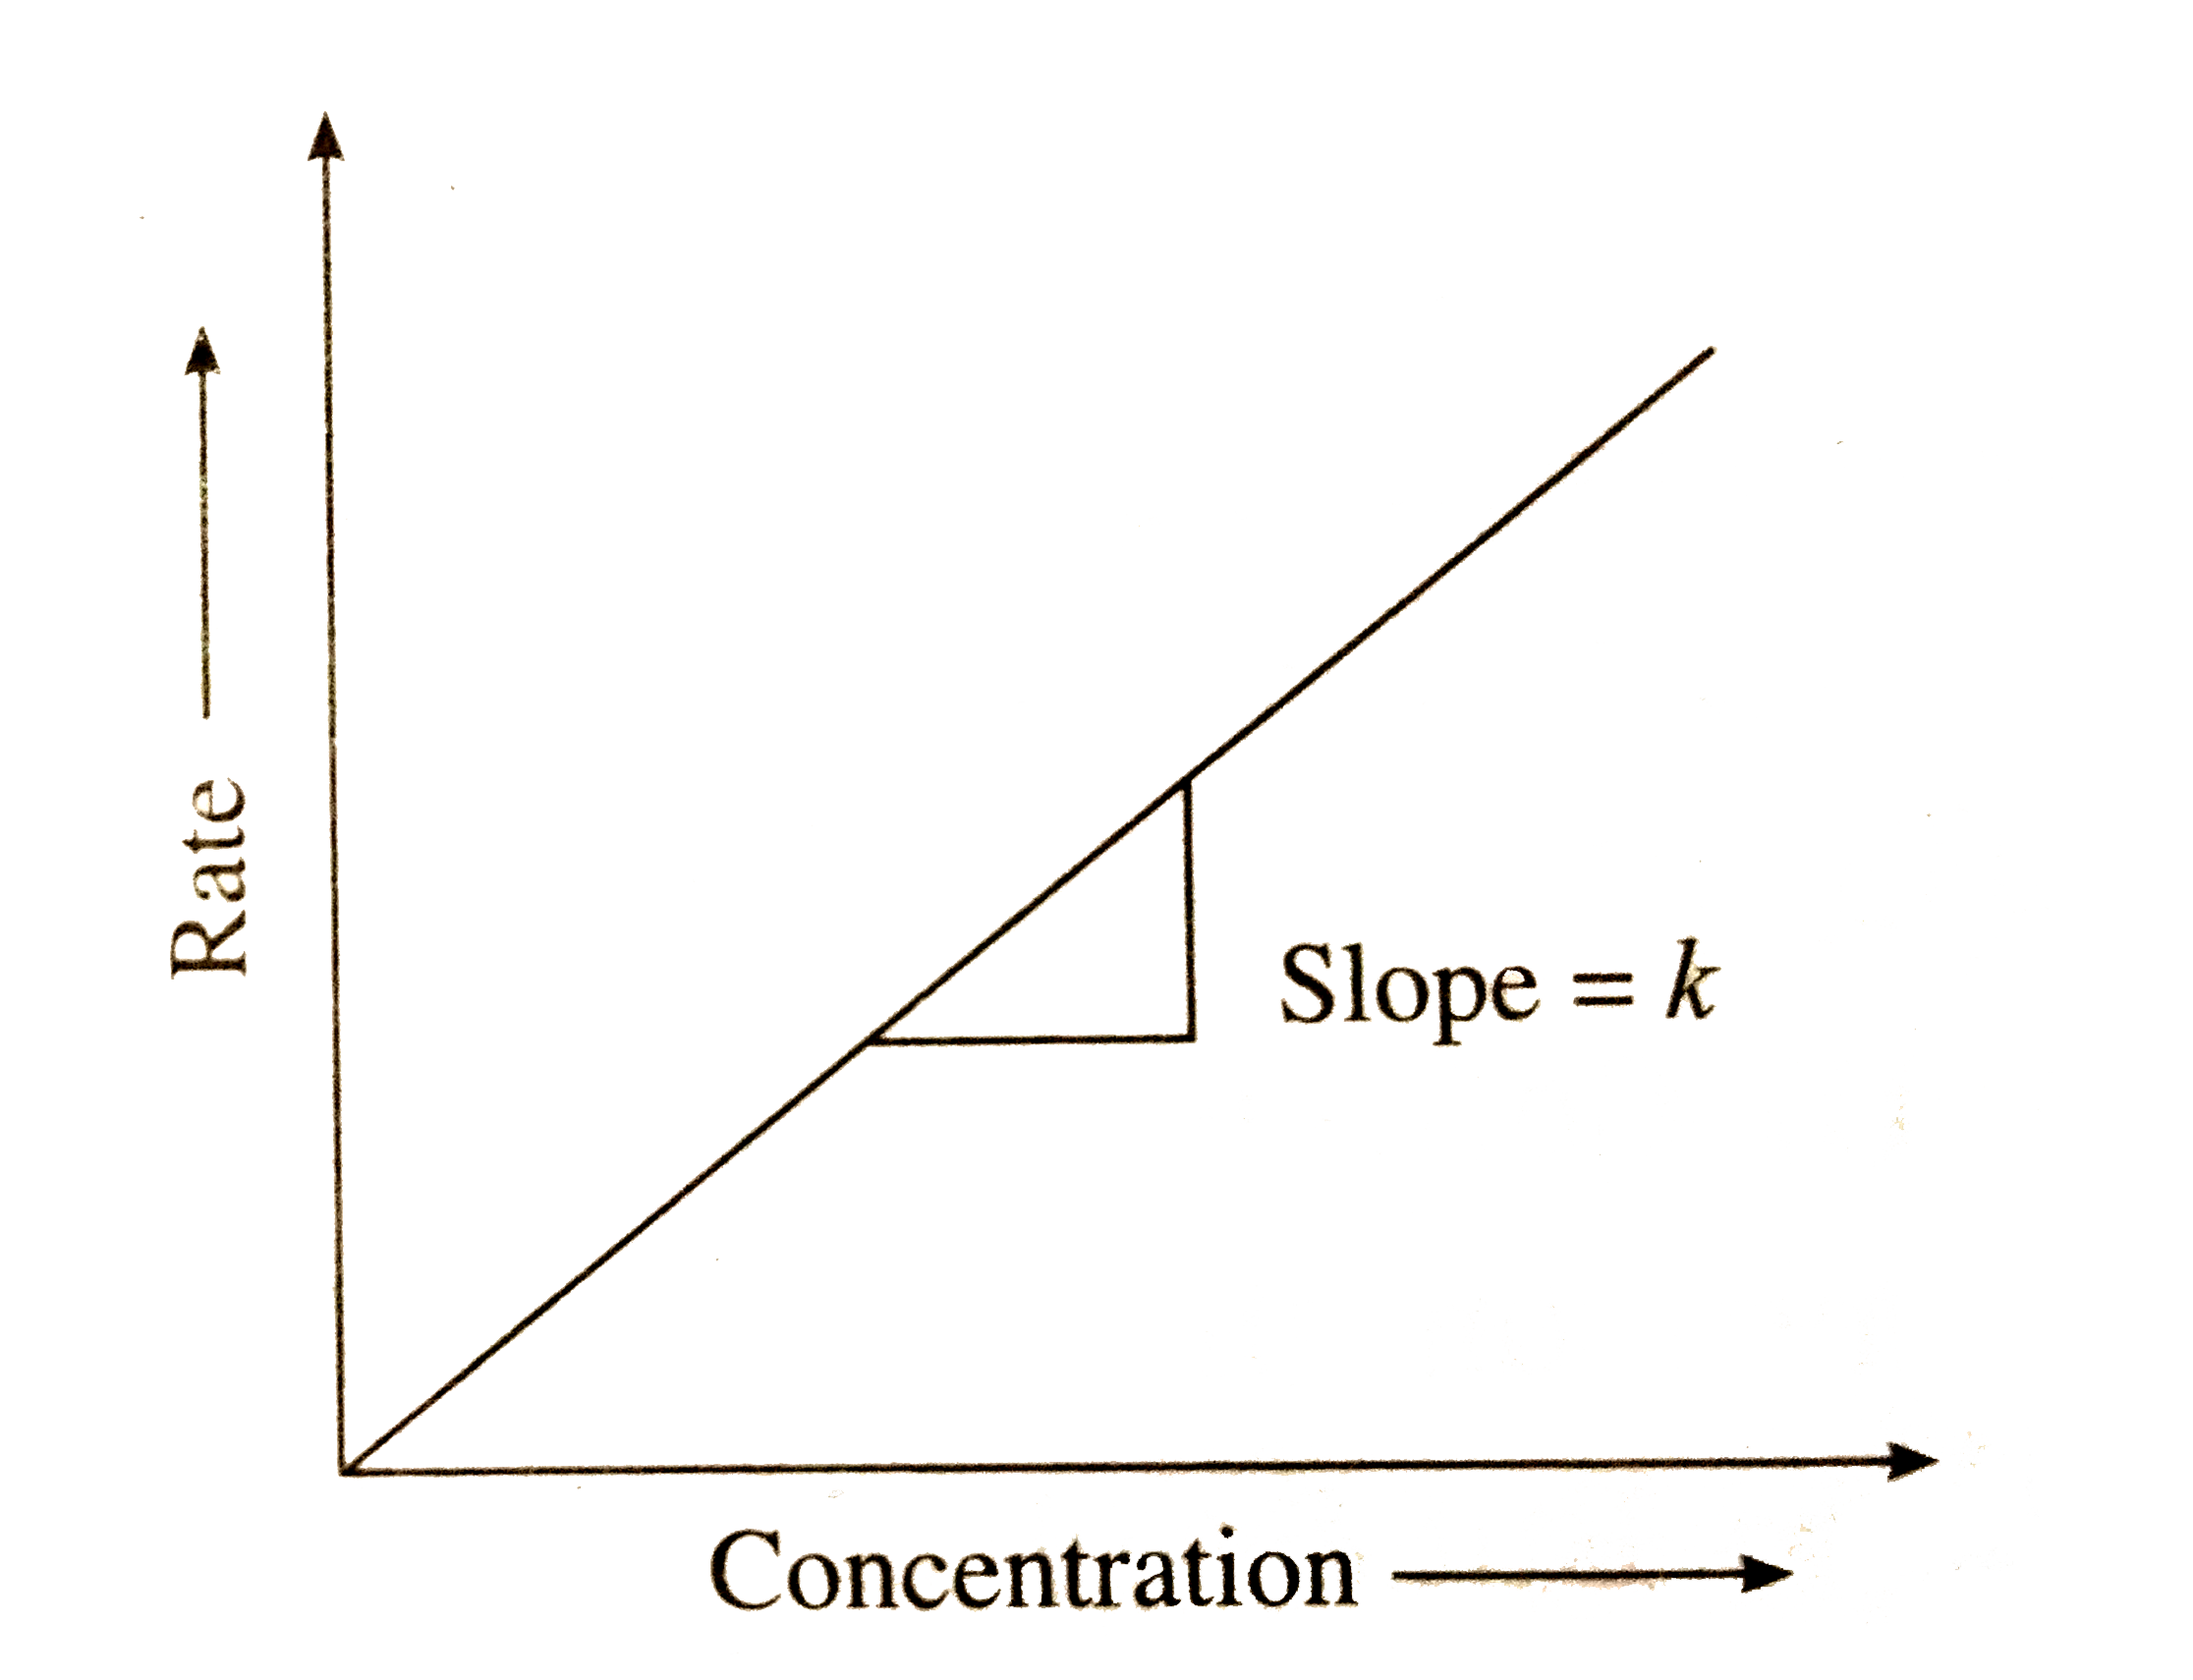
(1) A graph of rate of a reaction and concentration : The differential rate law for first order reaction, A→ Products is represented as,
Rate=−d[A]dt=k[A]
∴ Rate =k×[A]t (y=mx)
when the rate of a first order reaction is plotted against concentration, [A]t , a straight line graph is obtained.
With the increase in the concentration [A]t, rate R, increases. The slope of the line gives the value of rate constant k.
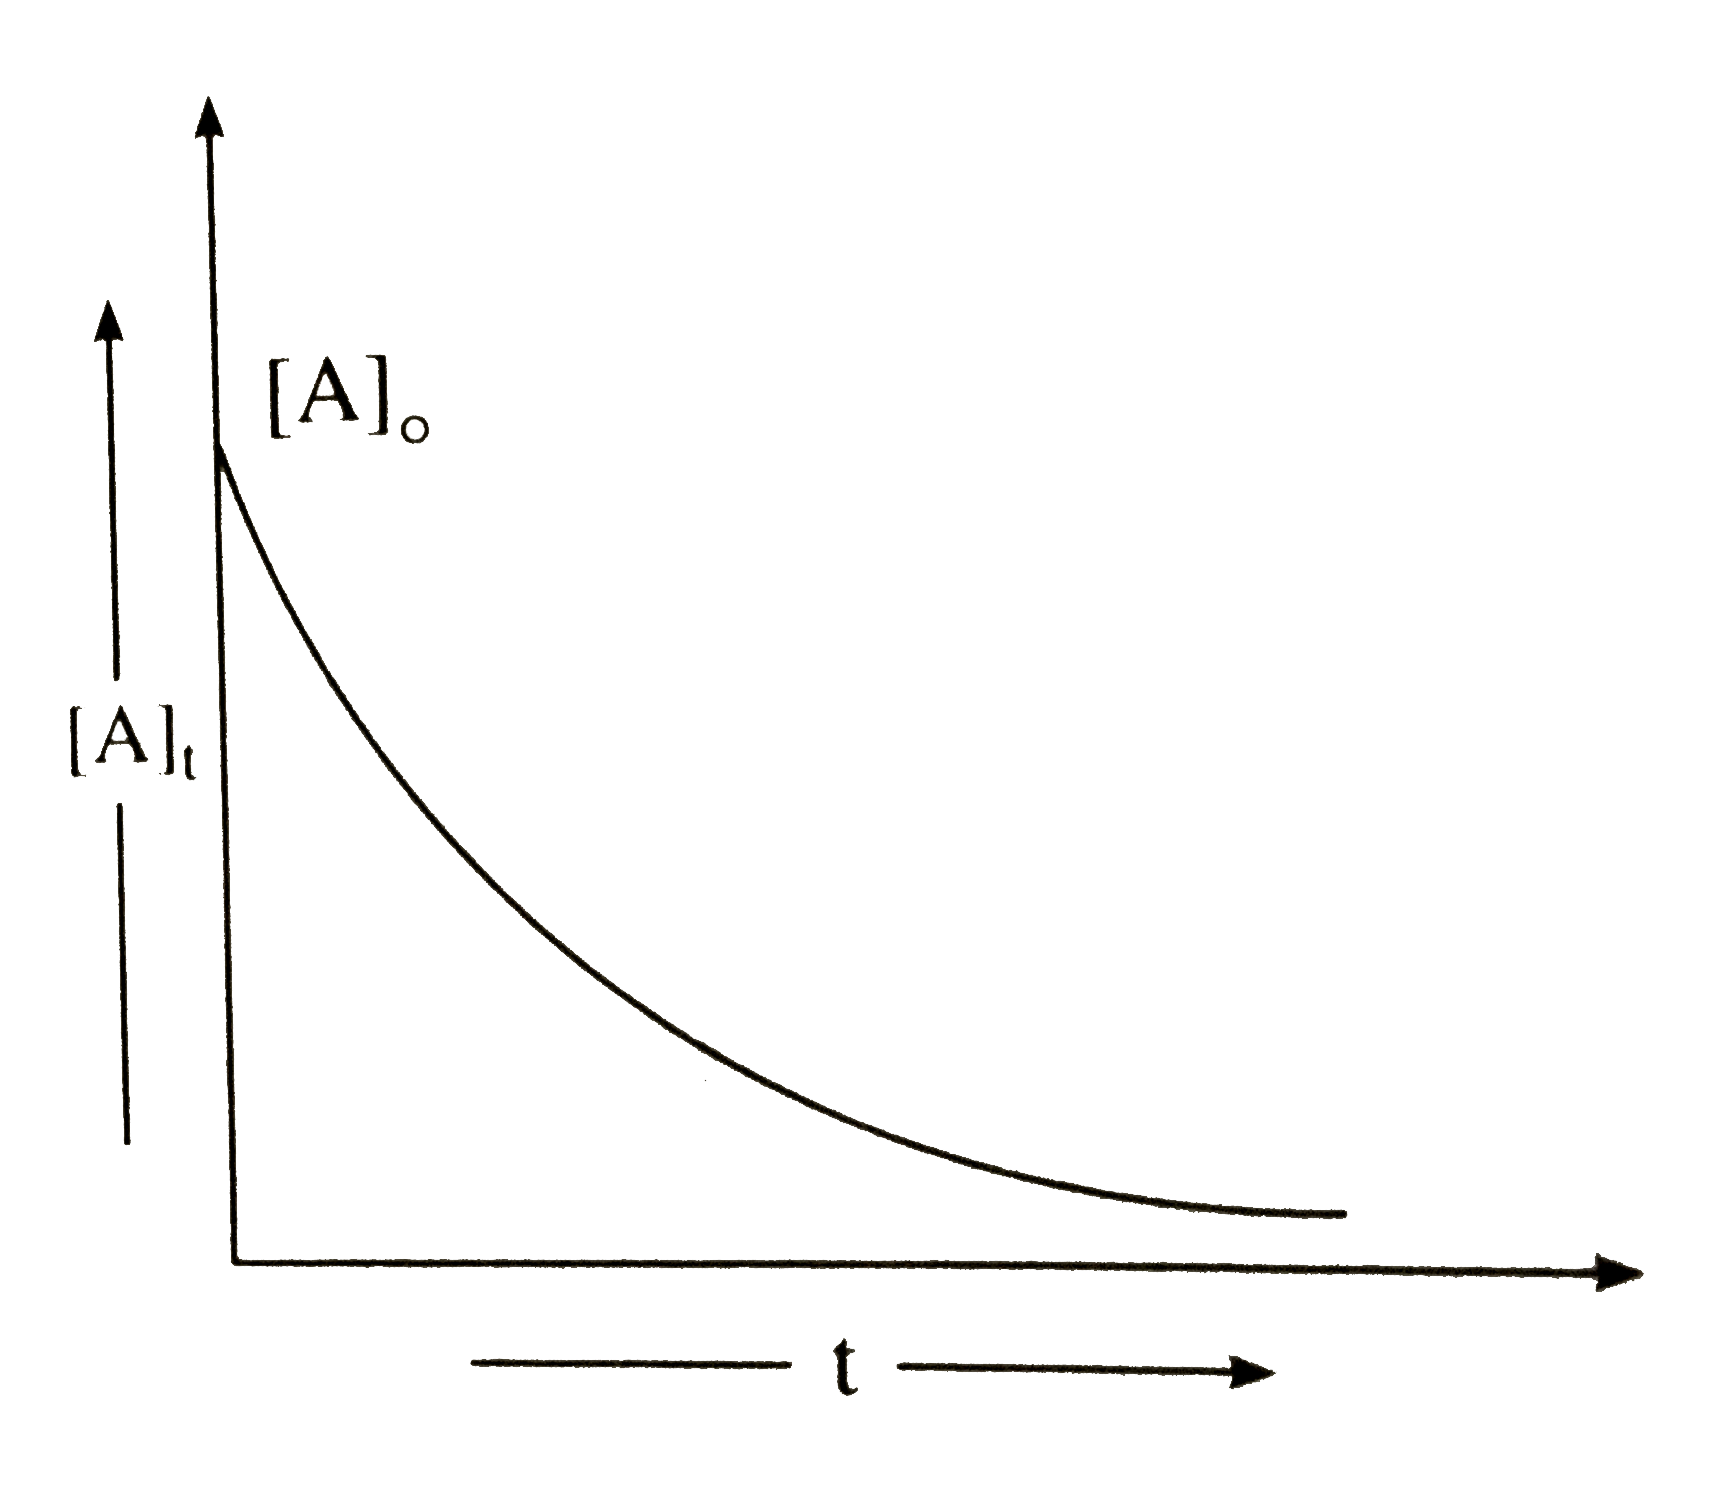
(2) A graph of concentration against time : When the concentration of the reactant is plotted against time t, a curve is obtained. The concentration [A]t of the reactant decreases exponentially with time. The variation in the concentration can be represented as,[A]t=[A]0e−kt
where [A], and [A] are initial and final concentrations the reactant and k is the rate constant. The time required to complete the first order reaction is infinity.
(3) A graph of half-life period and concentration :
The half -life period t1/2 of a first order reaction is given by t1/2=0.693k
where k is the rate constant .
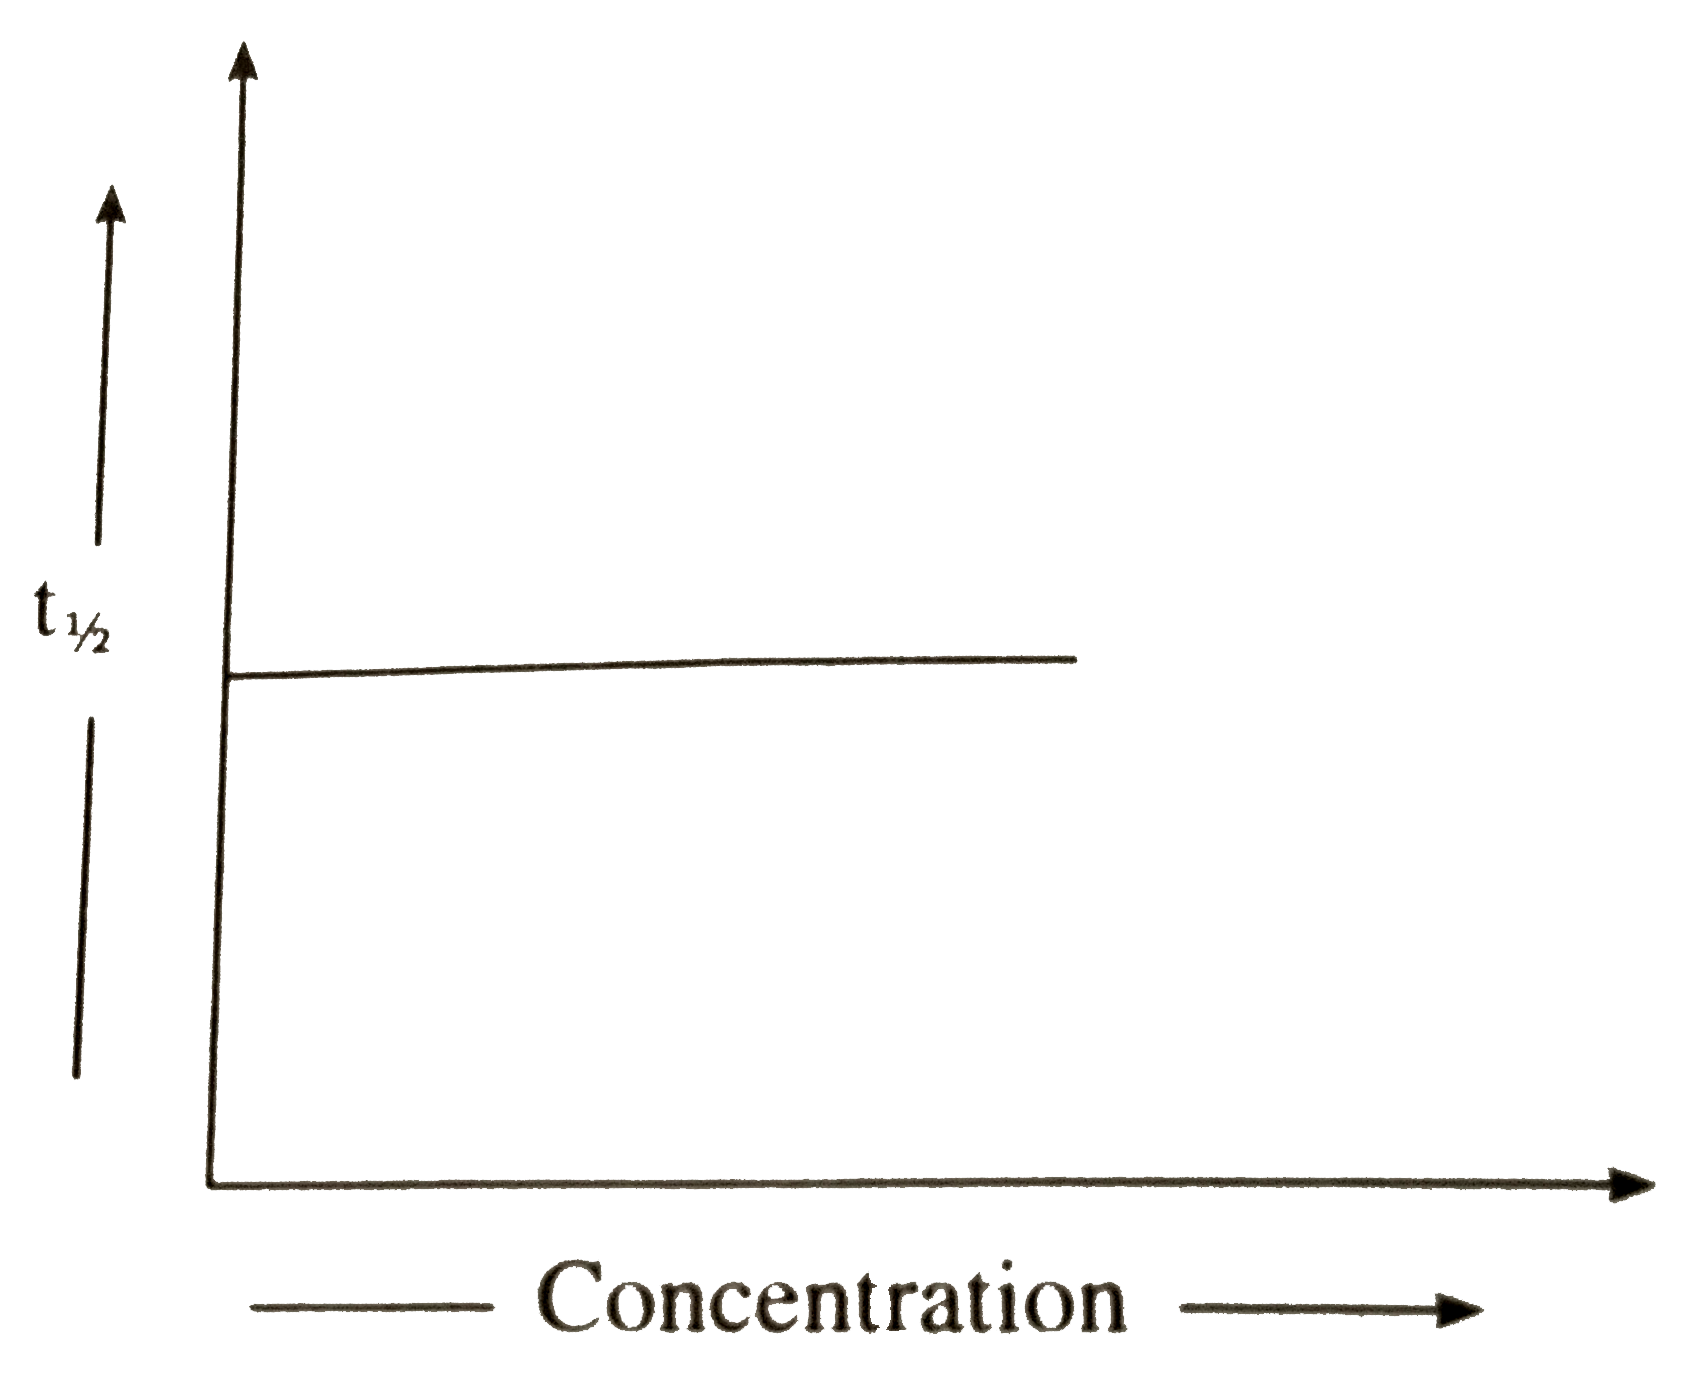
For the given reaction at constant temperature , t1/2 is constant adn independent of the concentration of the reactant.
Hence when a graph of t1/2 is plotted against concentration, a stringht line parallel to the concentration axis (slope = zero) is obtained.
|
Similar Questions
Knowledge Check
Which is not the graphical representation for the zeroth order reaction ?
A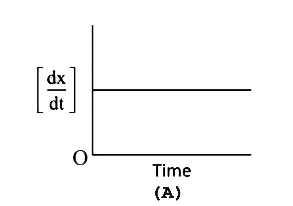 B
B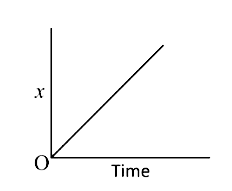 C
C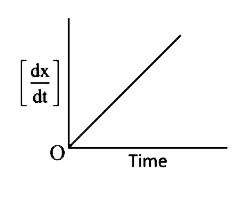 D
D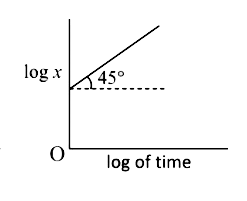
In the following graphical representation for the reaction A→B there are two types of regions :
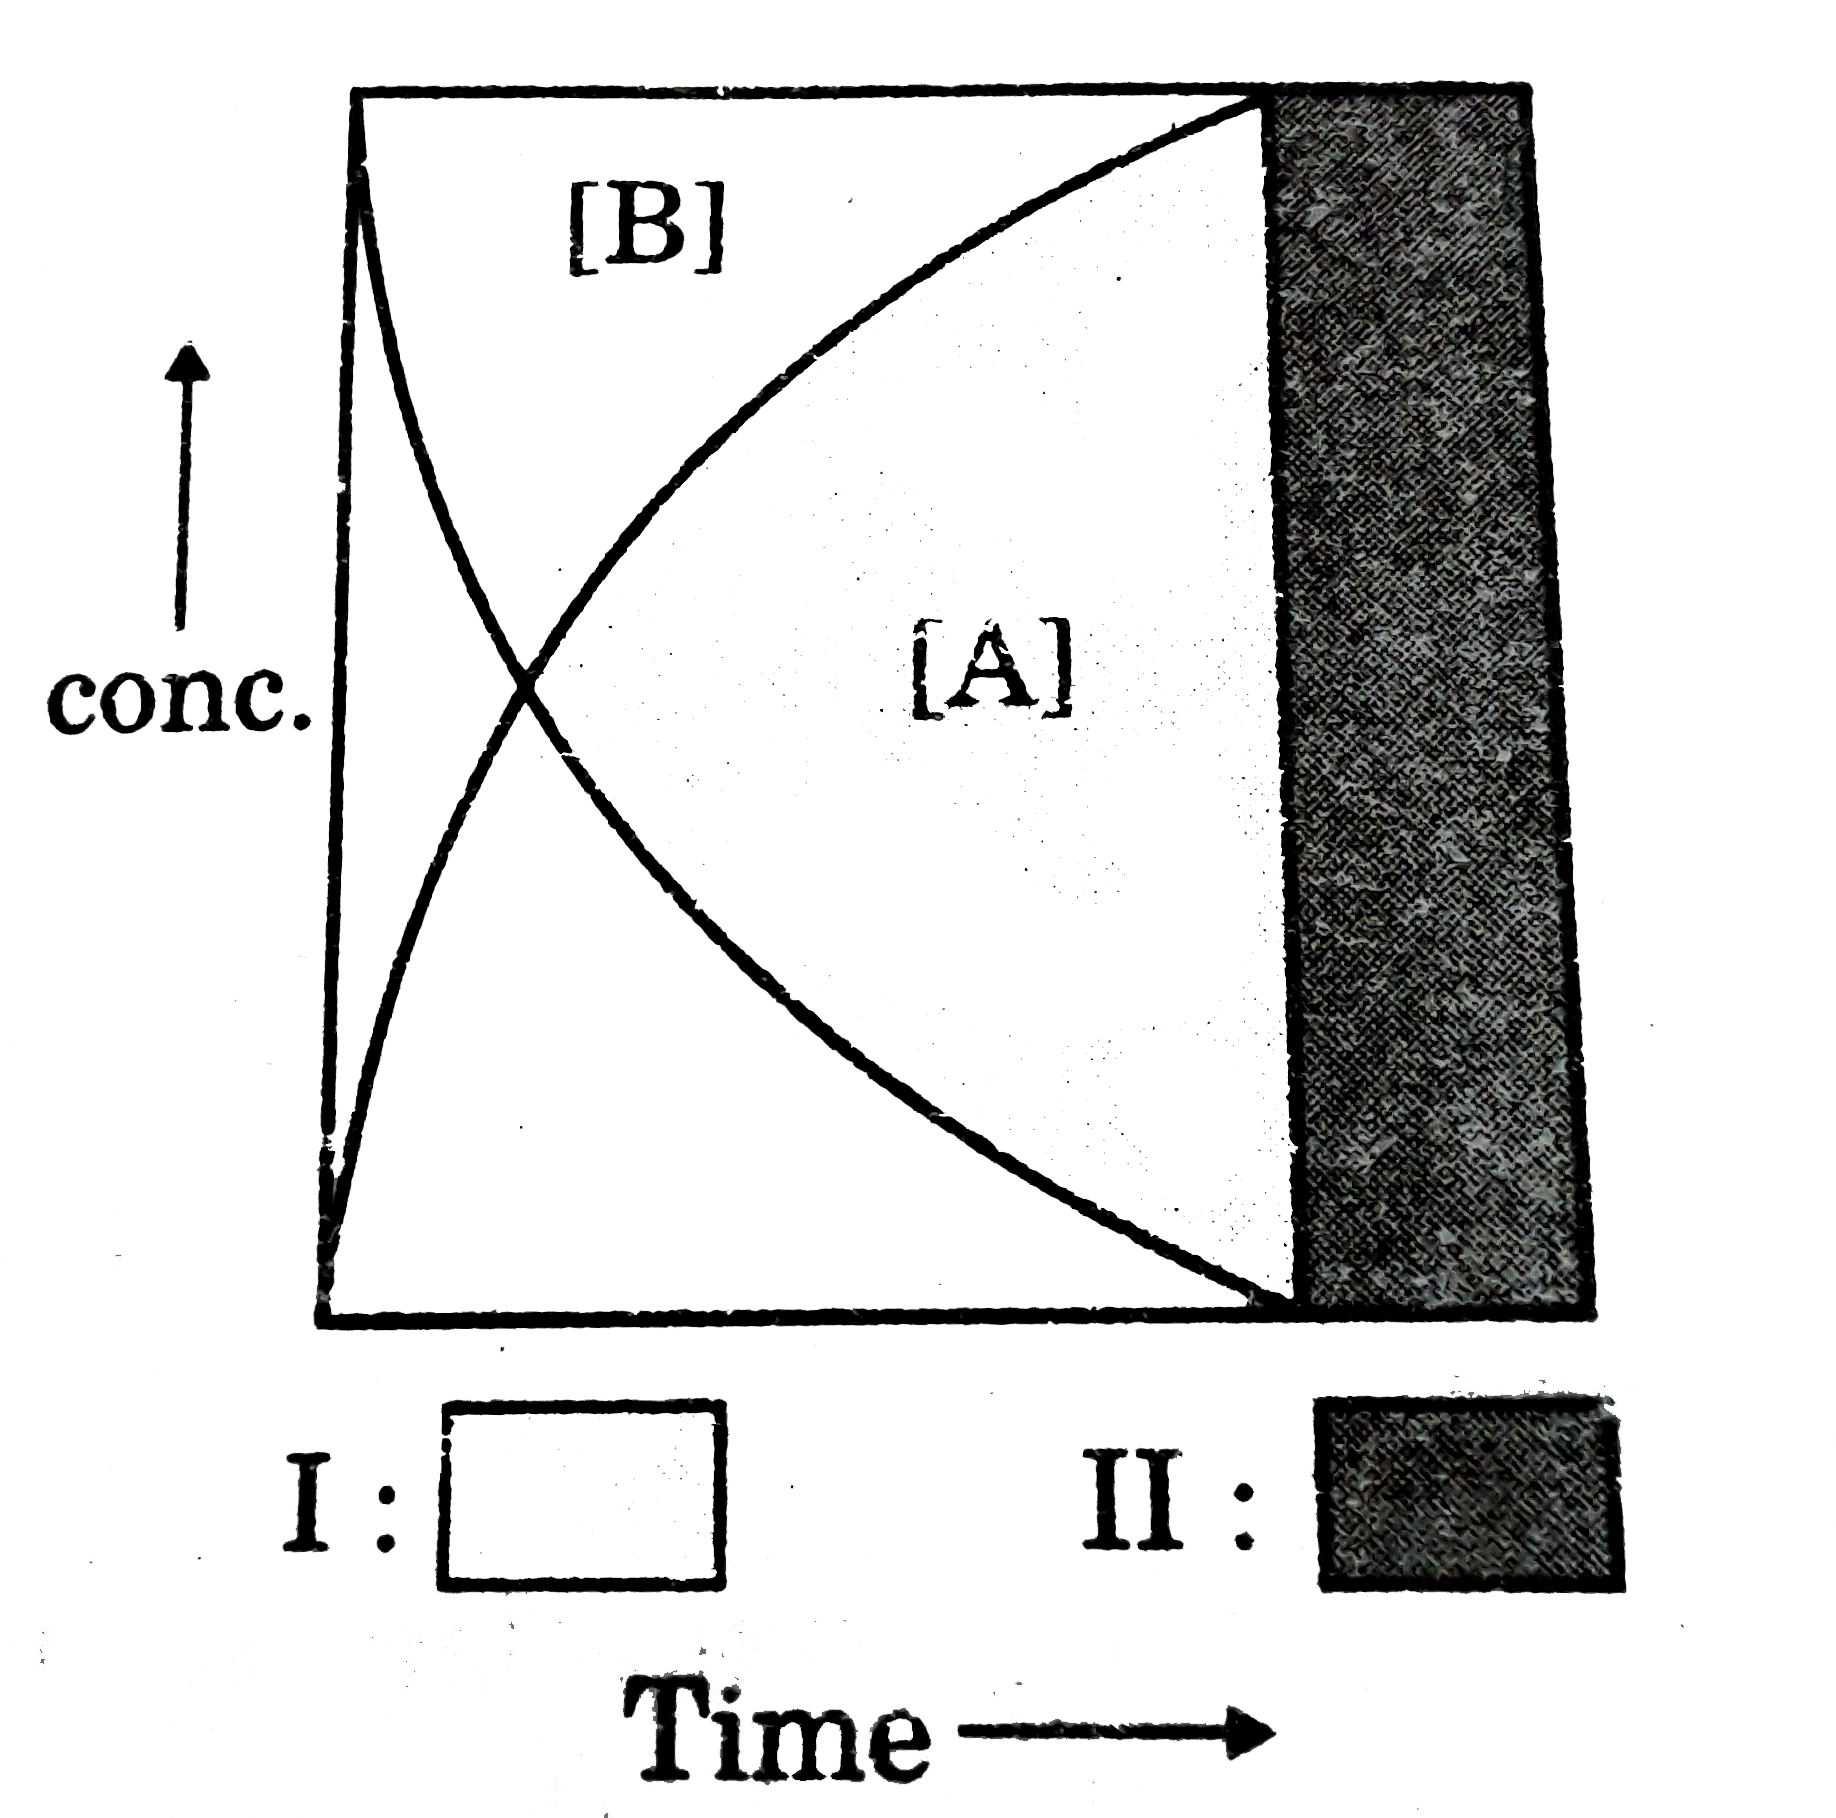 AI and II both represents kinetic region at different intervalBI and II both represents equilibrium regions at different time intervalCI represents kinetic while II represents equilibrium regionDI represents equilibrium while II represents kinetic regions
Graphical Representation For Motion
View SolutionGraphical representation of raoults law
View SolutionThis graphical representation specifics

View SolutionGraphical representation of cartesian product
View SolutionSecond Order Reaction and its characteristics | Graphical representation of Second order reaction | Pseudo First Order Reaction
View SolutionGraphical representation of zero and first order of kinetics| first order kinetics| life time of 1st order kinetics| kinetic of nth order reaction
View Solution
