Dheya takes some ice and water in a beaker and heat it on a low flame. She notes the temperature from time to time. Which of the following graphs shows the correct result.
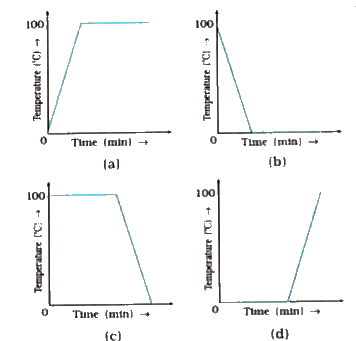
a
b
c
d
The correct Answer is:A, C, D
Topper's Solved these Questions
- MATTER IN OUR SURROUNDINGSBOOK - KUMAR PRAKASHANCHAPTER - MATTER IN OUR SURROUNDINGSEXERCISE - QUESTIONS AND ANSWERS (FILL IN THE BLANKS:)
11 Videos
- MATTER IN OUR SURROUNDINGSBOOK - KUMAR PRAKASHANCHAPTER - MATTER IN OUR SURROUNDINGSEXERCISE - QUESTIONS AND ANSWERS (FILL IN THE BLANKS BY SELECTING THE CORRECT ALTERNATIVE FROM THOSE GIVEN IN THE BRACKET:)
10 Videos
- MATTER IN OUR SURROUNDINGSBOOK - KUMAR PRAKASHANCHAPTER - MATTER IN OUR SURROUNDINGSEXERCISE - QUESTIONS AND ANSWERS (GIVE DEFINITION OF THE FOLLOWING:)
12 Videos
- IS MATTER AROUND US PUREBOOK - KUMAR PRAKASHANCHAPTER - IS MATTER AROUND US PUREEXERCISE - QUESTIONS BASED ON PRACTICAL SKILLS WITH ANSWERS (ANSWER THE FOLLOWING AS ASKED)
8 Videos
- QUESTION PAPER 01BOOK - KUMAR PRAKASHANCHAPTER - QUESTION PAPER 01EXERCISE - SECTION - A
1 Videos
Similar Questions
A student heats a beaker containing ice and water. He measures the temperature of the content of the beaker as a function of lime. Which of the following would correctly represent the result ? Justify your choice .

View SolutionA student heats a beaker containing ice and water. He measures the temperature of the content of the beaker as a function of lime. Which of the following would correctly represent the result ? Justify your choice .

View Solution
Knowledge Check
When water in a beaker freezes to form ice, then which of the following will be correct statement:
ASsystemdecreases whereasSsurroundingincreasesBSsystemandSsurrounding both increasesCSsystemincreases whereas Ssurrounding decreasesDSsystemandSsurrounding both increasesFigure shows the acceleration-time graphs of a particle. Which of the following represents the corresponding velocity -time graph?
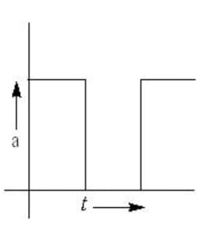 A
A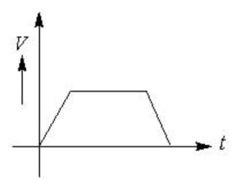 B
B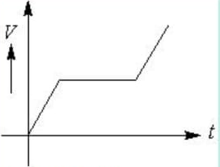 C
C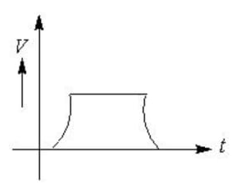 D
D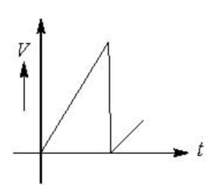
A piece of ice is heated and the temperature is monitored as a function of time .Which of the following figures will justify the observation ?
A B
B C
C D
D
A student heats a beaker containing ice and water. He measures the temperature of the content of the beaker as a function of lime. Which of the following would correctly represent the result ? Justify your choice .

View SolutionThe graph between the current and the time for an inductance coil is shown below. Which of the following graph show the voltage-time variation-
View Solution100 g of ice at −15∘C was heated. The rise in temperature of ice was plotted against the heat given to ice. Which of the following graphs (Fig. 6.2) correctly depicts this behaviour?
View SolutionAs part of an experiment to determine the latent heat of vaporisation of water, a student boils some water in a beaker using an electric heater as shown below. The student notes two sources of error.
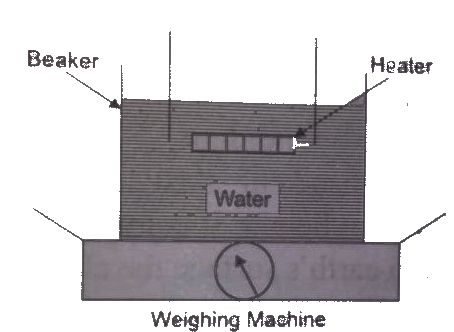
Error-1: thermal energy is lost from the sides of the beaker
Error -2: As the water is boling water splashes out of the beaker
Which of the following gives the correct effect of these two errors on the calculated value for the specific lalent heat?
View SolutionThe graph between the current and the time for an inductance coil is shown below. Which of the following graph show the voltage-time variation-

View Solution
