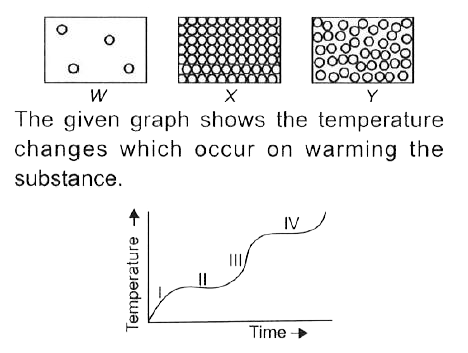
Diagrams W,X and Y show how the particles of a substance are packed at different temperatures.

In which region of the graph would all the particles be packed as in Y ?
I
II
III
IV
The correct Answer is:C
Step by step video & image solution for Diagrams W, X and Y show how the particles of a substance are packed at different temperatures.In which region of the graph would all the particles be packed as in Y ? by Chemistry experts to help you in doubts & scoring excellent marks in Class 9 exams.
Topper's Solved these Questions
- BOOK - SCIENCE OLYMPIAD FOUNDATION CHAPTER - MATTER IN OUR SURROUNDINGSEXERCISE - ARCHIEVERS SECTION (HOTS)5videos
MATTER IN OUR SURROUNDINGS
- BOOK - SCIENCE OLYMPIAD FOUNDATION CHAPTER - IS MATTER AROUND US PURE EXERCISE - MULTIPLE CHOICE QUESTION20videos
IS MATTER AROUND US PURE
- BOOK - SCIENCE OLYMPIAD FOUNDATION CHAPTER - NSO QUESTION PAPER 2016 SET A EXERCISE - ACHIEVERS SECTION1videos
NSO QUESTION PAPER 2016 SET A
Similar Questions
Knowledge Check
- Question 1 - Select One
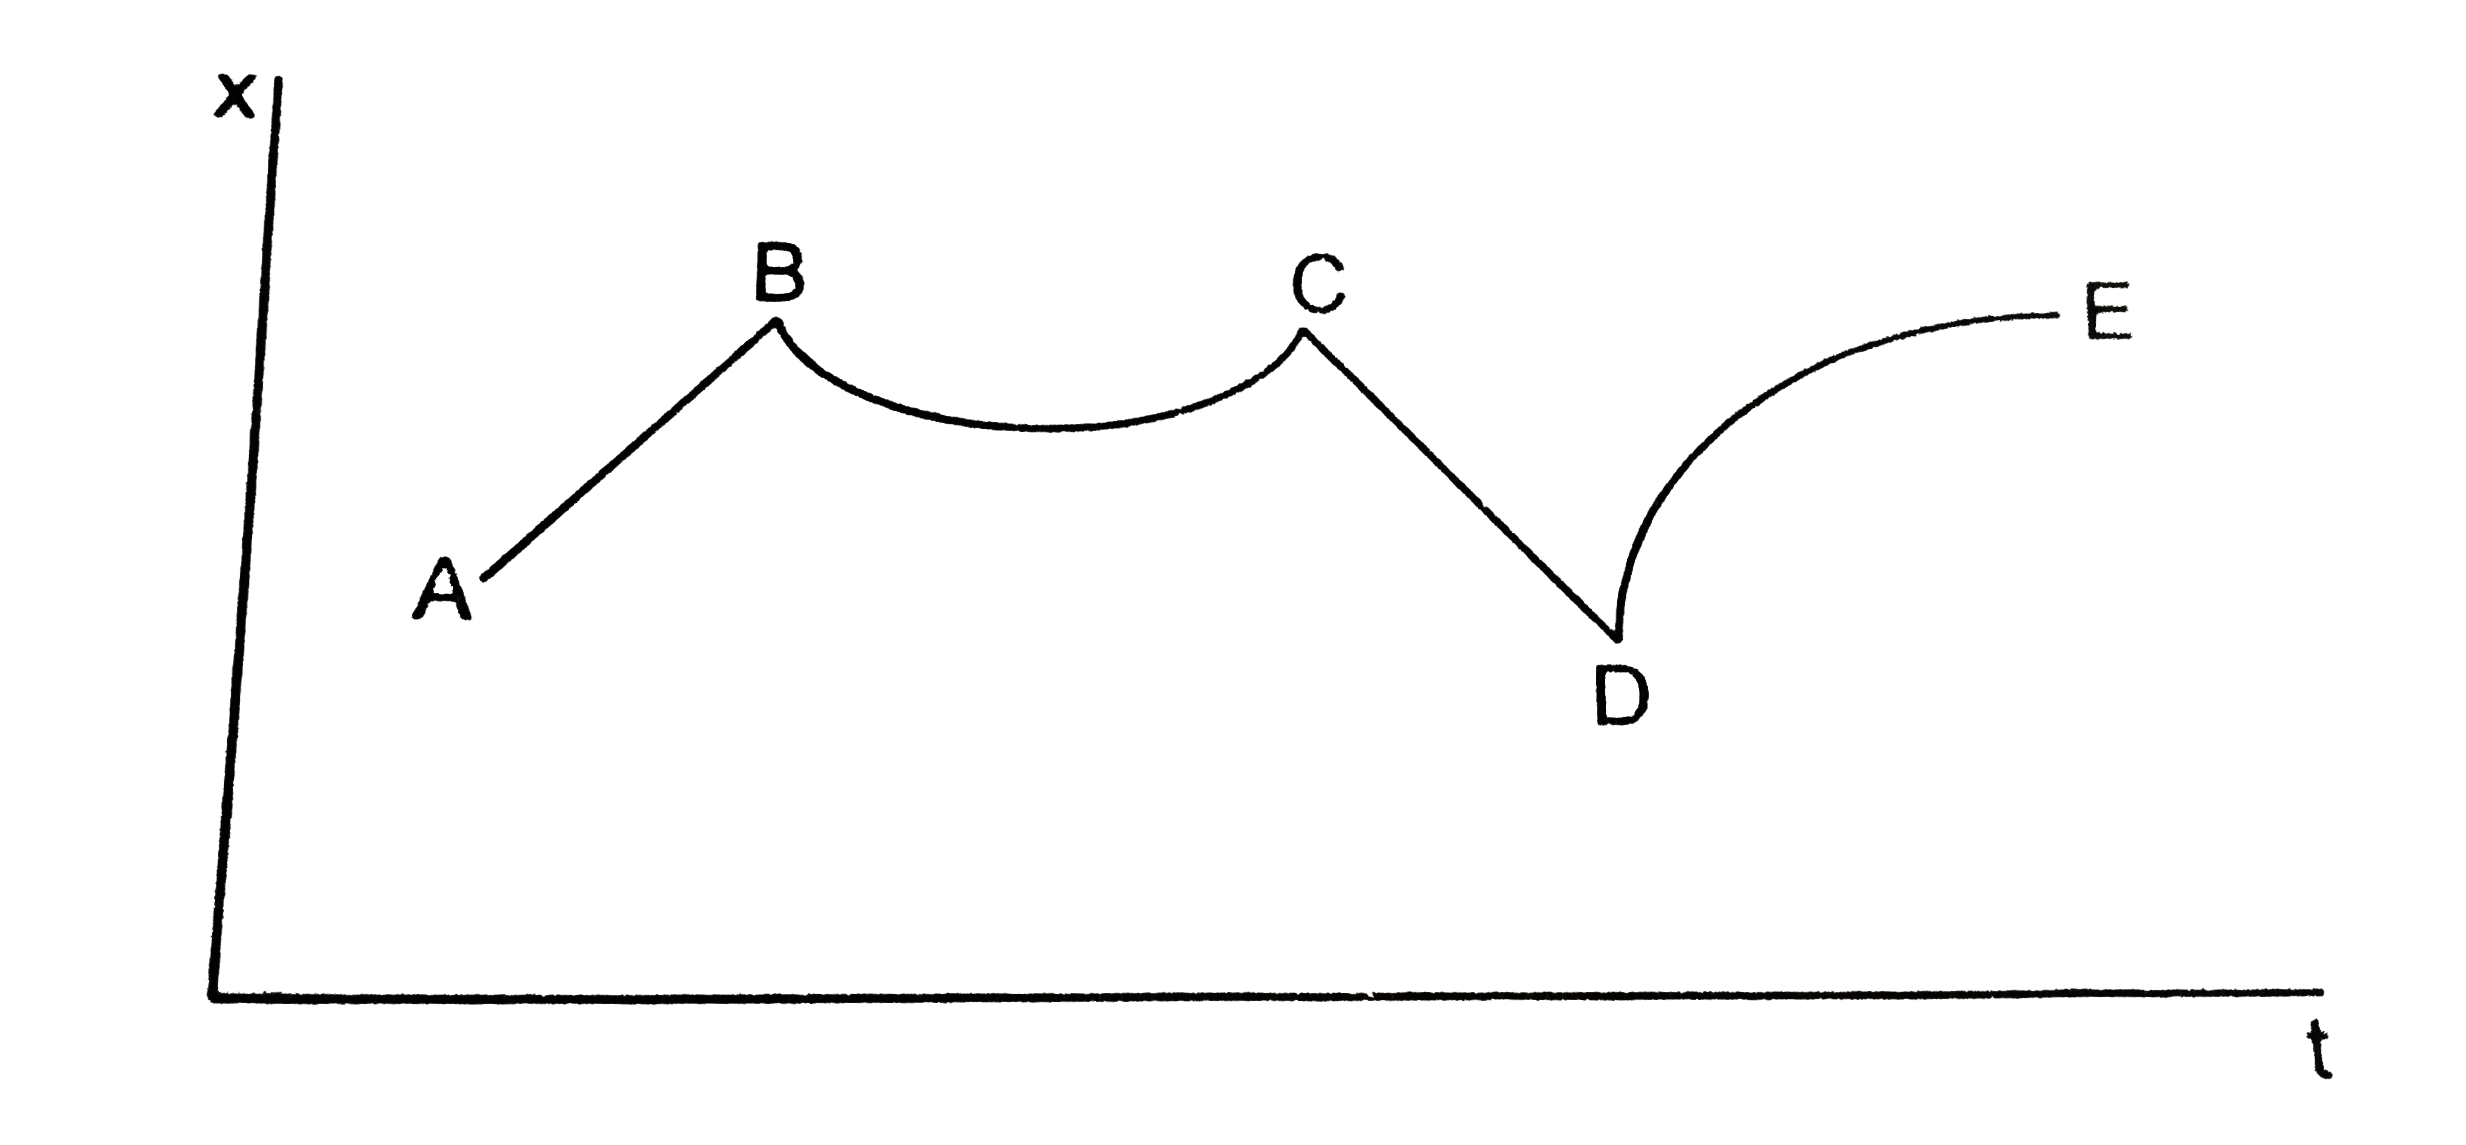
Which of the graph shows that the particle is at rest .
A B
B C
C D
D
- Question 2 - Select One
The given figures show arrangement of particles of a substance X at different temperatures.

Which of the following statements is correct?AThe boiling point of the substance X is between 75∘C and 125∘C.BThe melting point of the substance X is below 75∘C.CParticles of substance X at 125∘C have more kinetic energy than at 75∘C.DAll of these - Question 3 - Select One
Which of the graph shows a particle with retardation?
A B
B C
C D
D
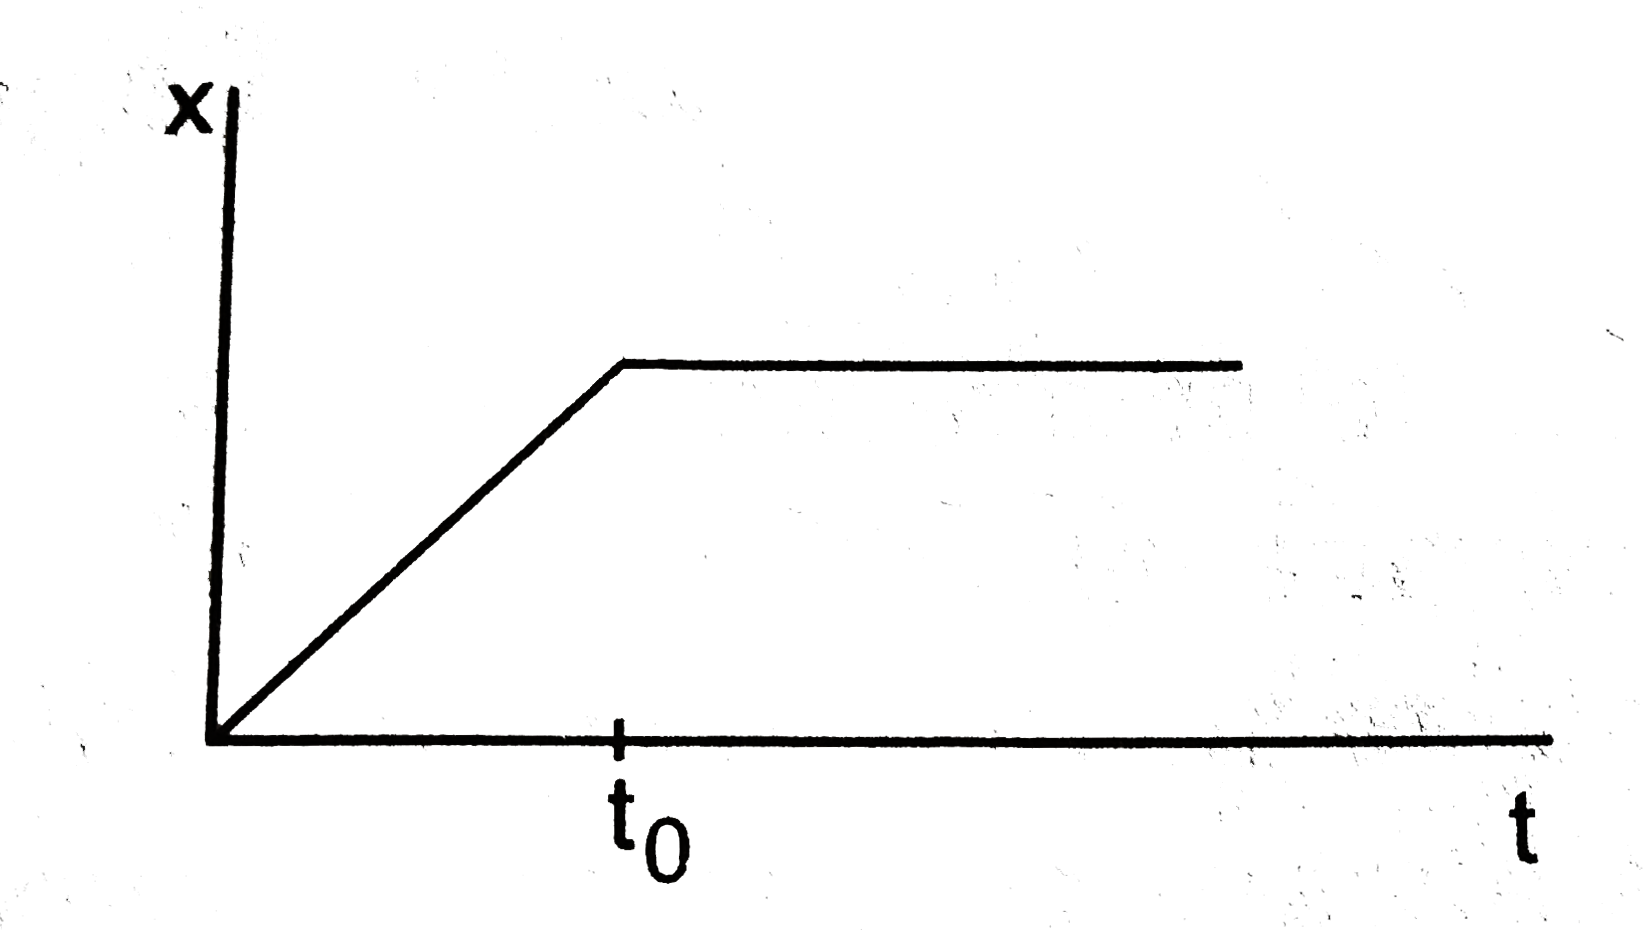
Figure shows the displacement of a particle going along the X-axis as a function of time. The force acting on the particle is zero in the region
 View Solution
Figure show the displacement - time graph of a particle moving on the x-axis
 View Solution
A particle is moving in x−y plane with y=x2 and Vx=4−2t. The displacement versus time graph of the particle would be
View SolutionA crystal is made of particles X and Y. X forms FCC packing and Y occupies all the octahedral voids. Find the formula of the crystal if all the particles along one body diagonal are removed.
View SolutionA particle moves in xy plane accordin to the law x=asinwt and y=a(1−coswt) where a and w are costant . The particle traces.
View Solution


