Elingham diagram represents.
A
Change of ΔG with temperature
B
Change of ΔH with temperature
C
Change of ΔG with pressure
D
Change of (ΔG−TΔS) with temperature
Video Solution
Text Solution
The correct Answer is:A
|
Answer
Step by step video, text & image solution for Elingham diagram represents. by Chemistry experts to help you in doubts & scoring excellent marks in Class 12 exams.
Updated on:21/07/2023Topper's Solved these Questions
- GENERAL PRINCIPLES AND PROCESS OF ISOLATION OF ELEMENTSBOOK - CENGAGE CHEMISTRYCHAPTER - GENERAL PRINCIPLES AND PROCESS OF ISOLATION OF ELEMENTSEXERCISE - Exercise (Assertion-Reasoning)
18 Videos
- GENERAL PRINCIPLES AND PROCESS OF ISOLATION OF ELEMENTSBOOK - CENGAGE CHEMISTRYCHAPTER - GENERAL PRINCIPLES AND PROCESS OF ISOLATION OF ELEMENTSEXERCISE - Exercise (Integer)
27 Videos
- GENERAL PRINCIPLES AND PROCESS OF ISOLATION OF ELEMENTSBOOK - CENGAGE CHEMISTRYCHAPTER - GENERAL PRINCIPLES AND PROCESS OF ISOLATION OF ELEMENTSEXERCISE - Exercise (Multiple Correct)
43 Videos
- ELECTROCHEMISTRYBOOK - CENGAGE CHEMISTRYCHAPTER - ELECTROCHEMISTRYEXERCISE - Archieves Subjective
35 Videos
- GRIGNARD REAGENTS AND ORGANOMETALLIC REAGENTSBOOK - CENGAGE CHEMISTRYCHAPTER - GRIGNARD REAGENTS AND ORGANOMETALLIC REAGENTSEXERCISE - Exercises Archives (Linked Comprehension)
1 Videos
Similar Questions
Knowledge Check
Ellingham diagram represents:
Achange of ΔG with temperatureBchange of ΔH with temperatureCchange of ΔG with pressureDchange of (ΔG−TΔS) with temperatureEllingham diagram represents :
Achange of △G with temperatureBchange of △H with temperatrueCchange of △G with pressureDchange of (△G−T△S) with temperatureEllingham diagram represents:
Achange of ΔG with temperatureBchange of ΔH with temperatureCchange of ΔG with pressureDchange of (ΔG−TΔS) with temperature
The diagram represents

View SolutionThe diagram represents

View SolutionThe following diagram represents the situation of:

View SolutionThe following diagram represents:

a) Adaptive radiation
b) Divergent evolution
c) Convergent evolution
d) Both (a) and (b)
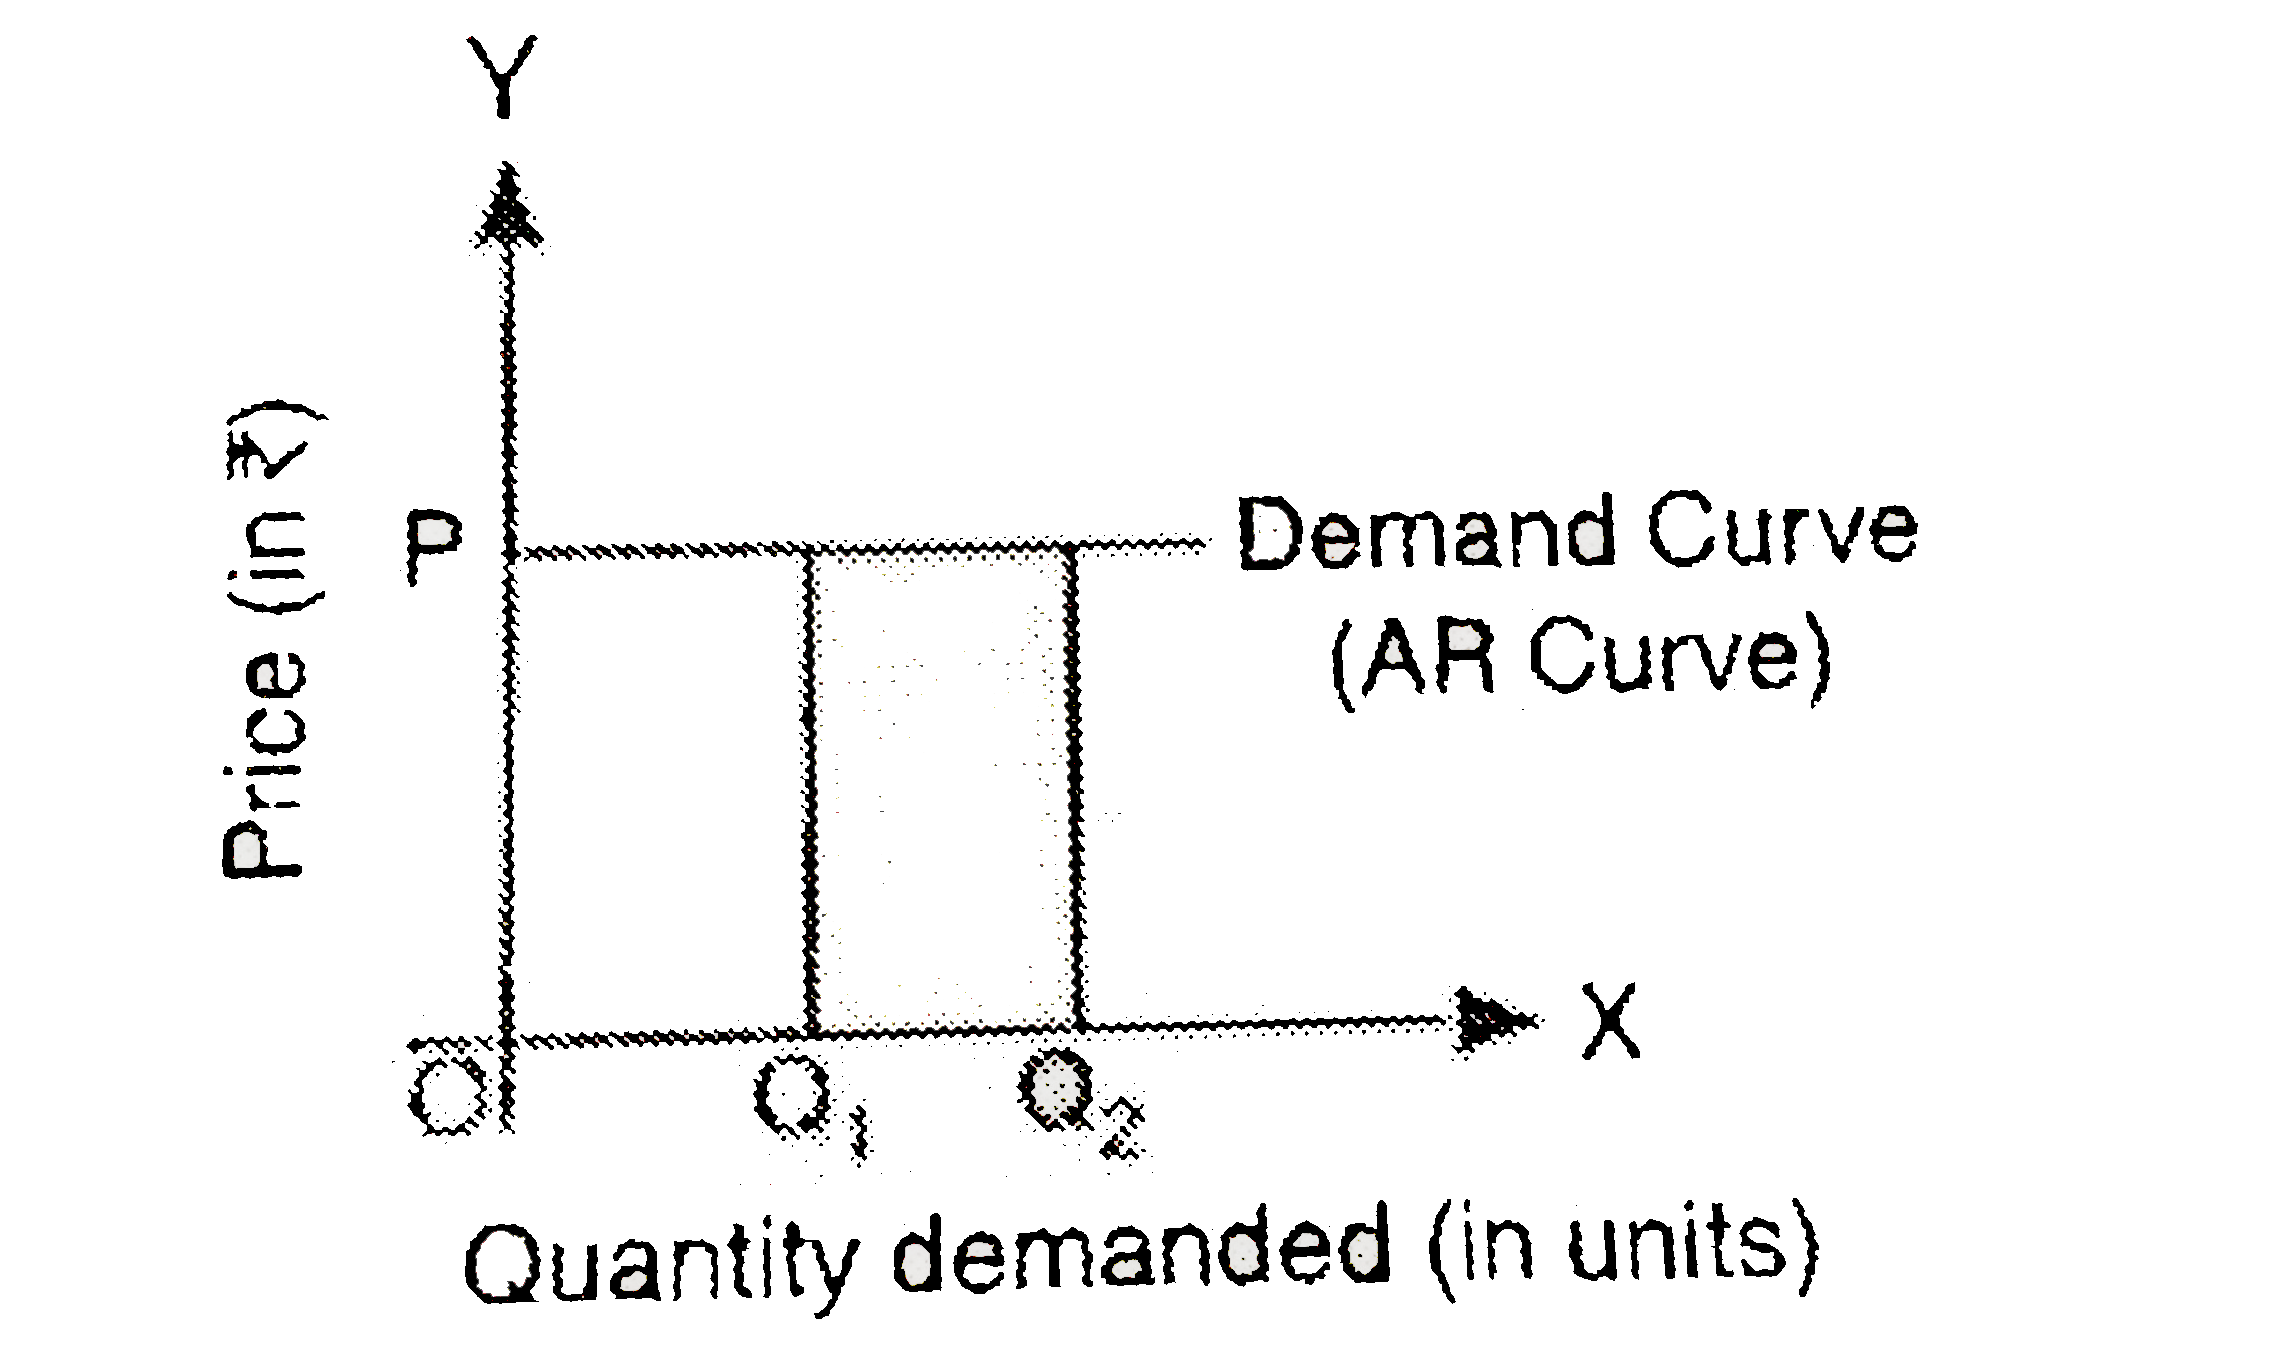
View SolutionThe following diagram represents the demand curve of:

View Solution
