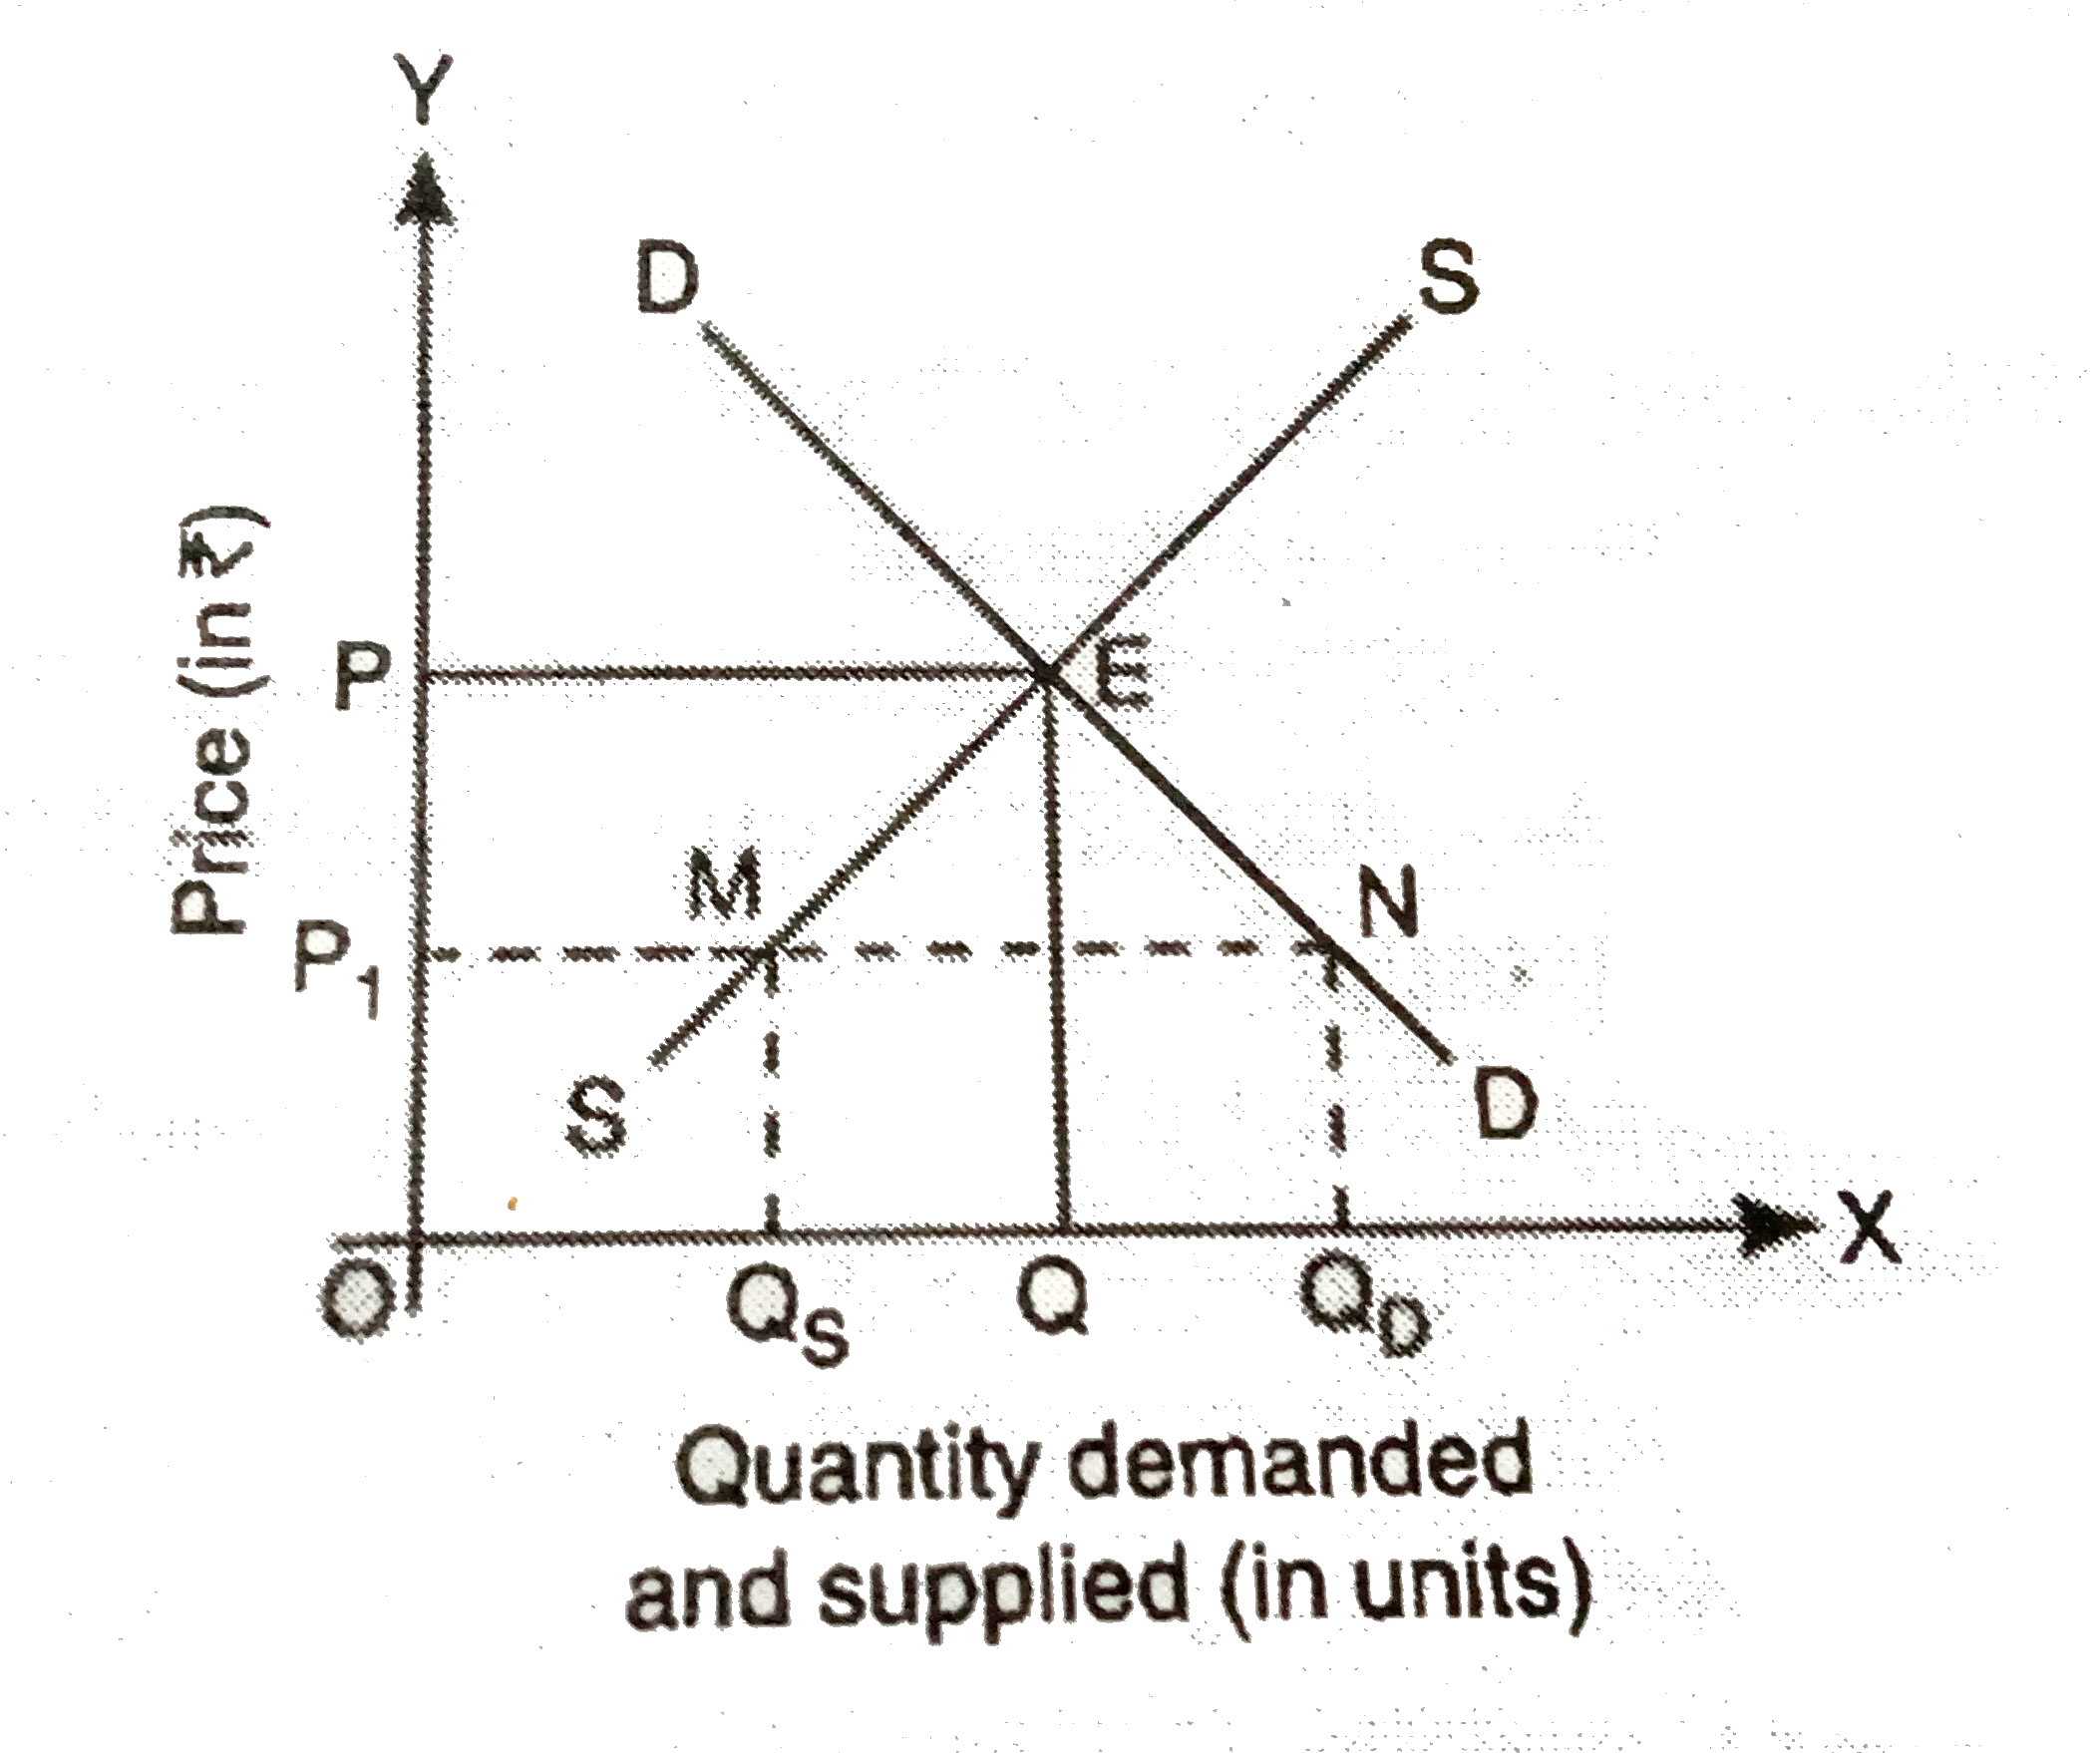
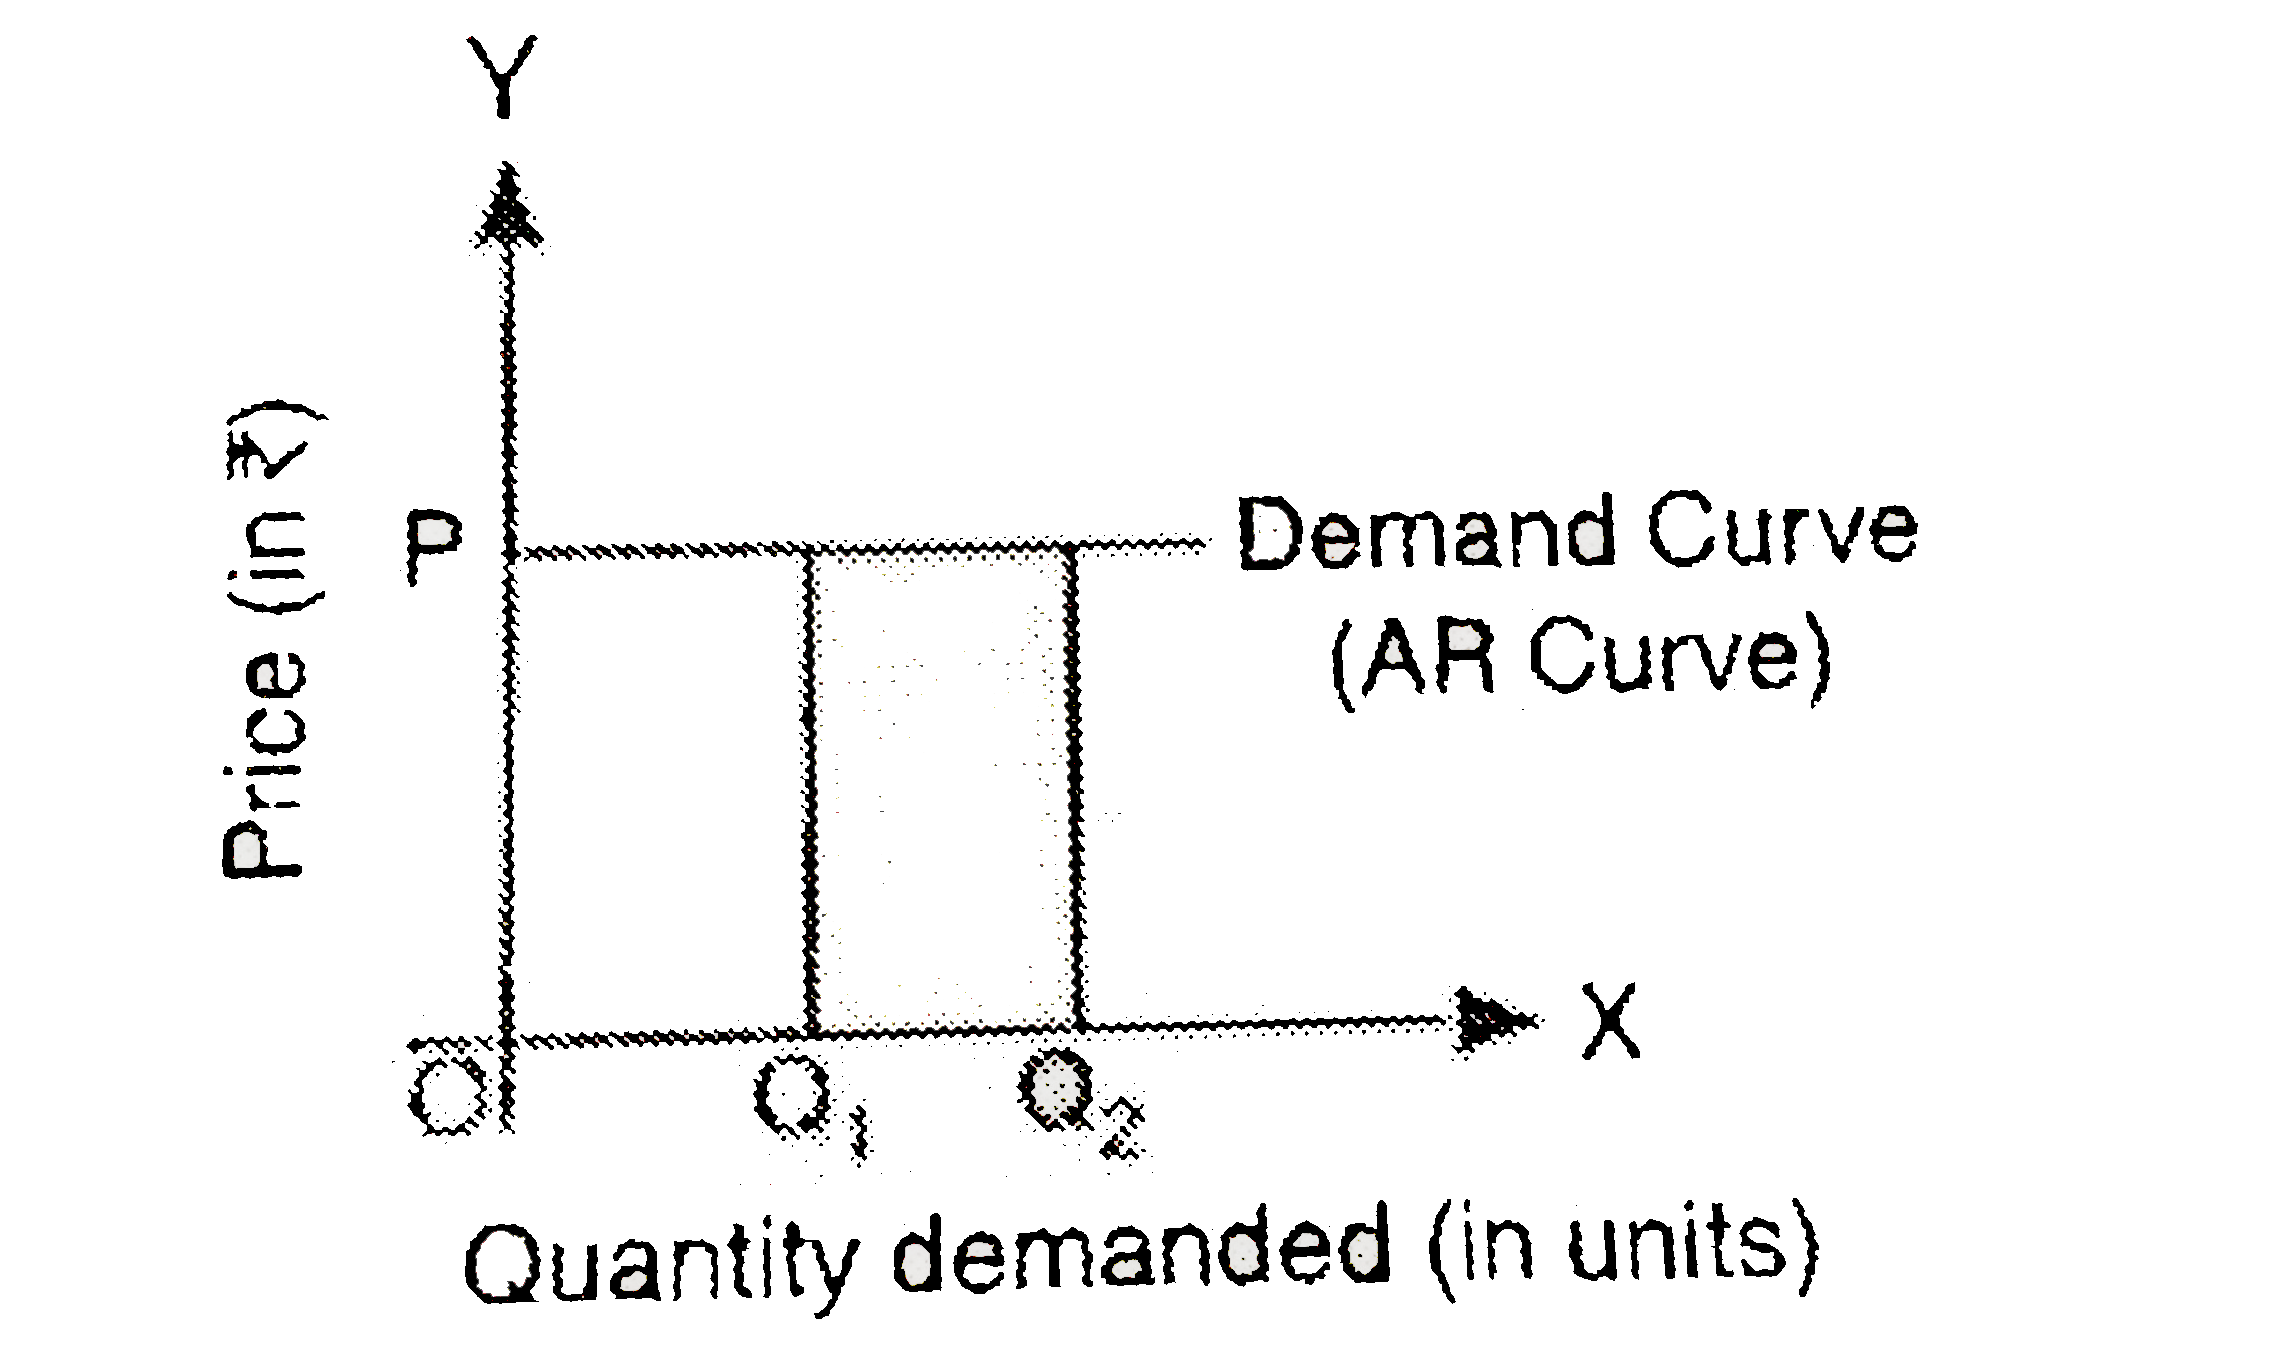
The following diagram represents the situation of:
A
Price Floor
B
Price Ceiling
C
Either (a) or (b)
D
Neither (a) nor (b)
Text Solution
The correct Answer is:(b)
|
Topper's Solved these Questions
- PRICE DETERMINATION AND SIMPLE APPLICATIONSBOOK - SANDEEP GARGCHAPTER - PRICE DETERMINATION AND SIMPLE APPLICATIONSEXERCISE - Short Answer Type Questions
20 Videos
- PRICE DETERMINATION AND SIMPLE APPLICATIONSBOOK - SANDEEP GARGCHAPTER - PRICE DETERMINATION AND SIMPLE APPLICATIONSEXERCISE - Long Answer Type Questions
28 Videos
- PRICE DETERMINATION AND SIMPLE APPLICATIONSBOOK - SANDEEP GARGCHAPTER - PRICE DETERMINATION AND SIMPLE APPLICATIONSEXERCISE - Very Short Answer Type Questions
22 Videos
- MAIN MARKET FORMSBOOK - SANDEEP GARGCHAPTER - MAIN MARKET FORMSEXERCISE - Very short
17 Videos
- PRODUCER'S EQUILIBRIUMBOOK - SANDEEP GARGCHAPTER - PRODUCER'S EQUILIBRIUMEXERCISE - Unsolved Practicals
12 Videos
Similar Questions
Knowledge Check
Which of the following diagram represent the situation of 'Expansion in Demand' ?
A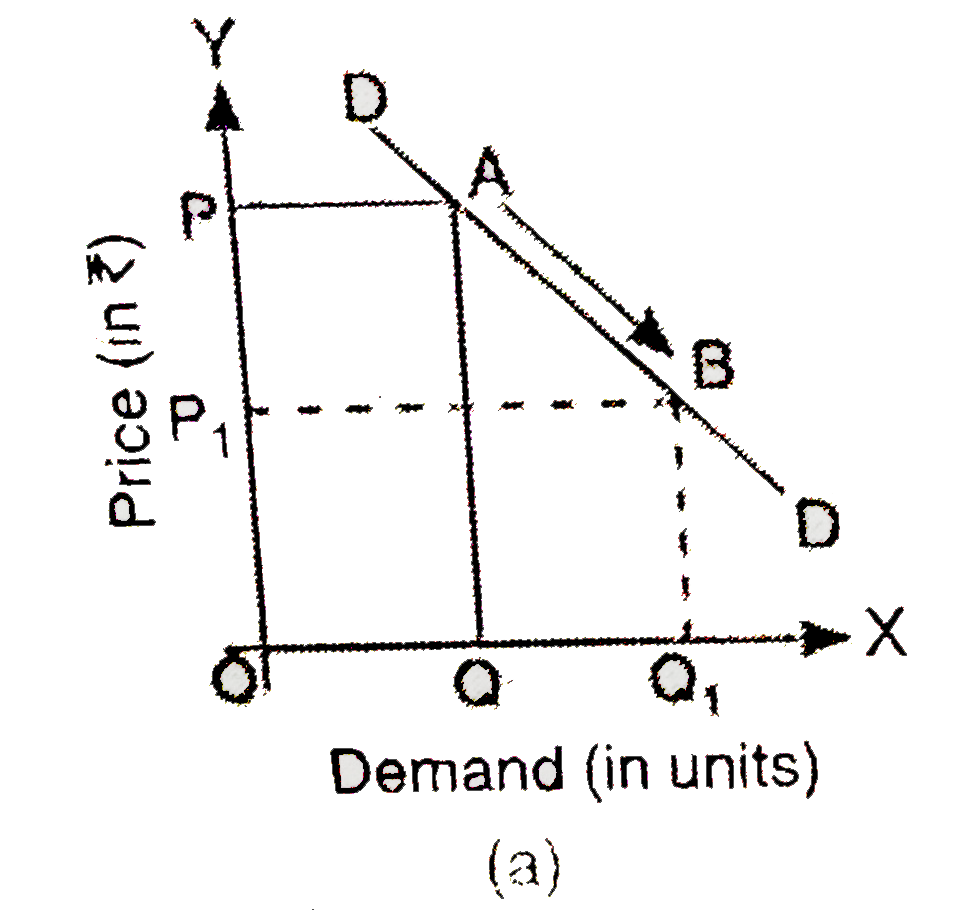 B
B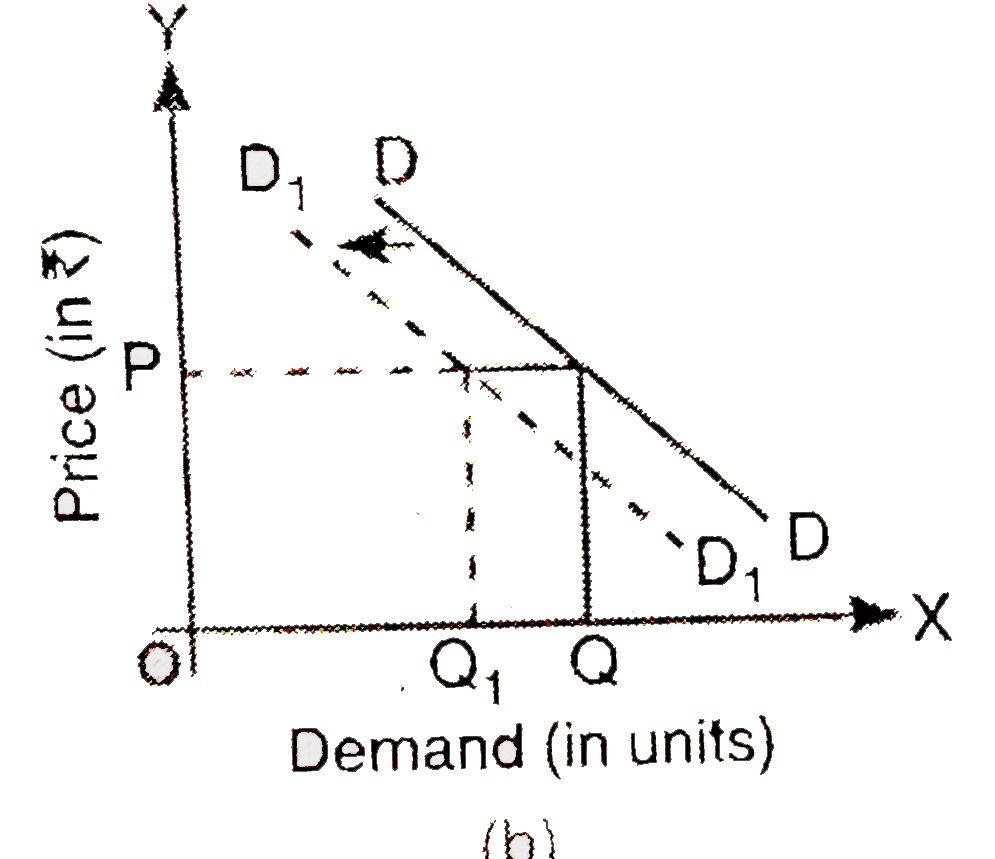 C
C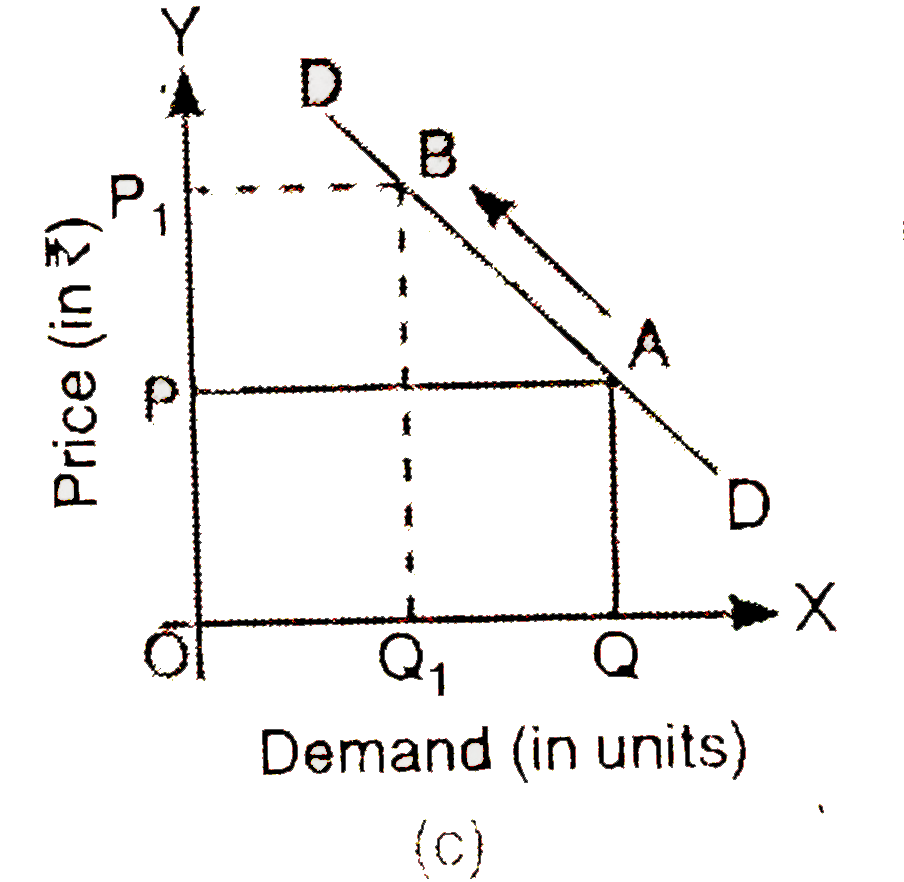 D
D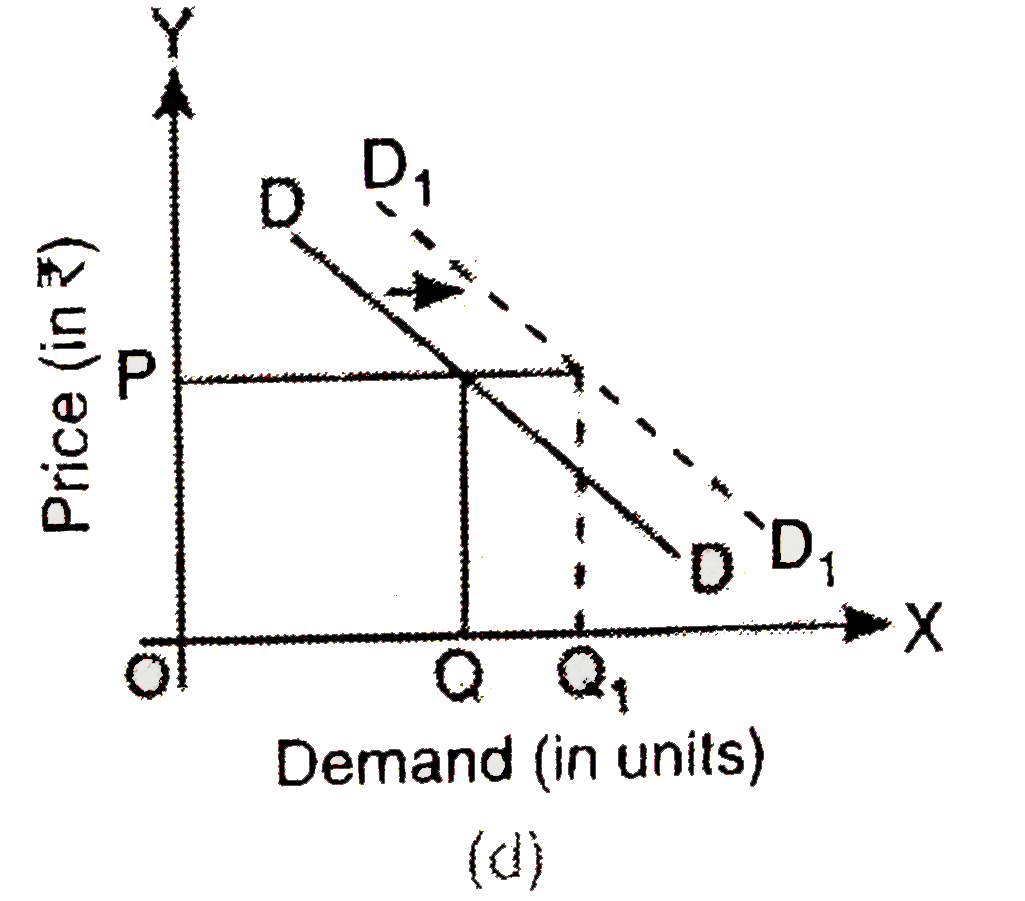
The following diagram depicts the situation of :
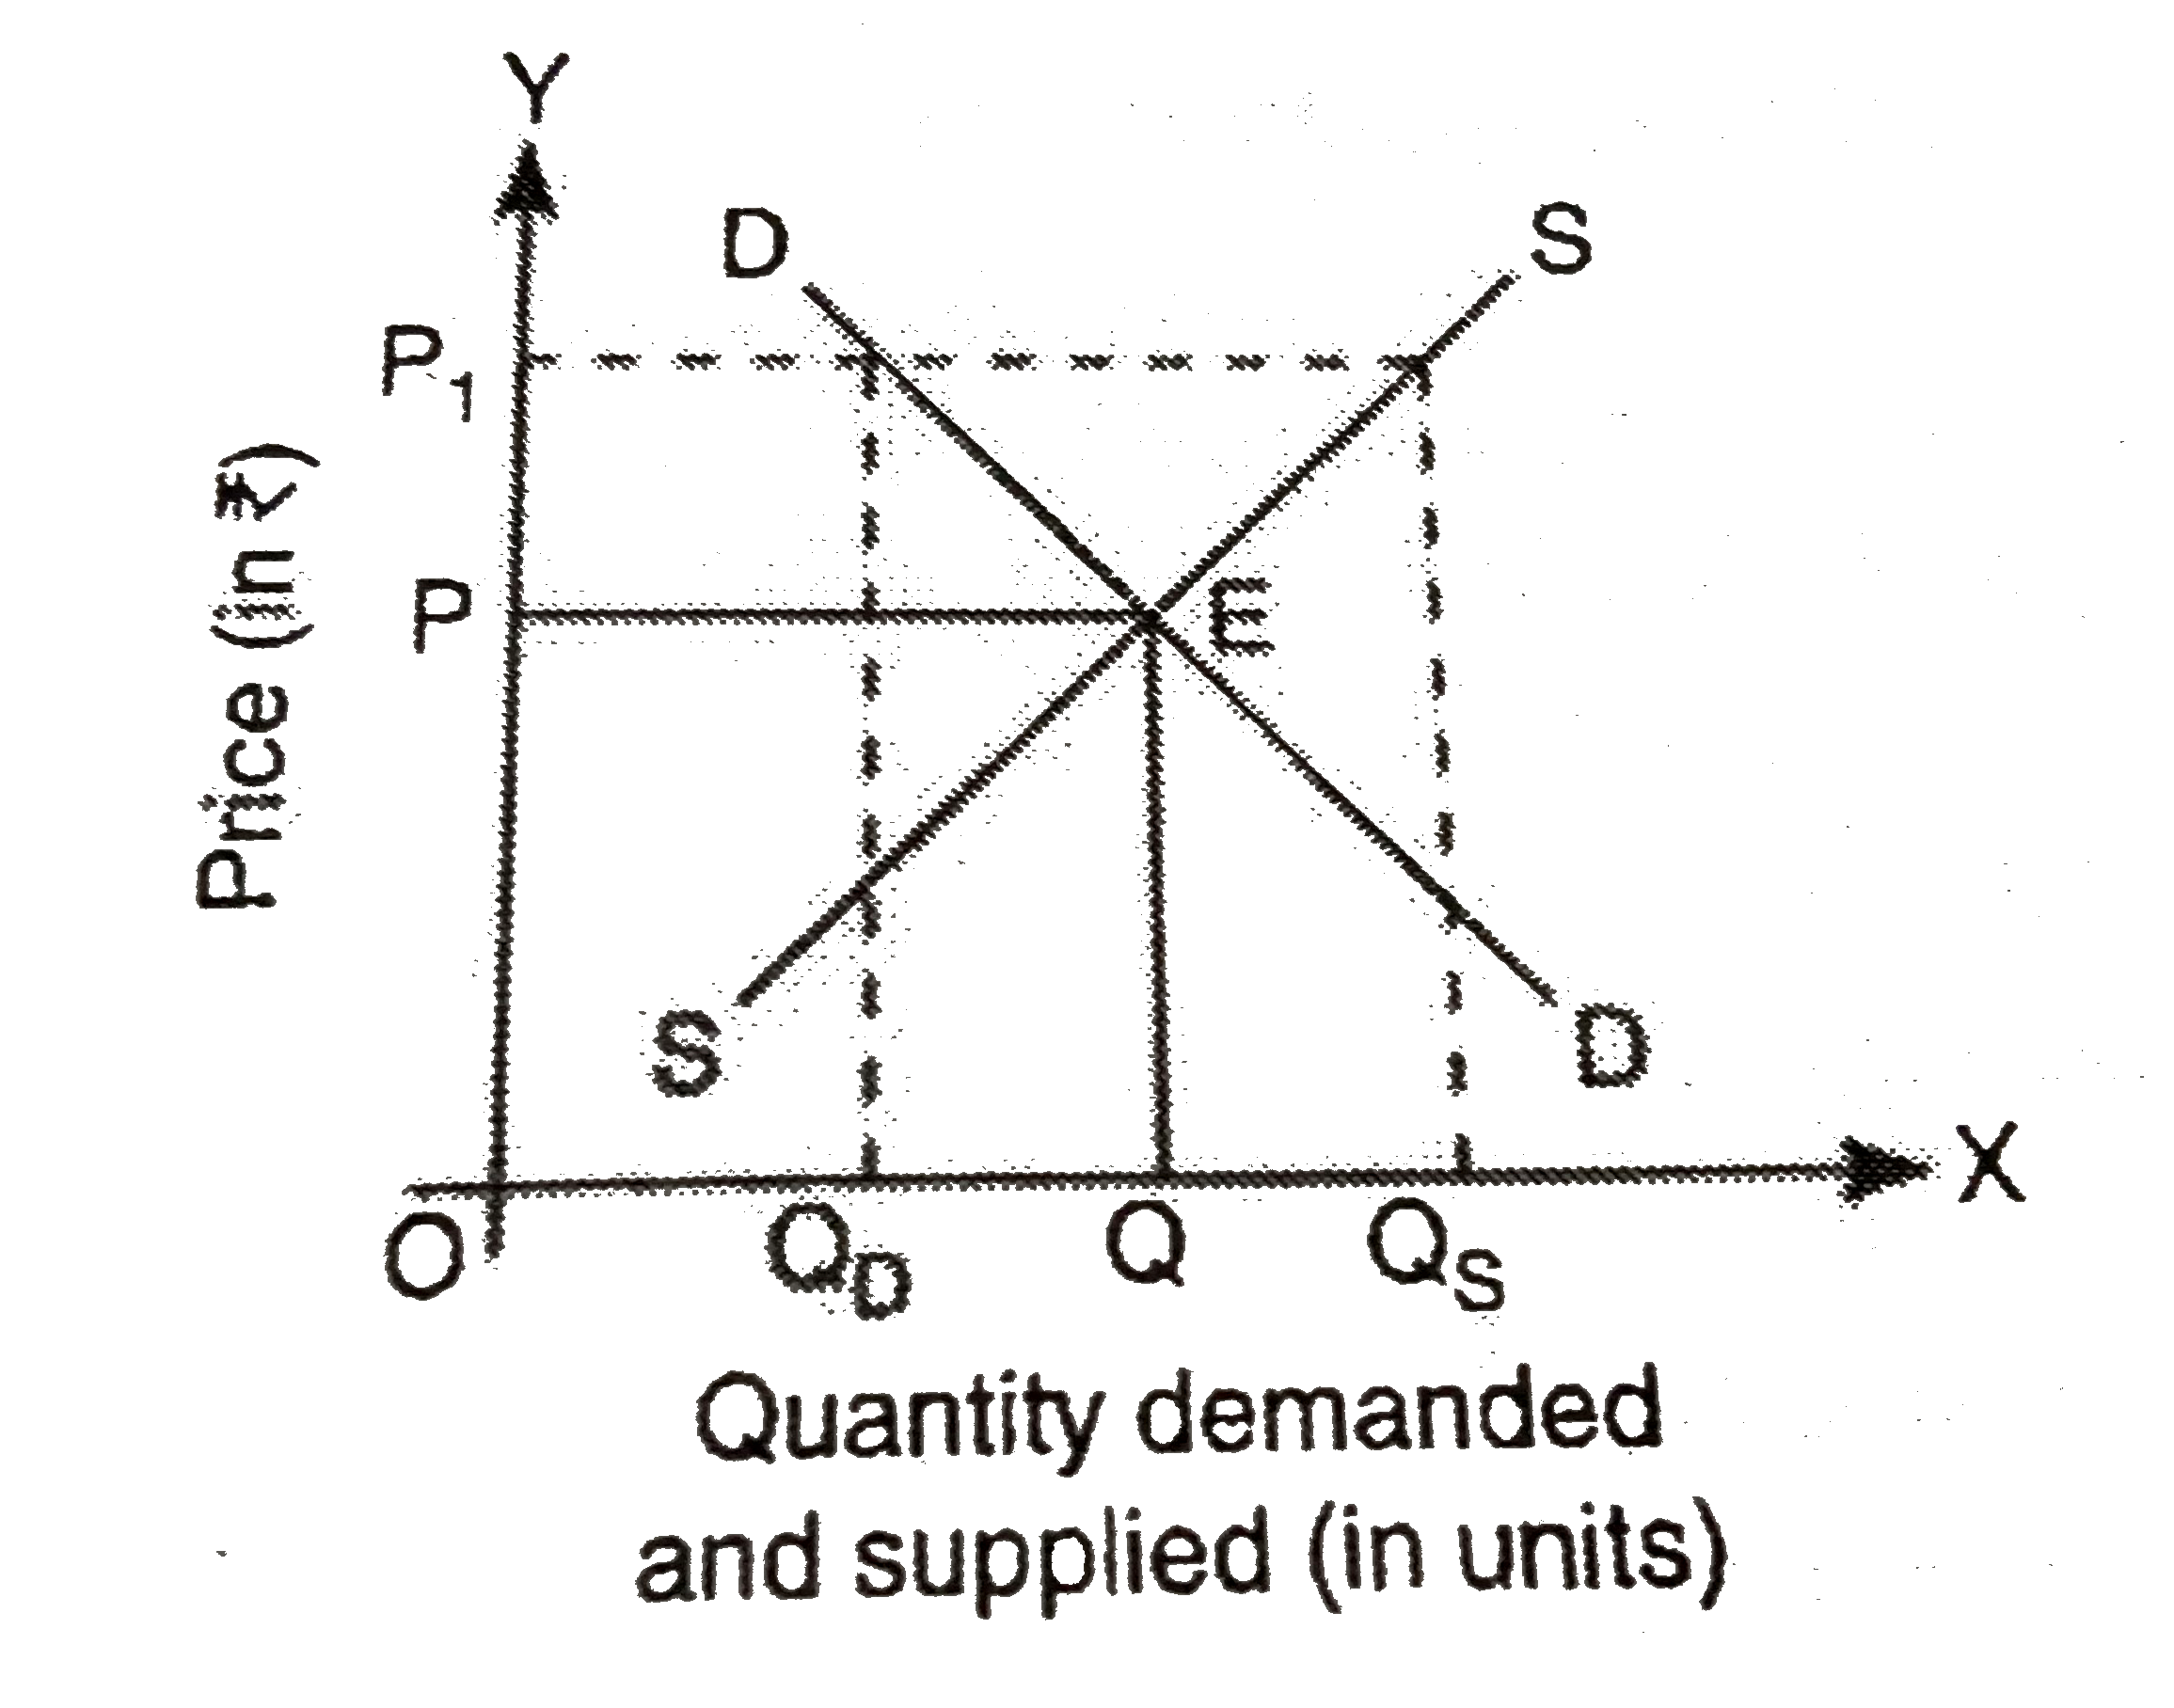 AExcess SupplyBExcess DemandCEquilibrium ConditionDNone of these
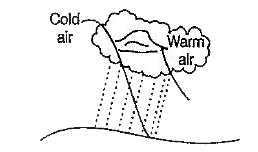
The diagram represents
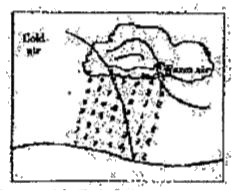 AOrographic RainfallBConvectional RainfallCCyclonic RainfallDPre-monsoon Rainfall
Which one of the following diagrams represents the placentation in Dianthus
View SolutionWhich one of the following diagrams represents the placentation in Dianthus
View SolutionWhich one of the following diagrams represents the placentation in Dianthus
View SolutionEllingham diagram represents:
View SolutionThe following diagram represents the demand curve of:
View Solution

