Explain the energy level diagram for the hydrogen atom and show the different series in hydrogen atom spectrum.
Text Solution
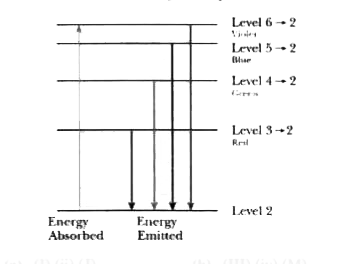
Energy level diagram for hydrogen atom. The energy of an electron corresponding to each orbit (energy state) can be represented by the horizontal lines as shown in figure. This is called an energy level diagram. The transitions of electron between the orbits is shown by vertical arrows between the energy levels. The energy of each emitted photon is proportional to the length of the arrow between two corresponding energy levels. We know, the energy of electron in the nth orbit of hydrogen atom is given by
En=2π2k2me4n2h2=−RHchn2
e=1.6×10⁻¹⁹c,h=6.25×10⁻³⁴js

En=13.6n2ev
E1=−13.6eV
This is the energy associated with the first orbit of the hydrogen atom known as the ground state energy of hydrogen atom
When n=2 E2=13.622=3.4eV
when n=3=E3=13.632=−1.51eV
when n=4 E4=−13.642=−0.85eV
When n=∞E∞=−13.6∞2=0
So as n increases, the energy associated with the orbit becomes less negative. For n=∞ , the energy becomes zero. The electron is no longer bound to the nucleus and becomes a free electron.
|
Updated on:21/07/2023
Topper's Solved these Questions
- BOOK - BETTER CHOICE PUBLICATIONCHAPTER - STRUCTURE OF ATOMEXERCISE - LONG ANSWER TYPE QUESTIONS8videos
STRUCTURE OF ATOM
- BOOK - BETTER CHOICE PUBLICATIONCHAPTER - STRUCTURE OF ATOMEXERCISE - NUMERICAL PROBLEMS6videos
STRUCTURE OF ATOM
- BOOK - BETTER CHOICE PUBLICATIONCHAPTER - STRUCTURE OF ATOMEXERCISE - SHORT ANSWER TYPE QUESTIONS3videos
STRUCTURE OF ATOM
- BOOK - BETTER CHOICE PUBLICATIONCHAPTER - SOLUTIONSEXERCISE - Numerical Problems (PSEB 2016)5videos
SOLUTIONS
- BOOK - BETTER CHOICE PUBLICATIONCHAPTER - SURFACE CHEMISTRY EXERCISE - Question Bank94videos
SURFACE CHEMISTRY
Similar Questions
Knowledge Check
- Question 1 - Select One or More
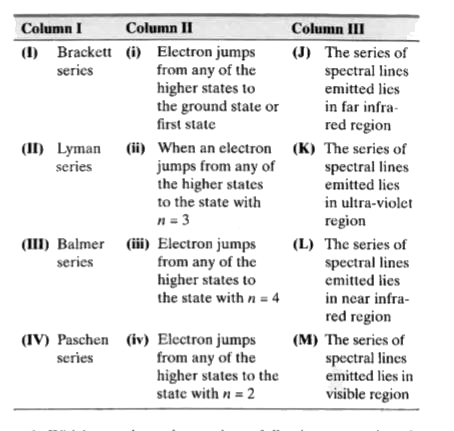
In a hydrogen atom, whenever there is transition of electron between different energy levels, energy is emitted or absorbed, and hydrogen spectrum is obtained. In the given table, Column I shows the names of the different series of hydrogen atom spectrum, Column II shows the energy levels from where electron transition takes place and Column III shows the EM wave region where these different series exists.

Which series does the diagram depict?
 A(I)(ii)(J)B(III)(iv)(M)C(II)(iii)(L)D(I)(i)(M)
 - Question 2 - Select One or More
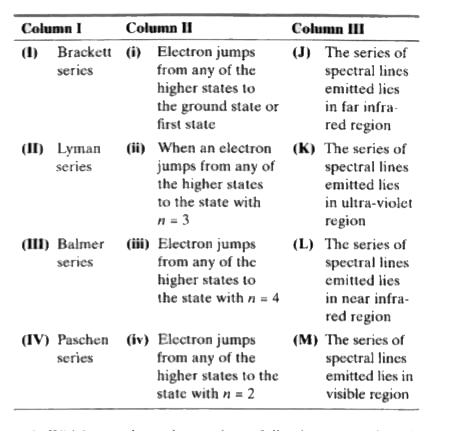
In a hydrogen atom, whenever there is transition of electron between different energy levels, energy is emitted or absorbed, and hydrogen spectrum is obtained. In the given table, Column I shows the names of the different series of hydrogen atom spectrum, Column II shows the energy levels from where electron transition takes place and Column III shows the EM wave region where these different series exists.

Which series has the following wavelength v=RZ2(142−1n22)?A(II)(ii)(J)B(I)(iii)(J)C(IV)(i)(L)D(II)(iii)(M) - Question 3 - Select One or More
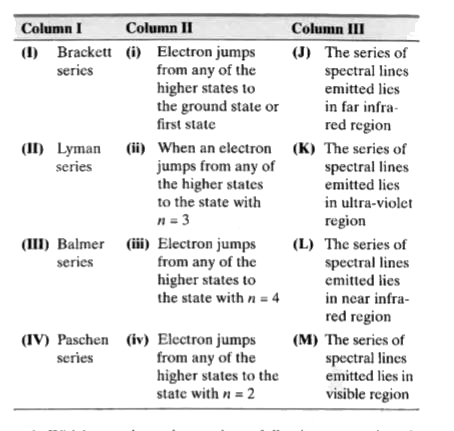
In a hydrogen atom, whenever there is transition of electron between different energy levels, energy is emitted or absorbed, and hydrogen spectrum is obtained. In the given table, Column I shows the names of the different series of hydrogen atom spectrum, Column II shows the energy levels from where electron transition takes place and Column III shows the EM wave region where these different series exists.

Which series has the following wavelength v=RZ2(112−1n22),n2=2,3,4,5,....?A(I)(iv)(M)B(IV)(ii)(L)C(II)(i)(K)D(II)(i)(K)
Draw the energy-level diagram of hydrogen atom. Show the Lyman series and Pfund series in the diagram.
View SolutionDraw the energy level diagram for the hydrogen atom, neatly labelled and showing the transitions which give rise to the first five series of spectral lines for hydrogen.
View SolutionDraw energy level diagram for hydrogen atom and show the various line spectra originating due to transition between energy levels.
View SolutionDraw the energy level diagram of hydrogen atom and show the transitions responsible for :
(i) absorption lines of Lyman series.
(ii) emission lines of Balmer series.View SolutionFor hydrogen atom, energy of nth level is given by
View Solution

