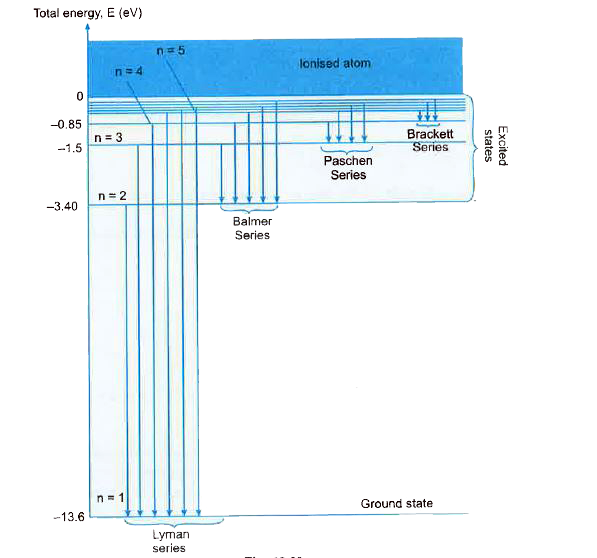
Sketch the energy level diagram for hydrogen atom and mark the transitions for different spectral series of hydrogen.
The energy level diagram showing ground state as well as first few excited states for hydrogen atom has been shown in Fig. 12.09.
Transitions for different spectral series of hydrogen have been shown by straight lines with arrow head marks.

Topper's Solved these Questions
- ATOMSBOOK - U-LIKE SERIESCHAPTER - ATOMSEXERCISE - LONG ANSWER QUESTIONS - I
18 Videos
- ATOMSBOOK - U-LIKE SERIESCHAPTER - ATOMSEXERCISE - LONG ANSWER QUESTIONS - II
4 Videos
- ATOMSBOOK - U-LIKE SERIESCHAPTER - ATOMSEXERCISE - VERY SHORT ANSWER QUESTIONS.
20 Videos
- ALTERNATING CURRENT BOOK - U-LIKE SERIESCHAPTER - ALTERNATING CURRENT EXERCISE - SELF ASSESSMENT TEST (SECTION -C)
2 Videos
- CBSE EXAMINATION PAPER 2020 BOOK - U-LIKE SERIESCHAPTER - CBSE EXAMINATION PAPER 2020 EXERCISE - SECTION D
12 Videos
Similar Questions
Knowledge Check
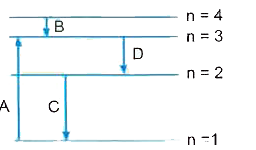
The diagram shows the energy level for an electron in a hydrogen atom. Which transition, shown here, represents the emissions of a photon of maximum energy?
 AABBCCDD
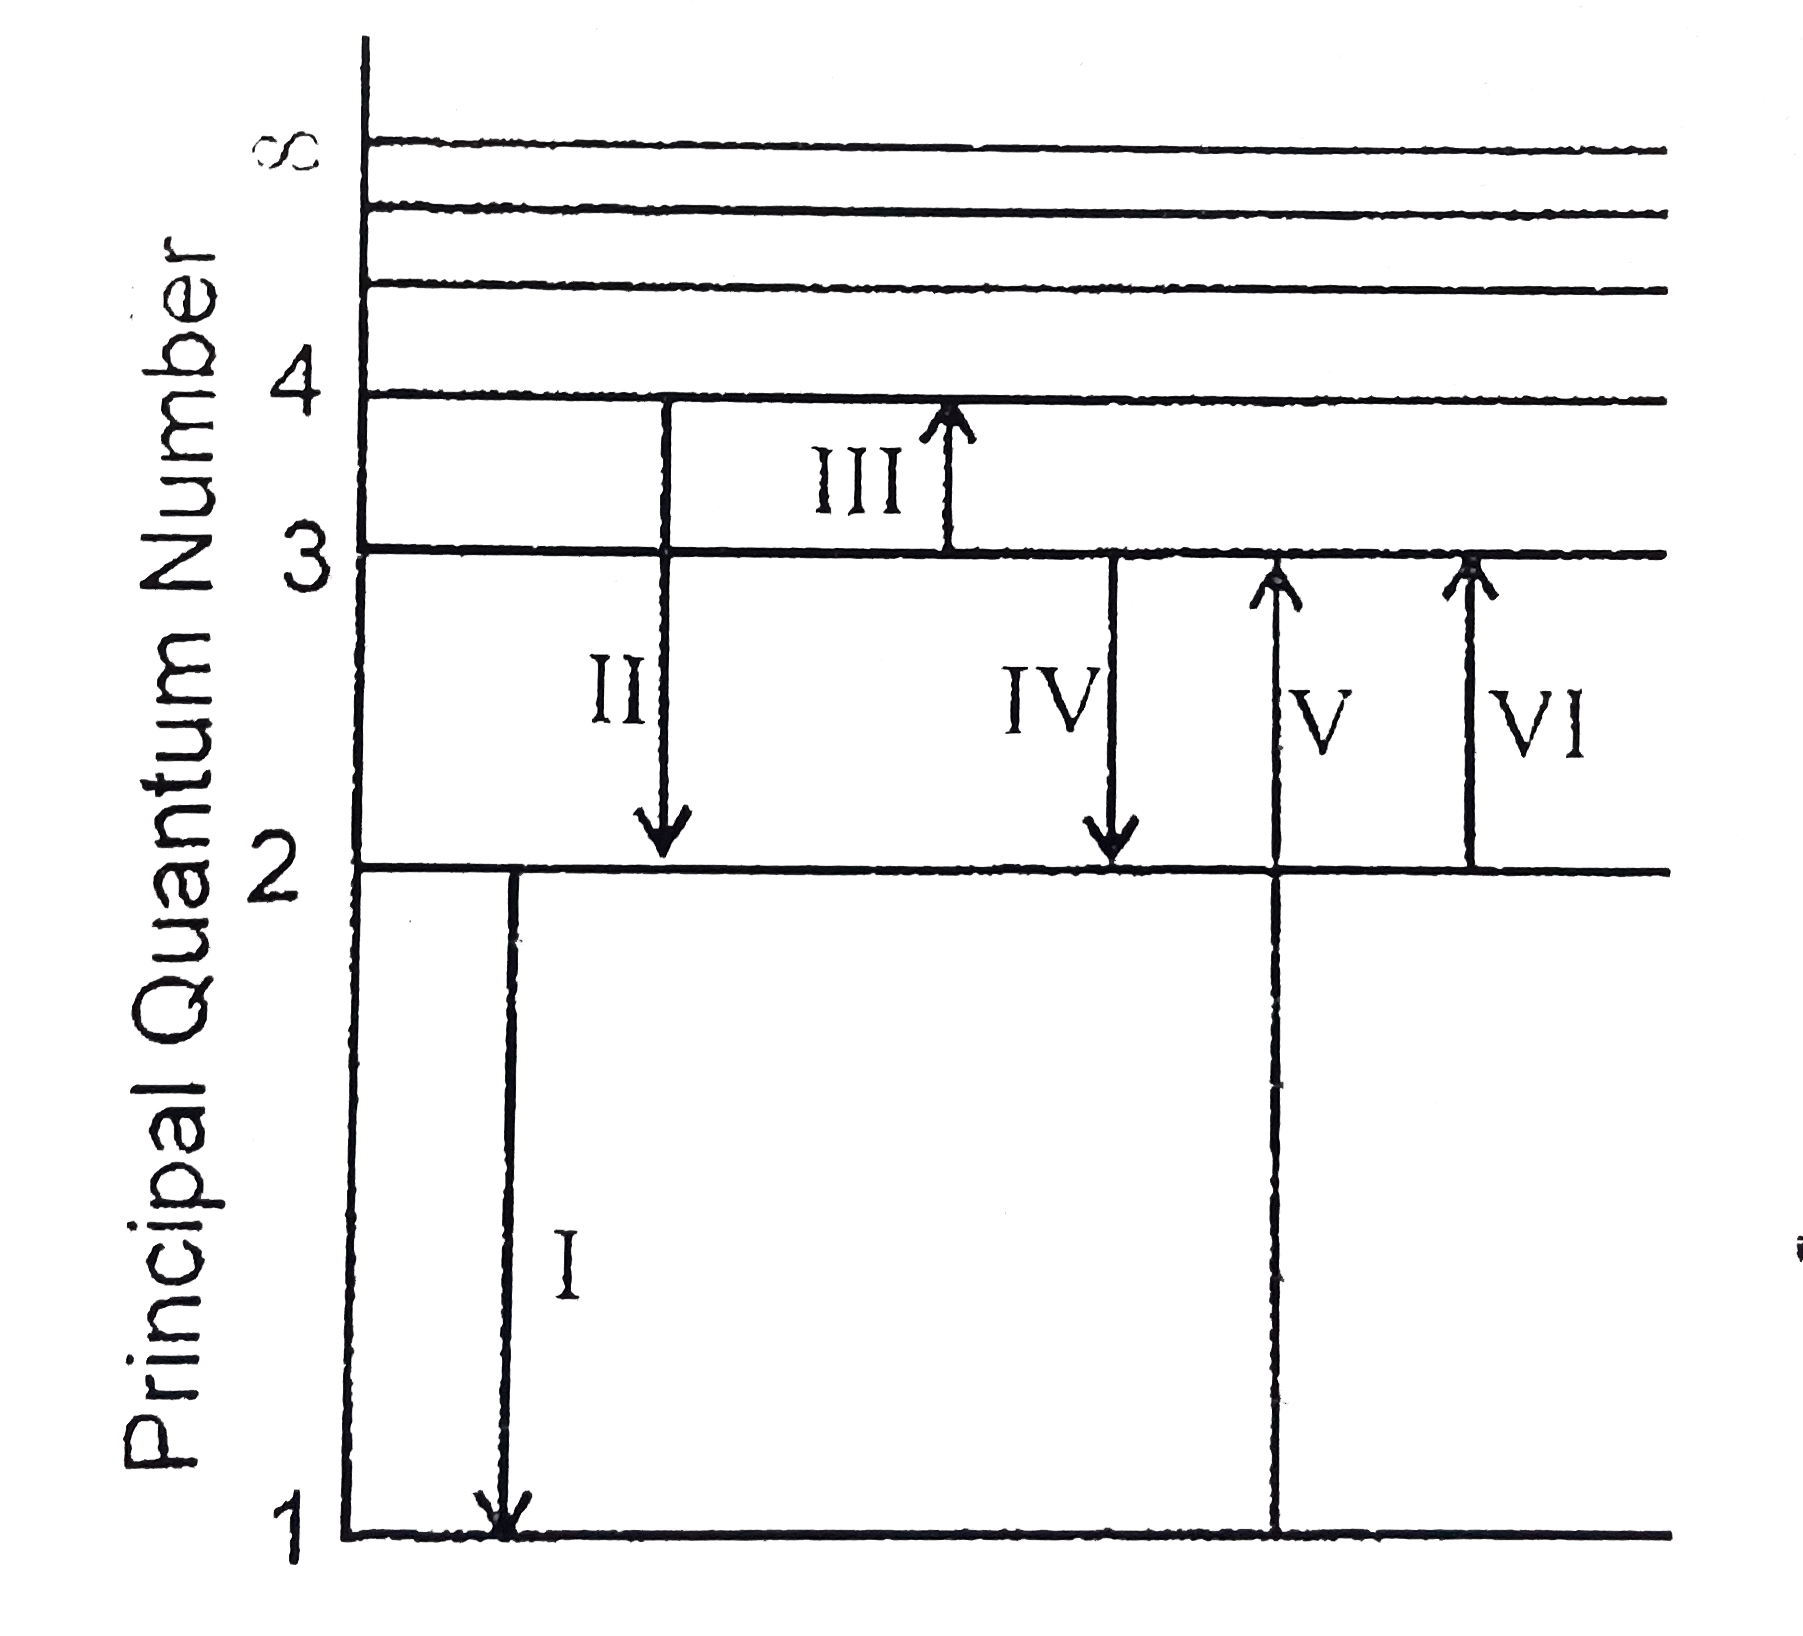
The figure shows an energy level diagram for the hydrogen atom. Several transitions are marked as I, II, III,_____. The diagram is only indicative and not be scale.

Which transition will occur when a hydrogen atom is irradiated with radiation of wavelength 103nm.AIBIICIVDV
Draw the energy level diagram for the hydrogen atom, neatly labelled and showing the transitions which give rise to the first five series of spectral lines for hydrogen.
View SolutionDraw energy level diagram for hydrogen atom and show the various line spectra originating due to transition between energy levels.
View SolutionDraw the energy-level diagram of hydrogen atom. Show the Lyman series and Pfund series in the diagram.
View SolutionFor Bohr.s model of the hydrogen atom, the energy of the electron in its ground state is found to be −13.6eV.
(i) Draw an energy level diagram for the hydrogen atom and mark the value of energy (in eV) at n=2andn=∞.
(ii) Obtain the maximum energy of a photon emitted by the hydrogen atom in eV.
View SolutionDraw energy level diagram for Balmer series for transition between eriergy levels.
View SolutionThe figure shows an energy level diagram for the hydrogen atom. Several transitions are marked as I, II, III,_____. The diagram is only indicative and not be scale.

Which transition will occur when a hydrogen atom is irradiated with radiation of wavelength 103nm.
View Solution
