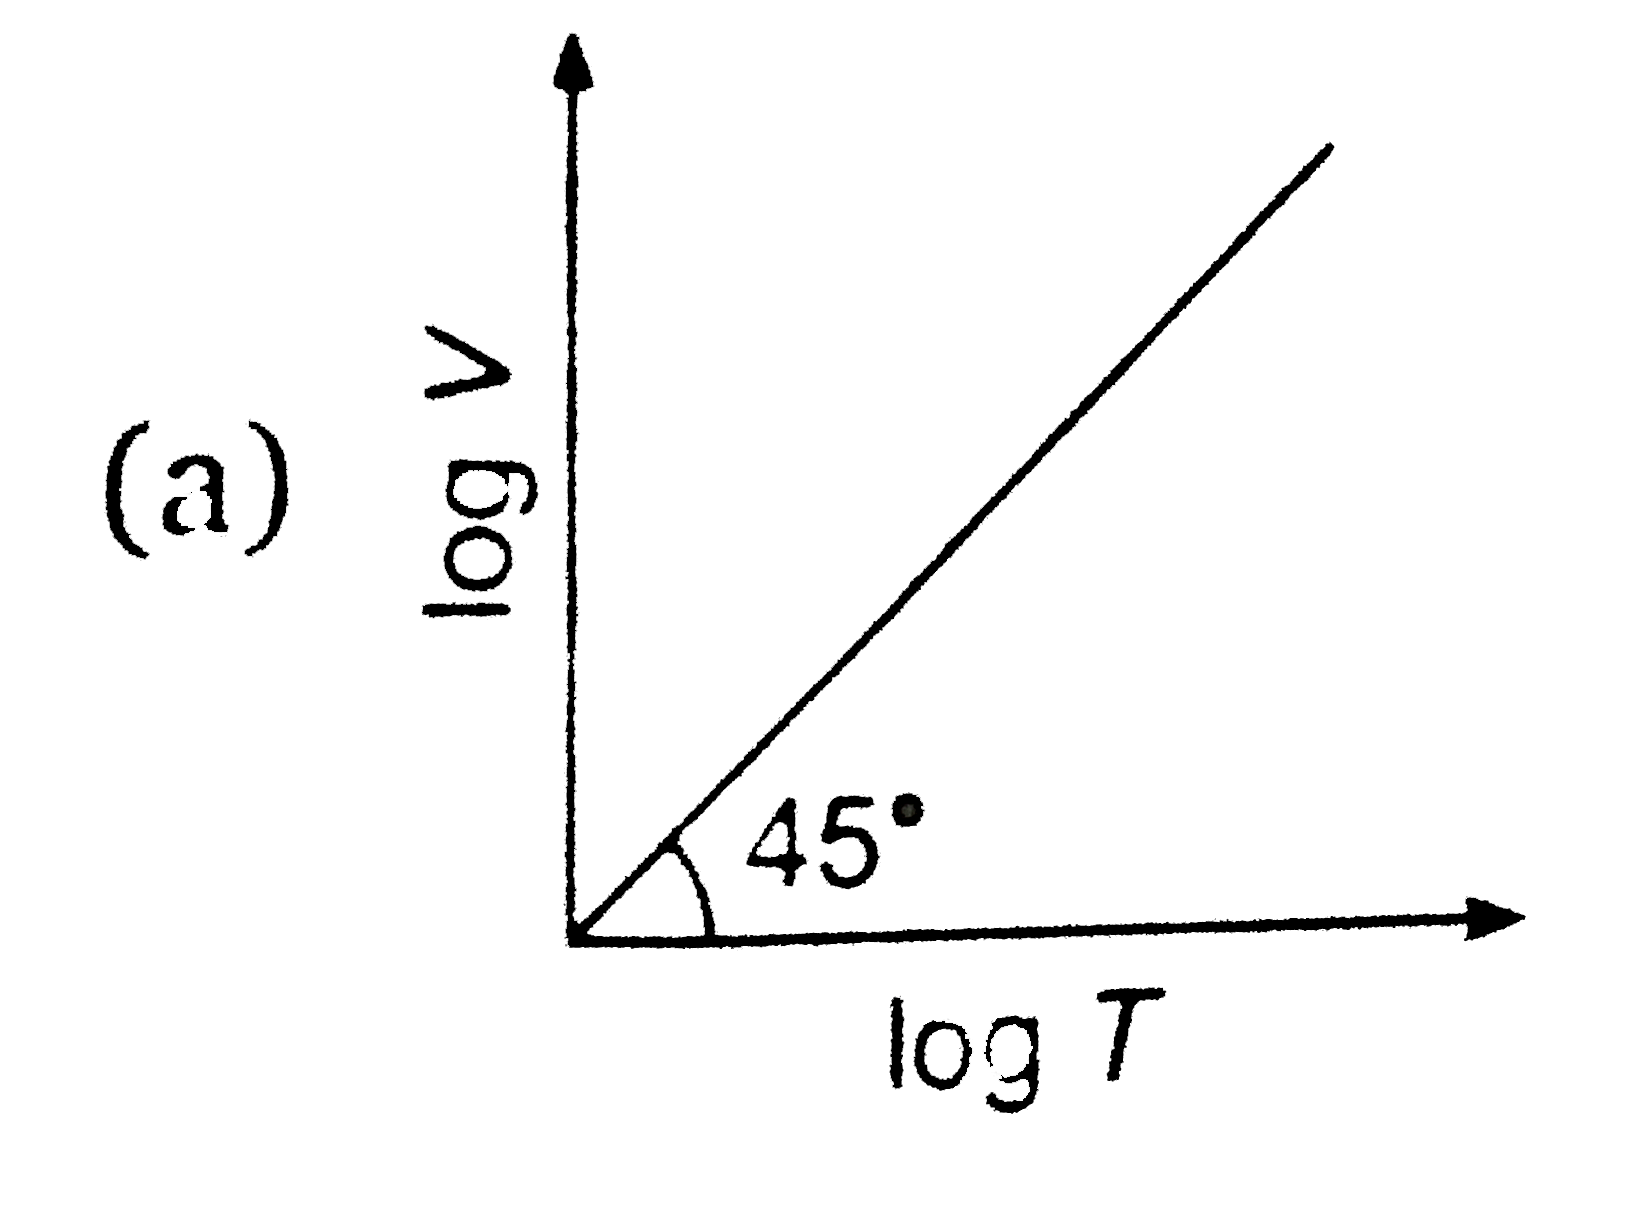
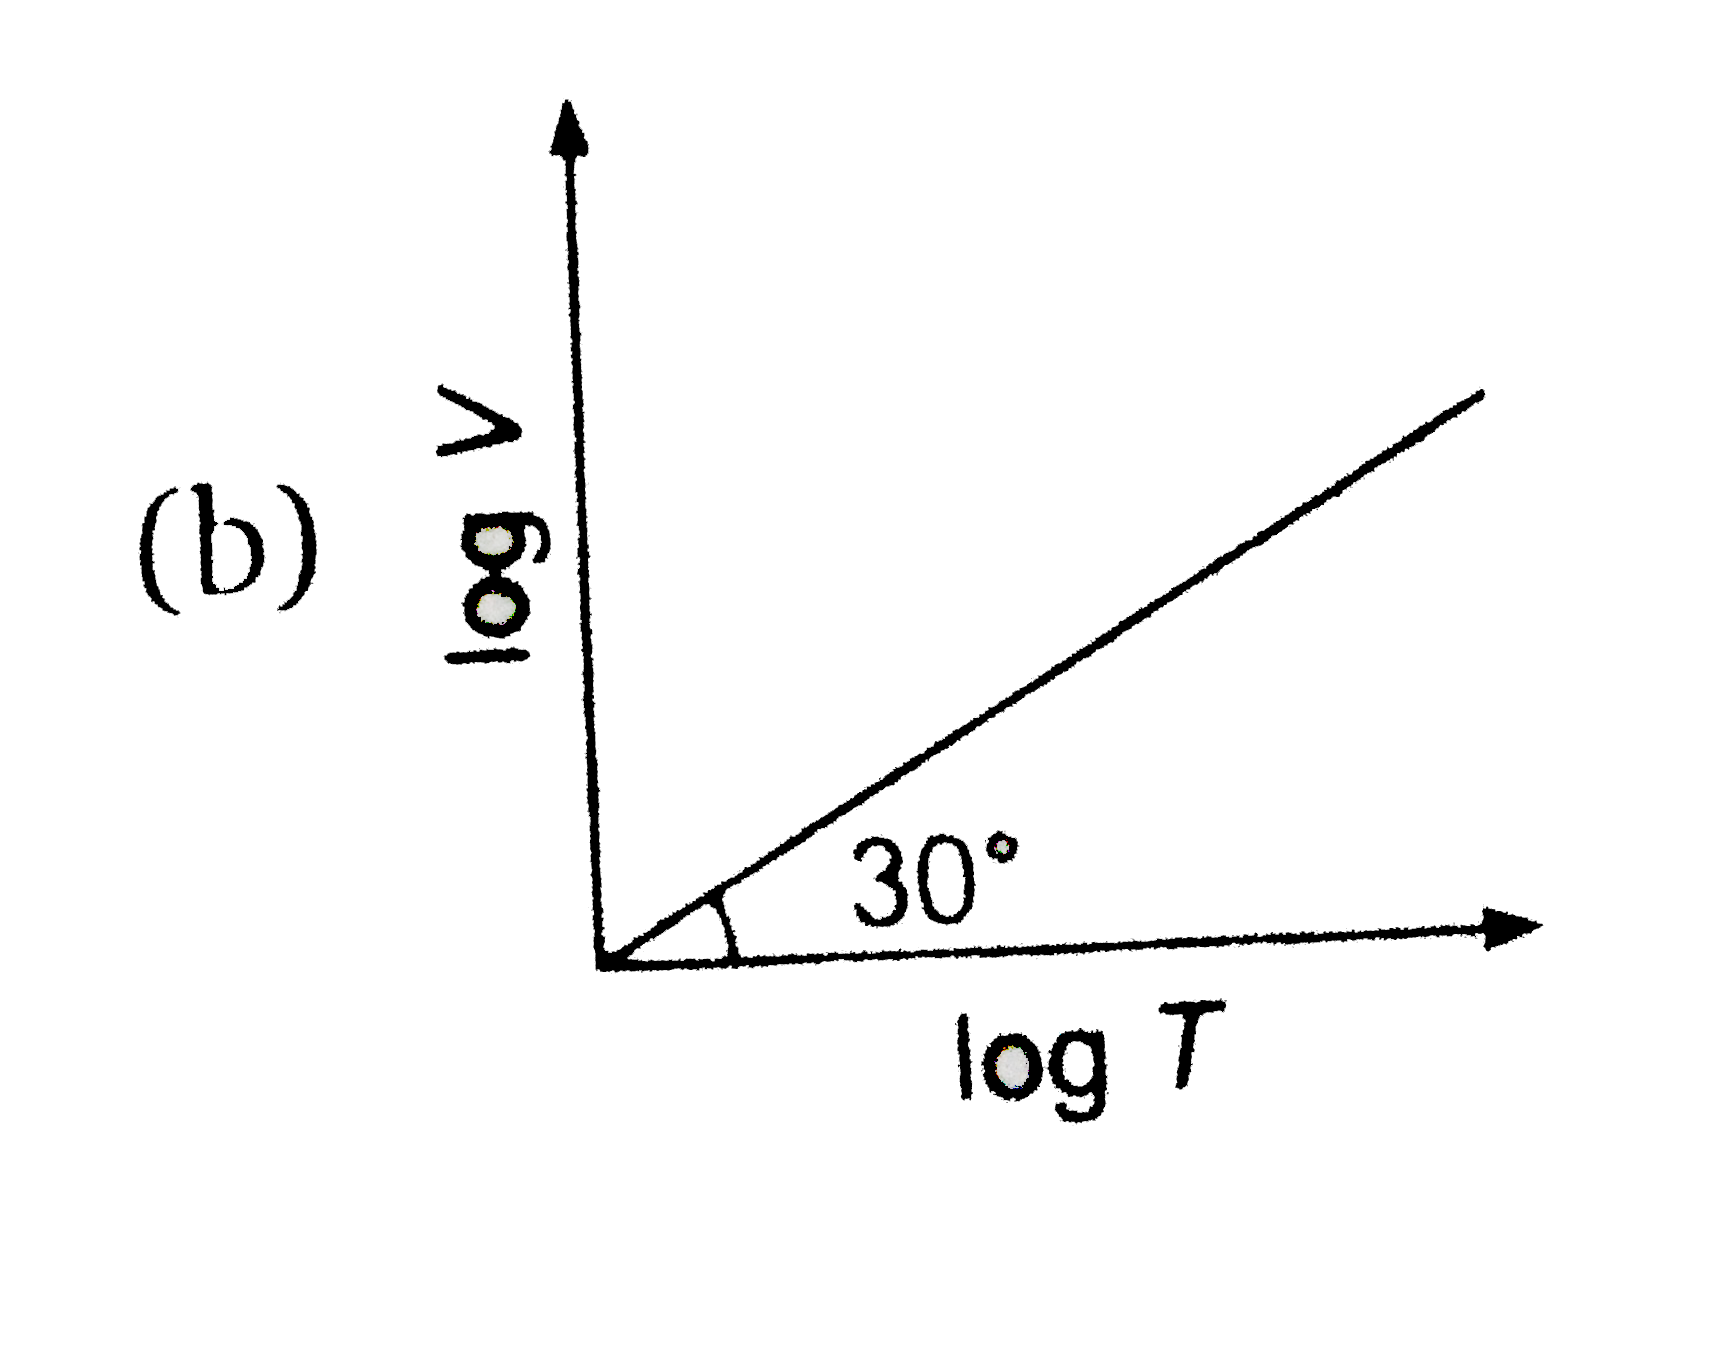
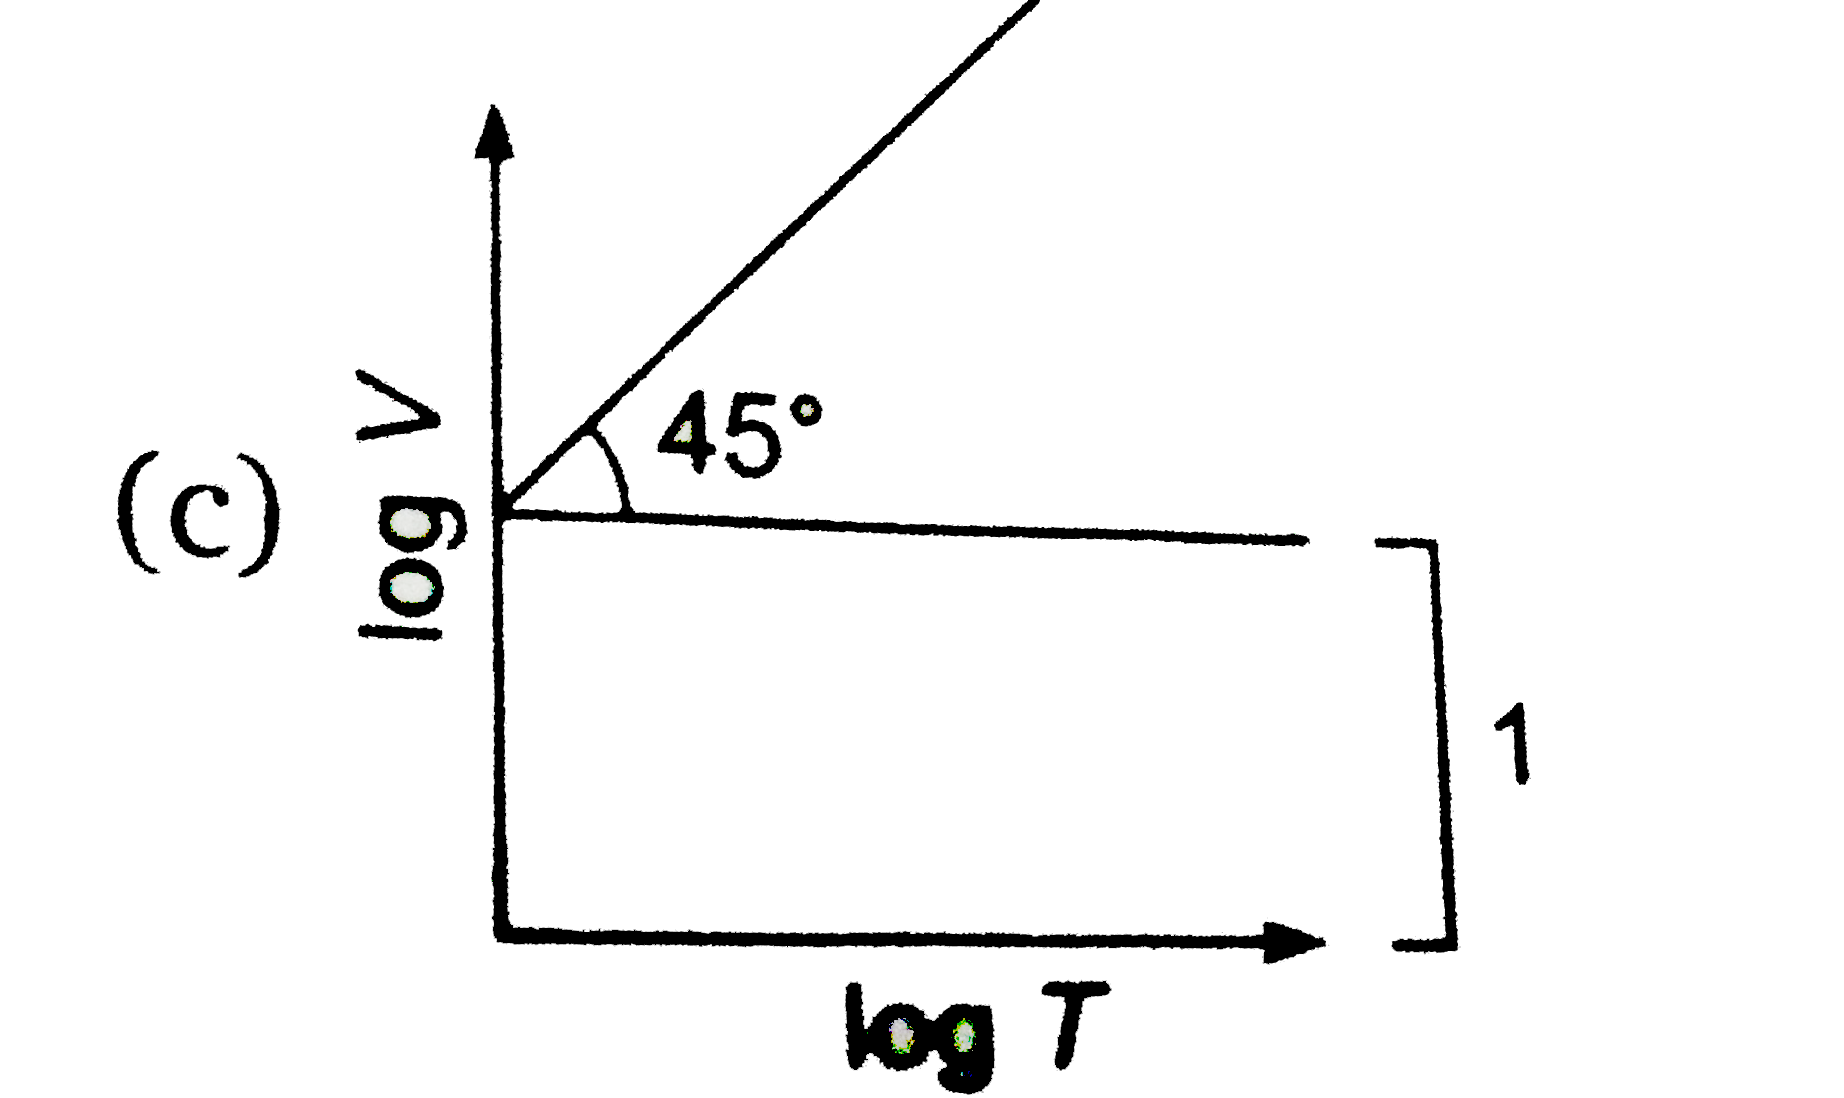
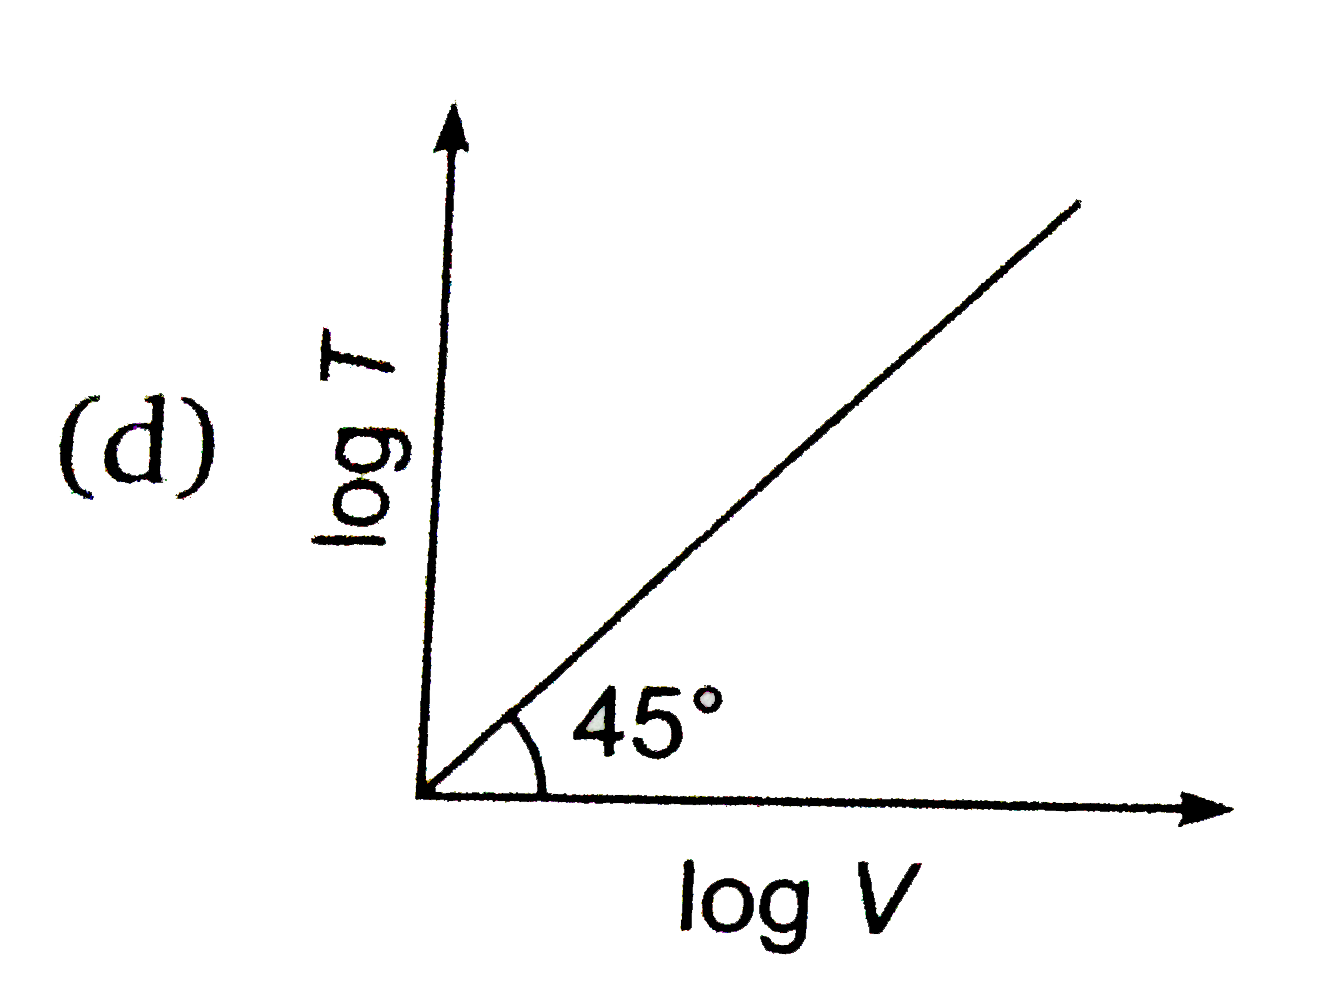
For a closed container containing 10 moles of an ideal gas, at constant pressure of 0.82 atm, which graph correctly represent, variation of log V us log T where volume is in litre and temp. in kelvin :


The correct Answer is:a
To solve the problem of determining which graph correctly represents the variation of log V versus log T for a closed container containing 10 moles of an ideal gas at a constant pressure of 0.82 atm, we can follow these steps:
1. Understand the Ideal Gas Law:
The ideal gas law is given by the equation:
PV=nRT
where P is pressure, V is volume, n is the number of moles, R is the ideal gas constant, and T is temperature.
2. Rearrange the Ideal Gas Law:
We need to express volume V in terms of temperature T. Rearranging the ideal gas law gives:
V=nRTP
3. Take the Logarithm of Both Sides:
To find the relationship between log V and log T, we take the logarithm of both sides:
logV=log(nRTP)
This can be expanded using properties of logarithms:
logV=log(nR)+logT−logP
4. Identify Constants:
Since n (10 moles), R (0.082 atm·L/(mol·K)), and P (0.82 atm) are constants, we can combine them:
logV=logT+constant
Here, the constant is log(nR/P).
5. Determine the Slope and Intercept:
The equation can be rewritten in the form:
logV=logT+constant
This indicates that the slope (m) is 1, and the y-intercept (C) is the constant value log(nR/P).
6. Calculate the Constant:
We can calculate the constant:
n=10,R=0.082,P=0.82
log(nRP)=log(10×0.0820.82)=log(1)=0
Thus, the y-intercept is 0.
7. Final Equation:
Therefore, we have:
logV=logT
This indicates a linear relationship with a slope of 1 and a y-intercept of 0.
8. Graph Interpretation:
The graph of logV versus logT will be a straight line passing through the origin (0,0) with a slope of 1, which corresponds to an angle of 45 degrees.
Conclusion:
The correct graph that represents the variation of log V versus log T is the one that shows a straight line with a slope of 1 and passes through the origin.
The ideal gas law is given by the equation:
PV=nRT
where P is pressure, V is volume, n is the number of moles, R is the ideal gas constant, and T is temperature.
We need to express volume V in terms of temperature T. Rearranging the ideal gas law gives:
V=nRTP
To find the relationship between log V and log T, we take the logarithm of both sides:
logV=log(nRTP)
This can be expanded using properties of logarithms:
logV=log(nR)+logT−logP
Since n (10 moles), R (0.082 atm·L/(mol·K)), and P (0.82 atm) are constants, we can combine them:
logV=logT+constant
Here, the constant is log(nR/P).
The equation can be rewritten in the form:
logV=logT+constant
This indicates that the slope (m) is 1, and the y-intercept (C) is the constant value log(nR/P).
We can calculate the constant:
n=10,R=0.082,P=0.82
log(nRP)=log(10×0.0820.82)=log(1)=0
Thus, the y-intercept is 0.
Therefore, we have:
logV=logT
This indicates a linear relationship with a slope of 1 and a y-intercept of 0.
The graph of logV versus logT will be a straight line passing through the origin (0,0) with a slope of 1, which corresponds to an angle of 45 degrees.
The correct graph that represents the variation of log V versus log T is the one that shows a straight line with a slope of 1 and passes through the origin.
Topper's Solved these Questions
- GASEOUS STATEBOOK - NARENDRA AWASTHI ENGLISHCHAPTER - GASEOUS STATEEXERCISE - Level 2
30 Videos
- GASEOUS STATEBOOK - NARENDRA AWASTHI ENGLISHCHAPTER - GASEOUS STATEEXERCISE - Level 3 Passage 1
4 Videos
- ELECTROCHEMISTRYBOOK - NARENDRA AWASTHI ENGLISHCHAPTER - ELECTROCHEMISTRYEXERCISE - Subjective problems
14 Videos
- IONIC EEQUILIBRIUMBOOK - NARENDRA AWASTHI ENGLISHCHAPTER - IONIC EEQUILIBRIUMEXERCISE - Subjective problems
1 Videos
Similar Questions
For a closed container containing 100 mol of an ideal gas fitted with movable, frictionless, weightless piston operating such that pressure of gas remain constant at 8.21 atm, which graph repsents correct variation of log Vv/s log T where V is in litre and T is in Kelvin ? (R=0.0821atmLmolK)
View SolutionIf heat energy is given to an ideal gas at constant pressure, then select the graph which best represents the variation of VT with temperature (T).
View Solution
Knowledge Check
An inflated rubber balloon contains one mole of an ideal gas has a pressure p, volume V and temperature T. if the temperature rises to 1.1 T, and the volume is increased to 1.05 V, the final pressure will be
A1.1 PBPCless than PDbetween P and 1.1 P.
Ten moles of an ideal gas are filled in a closed vessel. The vessel has cylinder and piston type arrangement and pressure of the gas remains constant at 0.821 atm. Which of the following graph represents correct variation of log V vs log T?
(V = Volume in litre and T = temperature in Kelvin)
View SolutionWhich of the following graphs correctly represents the variation of β=−dV/dPV
with P for an ideal gas at constant temperature?
View SolutionWhich of the following graphs correctly represents the variation of β=−(dVdP)/V with P for an ideal gas at constant temperature
View SolutionWhich of the following graphs correctly represents the variation of β=−dV/dPV
with P for an ideal gas at constant temperature?
View SolutionAn inflated rubber ballon contains one mole of an ideal gas , has a pressure P, volume V and temperature T. If the temperature rises to 1.1 T, and the volume isincreased to 1.05 V, the final pressure will be
View SolutionAn inflated rubber balloon contains one mole of an ideal gas has a pressure p, volume V and temperature T. if the temperature rises to 1.1 T, and the volume is increased to 1.05 V, the final pressure will be
View SolutionA sample of certain mas s of an ideal polyatomic gas is expanded against constant pressure of 1 atm adiabatically from volume 2L , pressure 6 atm and temperature 300K to state where its final volume is 8L . Then calculate entropy change (in J/k) in the process.(Neglect vibrational degress of freedom)[1 L atm = 100 J ,log 2 =0.3 , log 3 = 0.48 , log e = 2.3] (approximate integer)
View Solution
