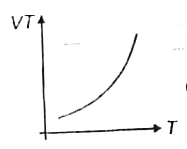
If heat energy is given to an ideal gas at constant pressure, then select the graph which best represents the variation of VT with temperature (T).


The correct Answer is:A
To solve the problem of how the volume times temperature (VT) varies with temperature (T) for an ideal gas at constant pressure, we can follow these steps:
1. Understand the Ideal Gas Law:
The ideal gas law is given by the equation:
PV=nRT
where P is pressure, V is volume, n is the number of moles, R is the gas constant, and T is temperature.
2. Identify the Condition of the Problem:
The problem states that heat energy is given to the gas at constant pressure. This means that P remains constant.
3. Rearranging the Ideal Gas Law:
Since pressure is constant, we can rearrange the ideal gas law to express volume V in terms of temperature T:
V=nRTP
Here, nRP is a constant (let's call it k). Thus, we can express V as:
V=kT
4. Finding the Expression for VT:
We want to find the relationship between VT and T. We can multiply both sides of the equation V=kT by T:
VT=kT2
5. Analyzing the Relationship:
The equation VT=kT2 indicates that VT is directly proportional to T2. This means that as temperature T increases, VT increases with the square of the temperature.
6. Graphical Representation:
The relationship VT∝T2 can be represented graphically. If we plot VT on the y-axis and T on the x-axis, the graph will be a parabola opening upwards, since it is a quadratic relationship.
7. Conclusion:
Therefore, the graph that best represents the variation of VT with temperature T is a parabola that opens upwards.
Final Answer:
The correct option is the graph that represents an upward parabola.
---
The ideal gas law is given by the equation:
PV=nRT
where P is pressure, V is volume, n is the number of moles, R is the gas constant, and T is temperature.
The problem states that heat energy is given to the gas at constant pressure. This means that P remains constant.
Since pressure is constant, we can rearrange the ideal gas law to express volume V in terms of temperature T:
V=nRTP
Here, nRP is a constant (let's call it k). Thus, we can express V as:
V=kT
We want to find the relationship between VT and T. We can multiply both sides of the equation V=kT by T:
VT=kT2
The equation VT=kT2 indicates that VT is directly proportional to T2. This means that as temperature T increases, VT increases with the square of the temperature.
The relationship VT∝T2 can be represented graphically. If we plot VT on the y-axis and T on the x-axis, the graph will be a parabola opening upwards, since it is a quadratic relationship.
Therefore, the graph that best represents the variation of VT with temperature T is a parabola that opens upwards.
The correct option is the graph that represents an upward parabola.
Topper's Solved these Questions
- KINETIC THEORYBOOK - AAKASH INSTITUTE ENGLISHCHAPTER - KINETIC THEORYEXERCISE - EXERCISE (ASSIGNMENT) SECTION - C Previous Years Questions
21 Videos
- KINETIC THEORYBOOK - AAKASH INSTITUTE ENGLISHCHAPTER - KINETIC THEORYEXERCISE - EXERCISE (ASSIGNMENT) SECTION - D Assertion - Reason Type Questions
10 Videos
- KINETIC THEORYBOOK - AAKASH INSTITUTE ENGLISHCHAPTER - KINETIC THEORYEXERCISE - EXERCISE (ASSIGNMENT) SECTION - A Objective Type Questions
30 Videos
- GRAVITATION BOOK - AAKASH INSTITUTE ENGLISHCHAPTER - GRAVITATION EXERCISE - ASSIGNMENT SECTION - D (ASSERTION-REASON TYPE QUESTIONS)
15 Videos
- LAWS OF MOTIONBOOK - AAKASH INSTITUTE ENGLISHCHAPTER - LAWS OF MOTIONEXERCISE - Assignment (SECTION-D) (Assertion-Reason Type Questions)
15 Videos
Similar Questions
If an ideal gas is heated at constant pressure :
View SolutionHeat supplied to an ideal gas sample at constant Pressure :
View SolutionIf 21 J of heat energy is supplied to an ideal diatomic gas at constant pressure, then the change in its energy is
View SolutionFor a closed container containing 10 moles of an ideal gas, at constant pressure of 0.82 atm, which graph correctly represent, variation of log V us log T where volume is in litre and temp. in kelvin :
View SolutionThe graph which represents the variation of mean kinetic energy of moleules with temperature ∘C is ?
View SolutionWhich of the following graph represents the variation of resistivity (ρ) with temperature (T) for copper?
View SolutionLiquid oxygen at 50K is heated to 300K at constant pressure of 1atm. The rate of heating is constant. Which of the following graphs represents the variation of temperature with time?
View SolutionWhich of the following graphs best represents the variation of acceleration 'a' with displacement x?
View SolutionWhich of the following curve represent variation of density of water with temperature best-
View SolutionThe volume-temperature graphs of a given mass of an ideal gas at constant pressure are shown below. What is the correct order of pressure ?

View Solution
