From the below graph, Explain the variation of molar conductance of a weak electrolyte with decrease in concentration.

For a weak electrolyte, at high concentration, the plot is almost parallel to concentration axis with slight increase in conductivity as the dilution increases. When the concentration approaches zero, there is a sudden increase in the molar conductance and the curve is almost parallel to ∧m axis. This is due to the fact that the dissociation of the weak electrolyte increases with the increase in dilution (Ostwald dilution law).
Topper's Solved these Questions
- ELECTRO CHEMISTRYBook:SURA PUBLICATIONChapter:ELECTRO CHEMISTRYExercise:ADDITIONAL QUESTION AND ANSWERS (LONG ANSWER)
Explore 6 Videos
- ELECTRO CHEMISTRYBook:SURA PUBLICATIONChapter:ELECTRO CHEMISTRYExercise:PROBLEMS FOR PRACTICE
Explore 20 Videos
- ELECTRO CHEMISTRYBook:SURA PUBLICATIONChapter:ELECTRO CHEMISTRYExercise:ADDITIONAL QUESTION AND ANSWERS (VERY SHORT ANSWER)
Explore 56 Videos
- CO-ORDINATION CHEMISTRY Book:SURA PUBLICATIONChapter:CO-ORDINATION CHEMISTRY Exercise:LONG ANSWER
Explore 1 Video
- GOVT. MODEL QUESTION PAPER - 2019-2020 Book:SURA PUBLICATIONChapter:GOVT. MODEL QUESTION PAPER - 2019-2020 Exercise:Part_IV
Explore 10 Videos
Similar Questions
Knowledge Check
The variation of equivalent conductance of a weak electrolyte with (concentration)1/2 is represented as
A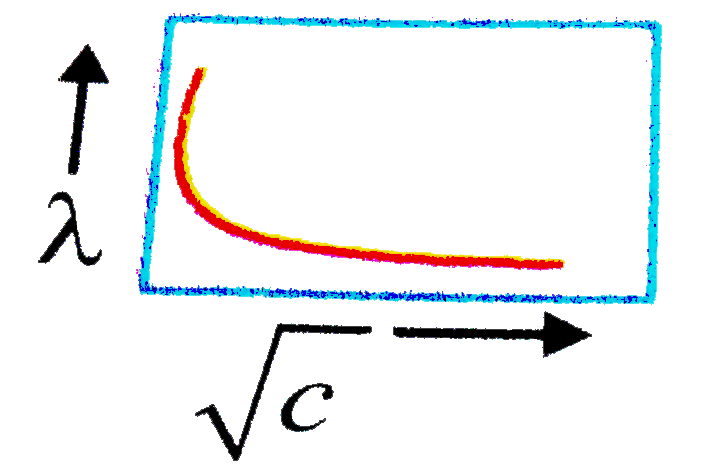 B
B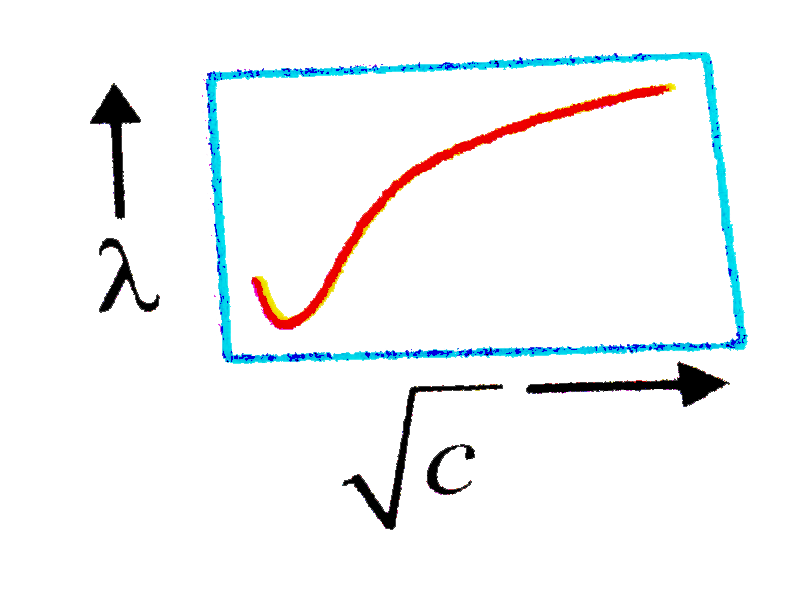 C
C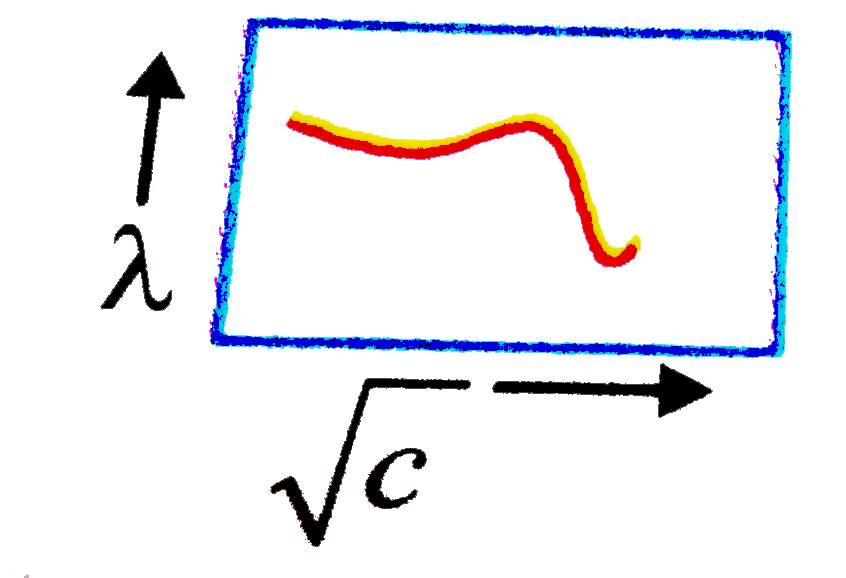 D
D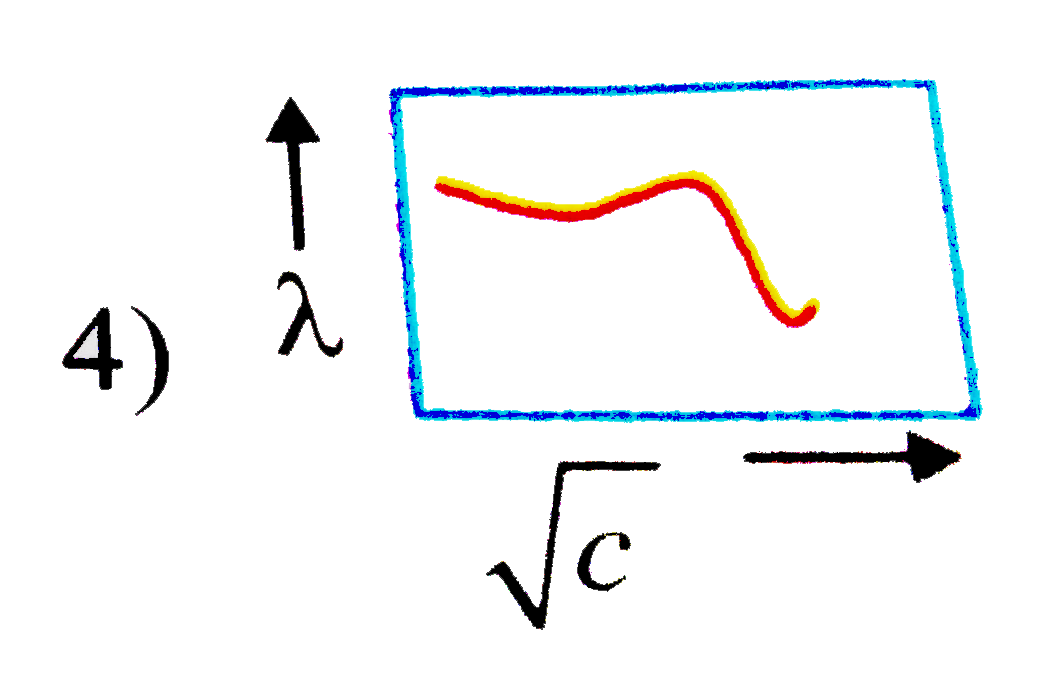
Which of the following graph correctly represents the variation of molar conductance (Δm) with dilution for a strong electrolyte ?
A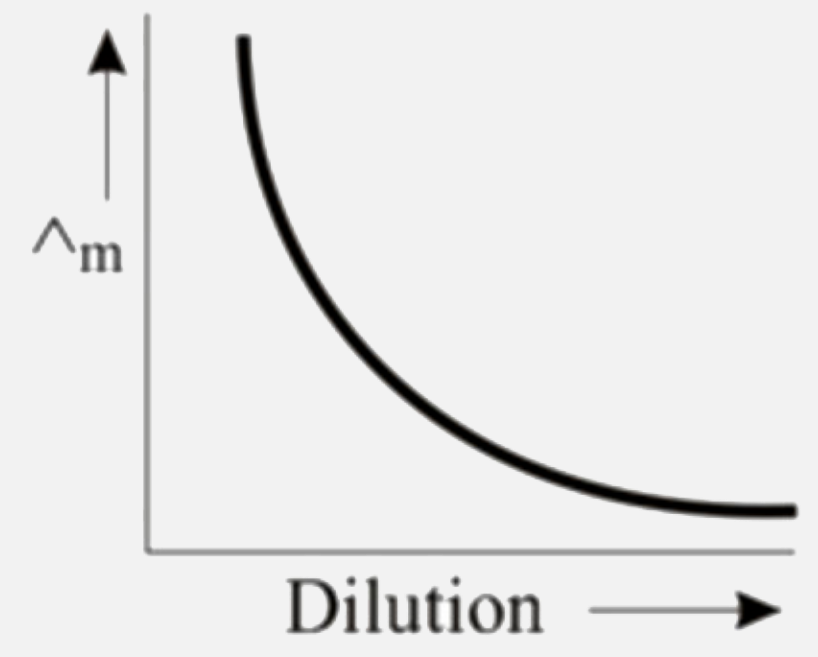 B
B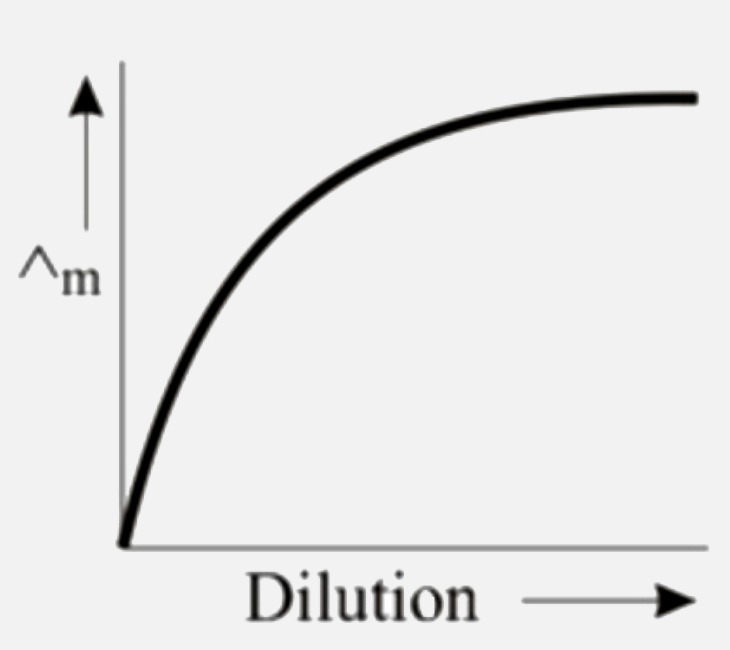 C
C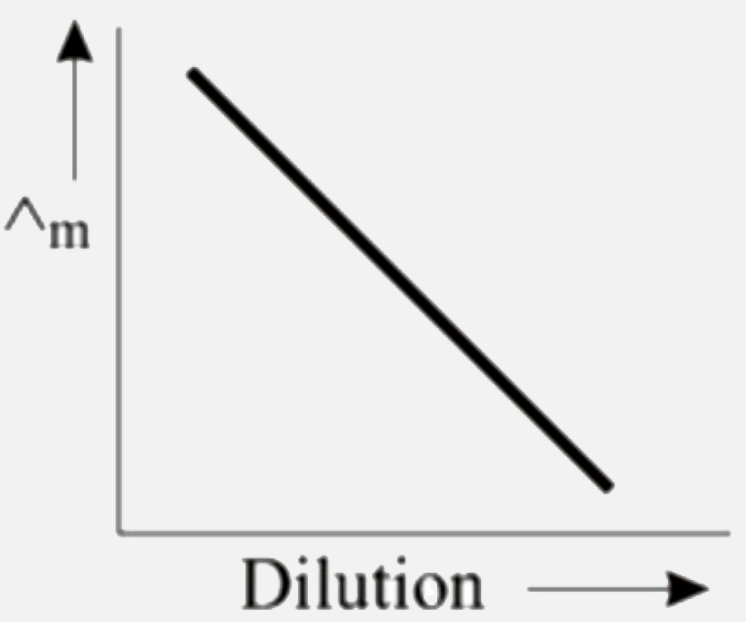 D
D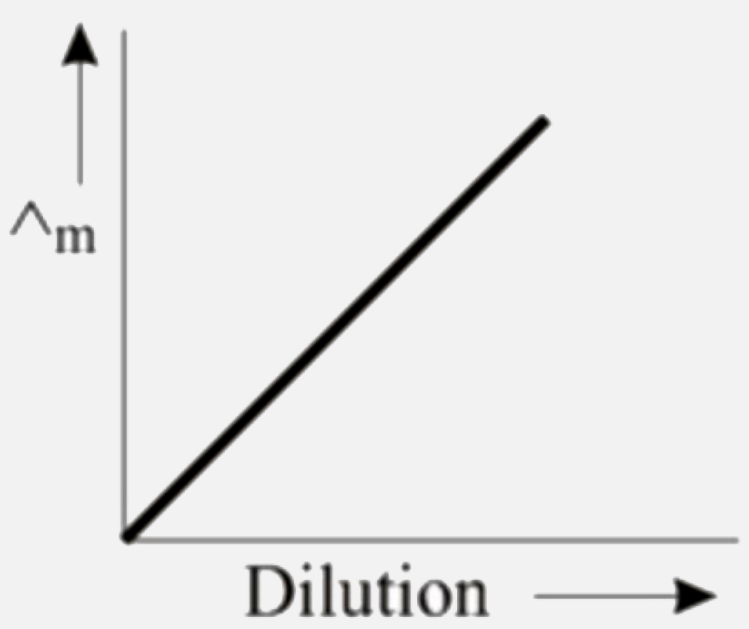
Explain the variation of molar conductivity with concentration for strong and weak electrolytes.
View SolutionAssertion:Molar conductivity increases with decrease in concentration.
Reason:Conductivity always decrease with decrease in concentration.
View SolutionDefine limiting molar conductivity. Why does conductivity of an electrolyte decrease with discrease in concentration.
View SolutionWhich of the following graph correctly represents the variation of molar conductance (Δm) with dilution for a strong electrolyte ?
View SolutionWhat is the effect of decreasing concentration on the molar conductivity of a weak electrolyte?
View SolutionWhat is the effect of decreasing concentration on the molar conductivity of weak electrolyte ?
View Solution
