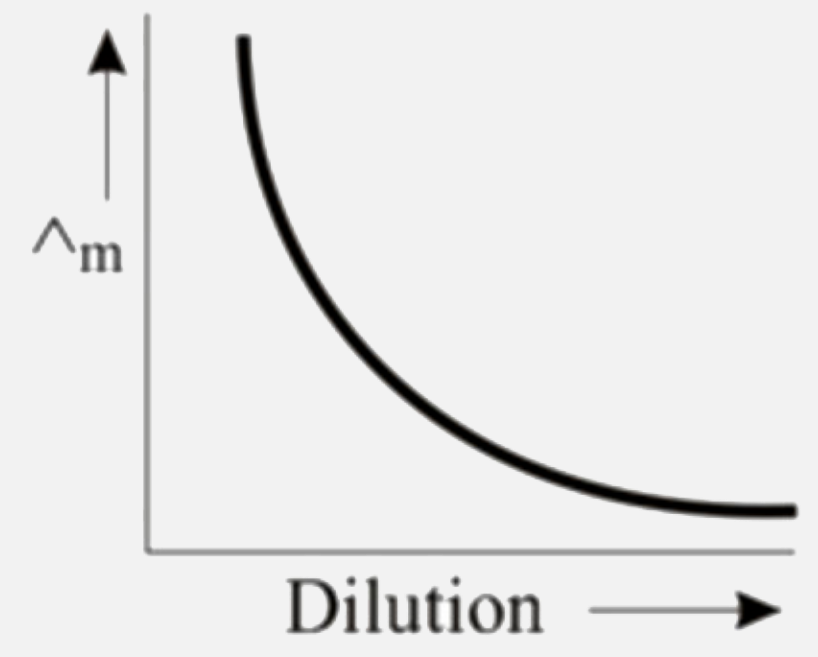
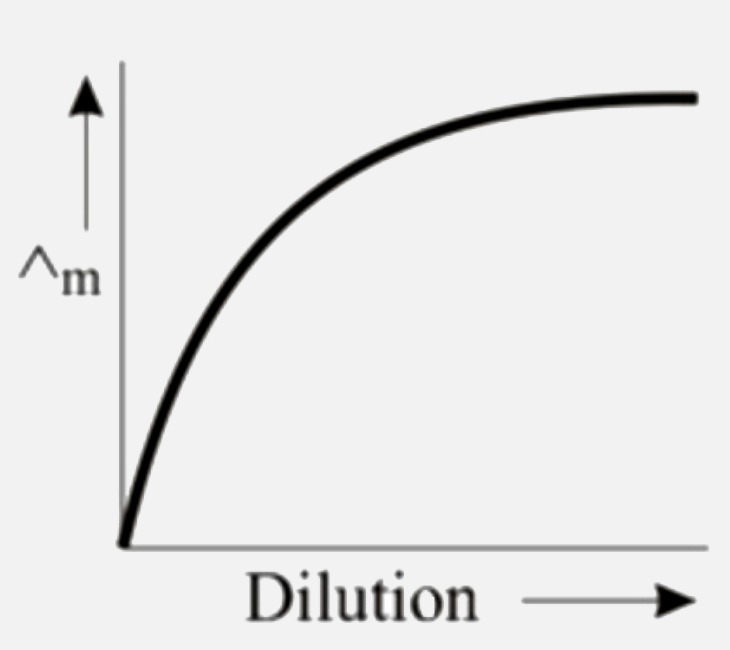
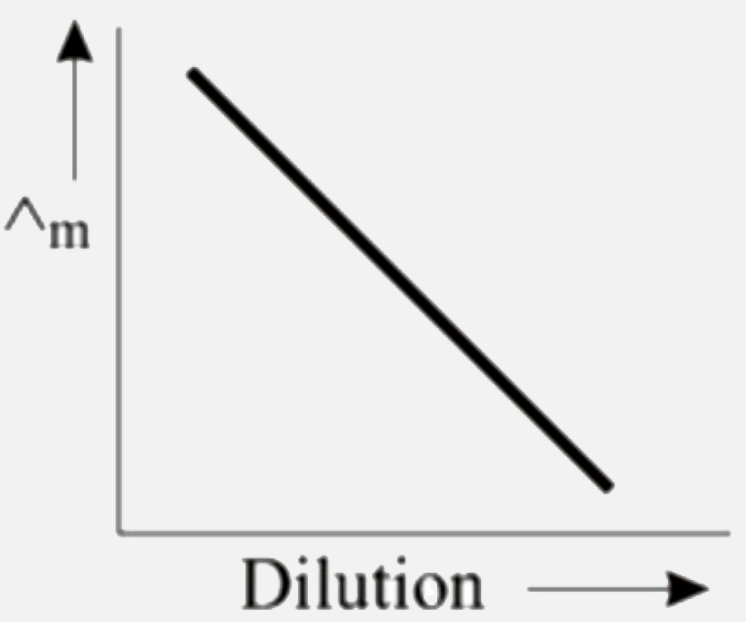
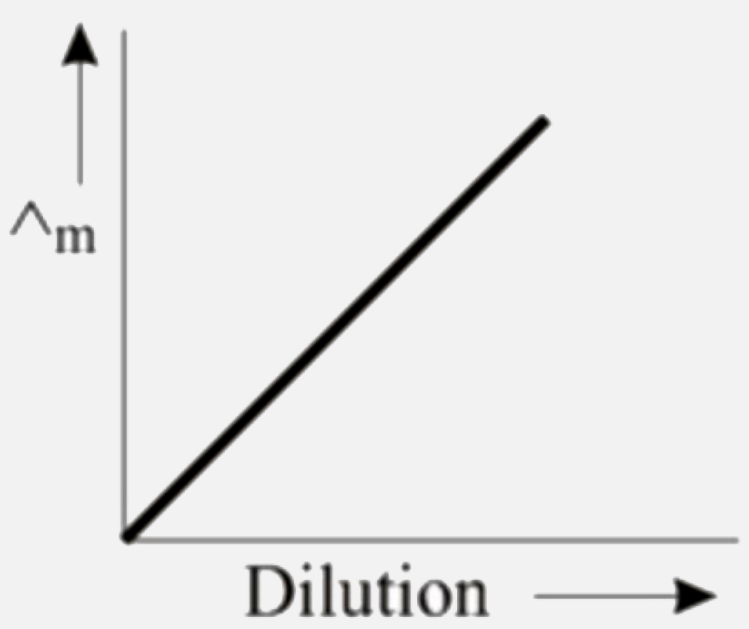
Which of the following graph correctly represents the variation of molar conductance (Δm) with dilution for a strong electrolyte ?
The correct Answer is:B
To solve the question regarding the variation of molar conductance (Δ_m) with dilution for a strong electrolyte, we will follow these steps:
Step 1: Understand the Concept of Molar Conductance
Molar conductance (Δ_m) is a measure of the ability of an electrolyte solution to conduct electricity. It depends on the concentration of the electrolyte in solution.
Step 2: Apply the Debye-Hückel-Onsager Equation
The relationship between molar conductance (Δ_m), molar conductance at infinite dilution (Δ_m0), and concentration (C) is given by the Debye-Hückel-Onsager equation:
Δm=Δm0−b⋅v⋅C
Where:
- Δ_m = Molar conductance at concentration C
- Δ_m0 = Molar conductance at infinite dilution
- b = Debye constant
- v = Valency of the electrolyte
- C = Concentration of the electrolyte
Step 3: Analyze the Effect of Dilution
When a strong electrolyte is diluted:
- The concentration (C) decreases.
- According to the equation, as C decreases, the term b⋅v⋅C also decreases.
- Therefore, Δ_m increases and approaches Δ_m0 as the solution is diluted.
Step 4: Determine the Graphical Representation
- As the concentration decreases, Δ_m increases and approaches a maximum value (Δ_m0).
- The correct graph should show an increase in molar conductance with dilution, reaching a plateau at Δ_m0.
Step 5: Evaluate the Options
- Option 1: Shows a decrease in Δ_m with dilution (incorrect).
- Option 2: Shows an increase in Δ_m with dilution, reaching Δ_m0 (correct).
- Option 3: Shows a decrease in Δ_m with dilution (incorrect).
- Option 4: Shows an increase but does not reach Δ_m0 (incorrect).
Conclusion
The correct option that represents the variation of molar conductance with dilution for a strong electrolyte is Option 2.
---
Molar conductance (Δ_m) is a measure of the ability of an electrolyte solution to conduct electricity. It depends on the concentration of the electrolyte in solution.
The relationship between molar conductance (Δ_m), molar conductance at infinite dilution (Δ_m0), and concentration (C) is given by the Debye-Hückel-Onsager equation:
Δm=Δm0−b⋅v⋅C
Where:
- Δ_m = Molar conductance at concentration C
- Δ_m0 = Molar conductance at infinite dilution
- b = Debye constant
- v = Valency of the electrolyte
- C = Concentration of the electrolyte
When a strong electrolyte is diluted:
- The concentration (C) decreases.
- According to the equation, as C decreases, the term b⋅v⋅C also decreases.
- Therefore, Δ_m increases and approaches Δ_m0 as the solution is diluted.
- As the concentration decreases, Δ_m increases and approaches a maximum value (Δ_m0).
- The correct graph should show an increase in molar conductance with dilution, reaching a plateau at Δ_m0.
- Option 1: Shows a decrease in Δ_m with dilution (incorrect).
- Option 2: Shows an increase in Δ_m with dilution, reaching Δ_m0 (correct).
- Option 3: Shows a decrease in Δ_m with dilution (incorrect).
- Option 4: Shows an increase but does not reach Δ_m0 (incorrect).
The correct option that represents the variation of molar conductance with dilution for a strong electrolyte is Option 2.
Similar Questions
Knowledge Check
Dilute acids are strong electrolytes. Why?
AProduce the large number of hydronium ionsBProduce the smaller number of hydronium ionsCProduce the large number of hydrogen ionsDProduce the large number of copper ionsWithin elastic limit, which of the following graphs correctly represents the variation of extension in the length of wire with the external load?
A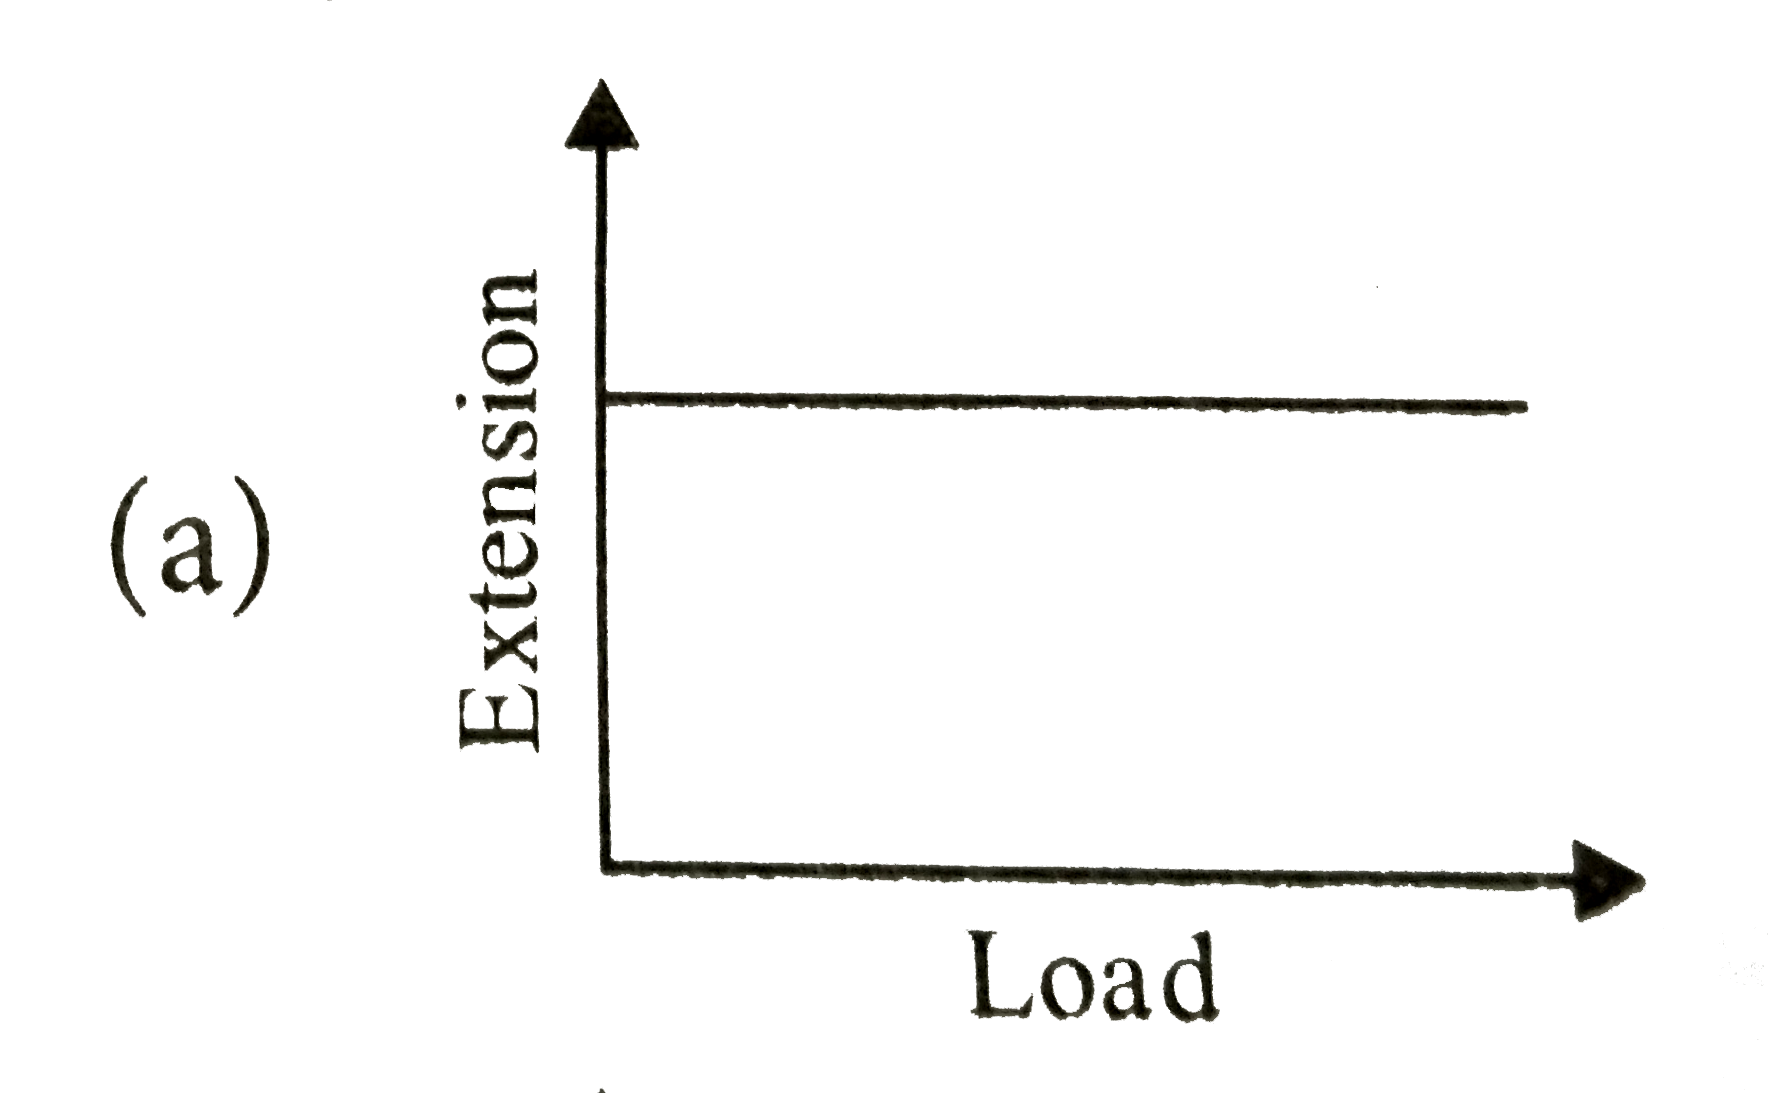 B
B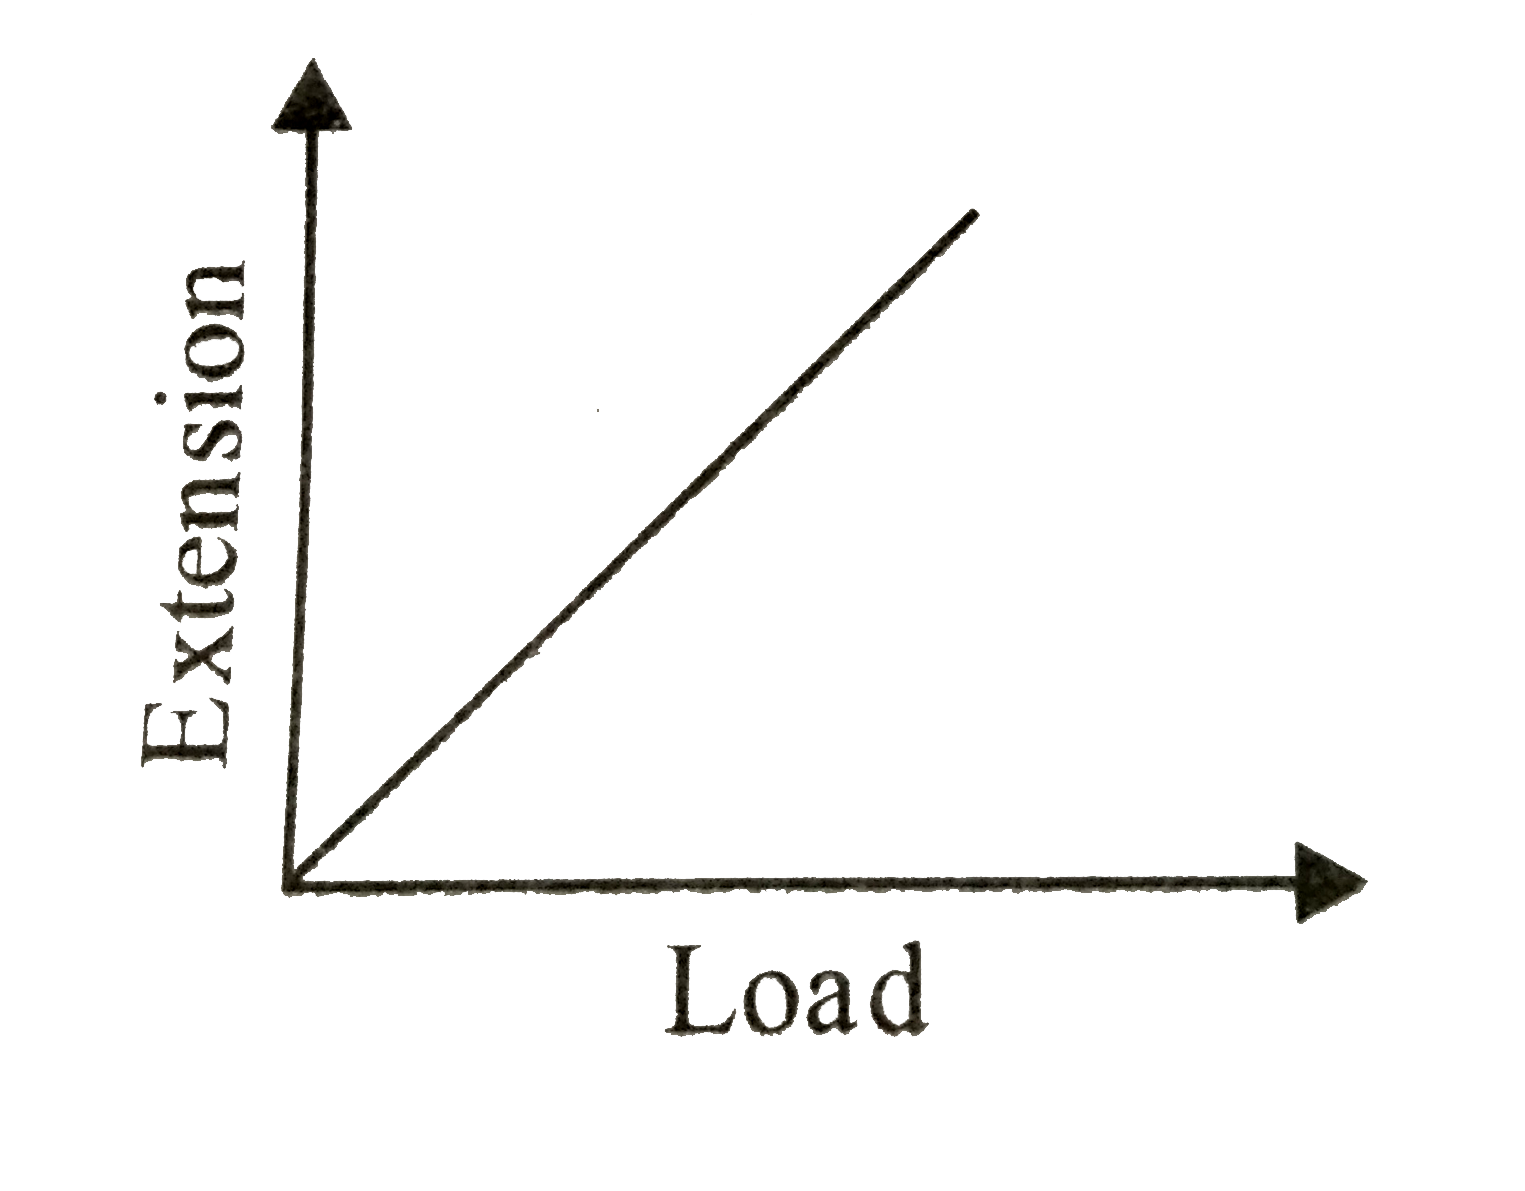 C
C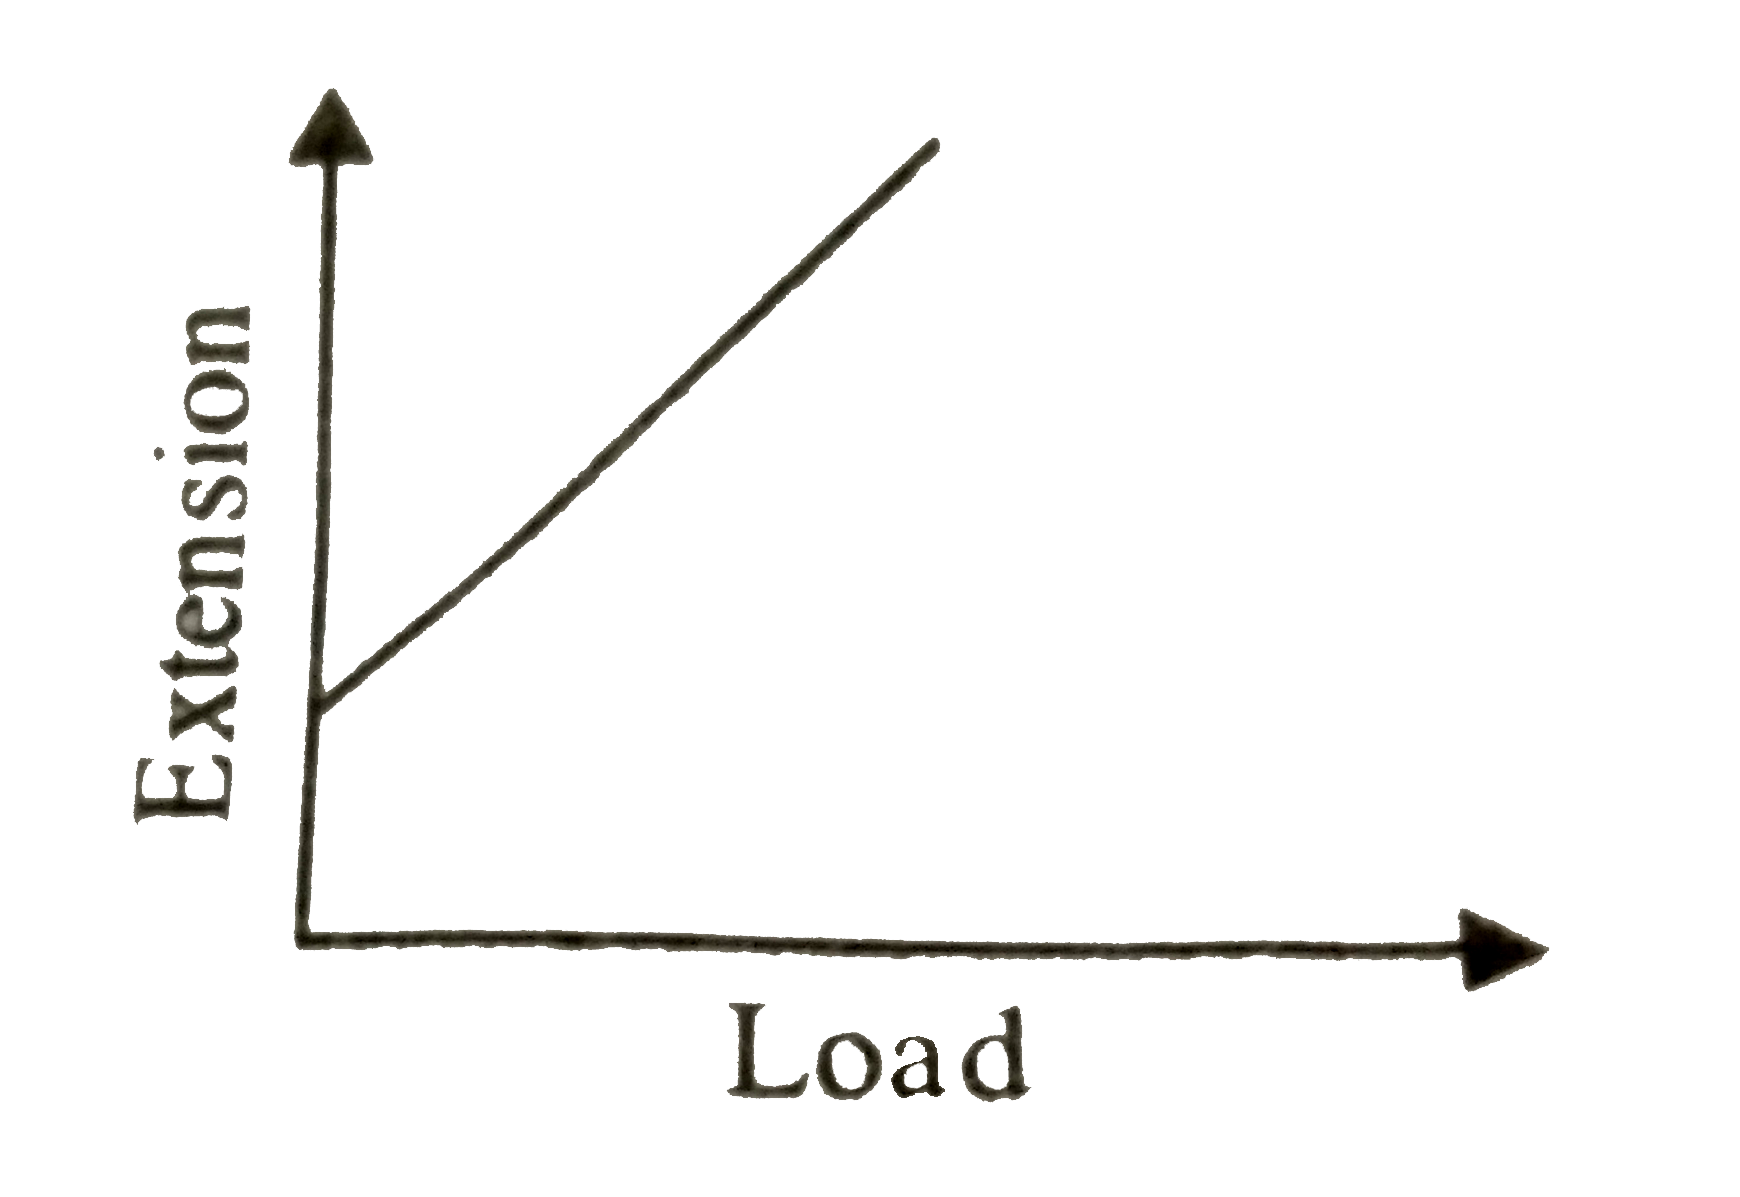 D
D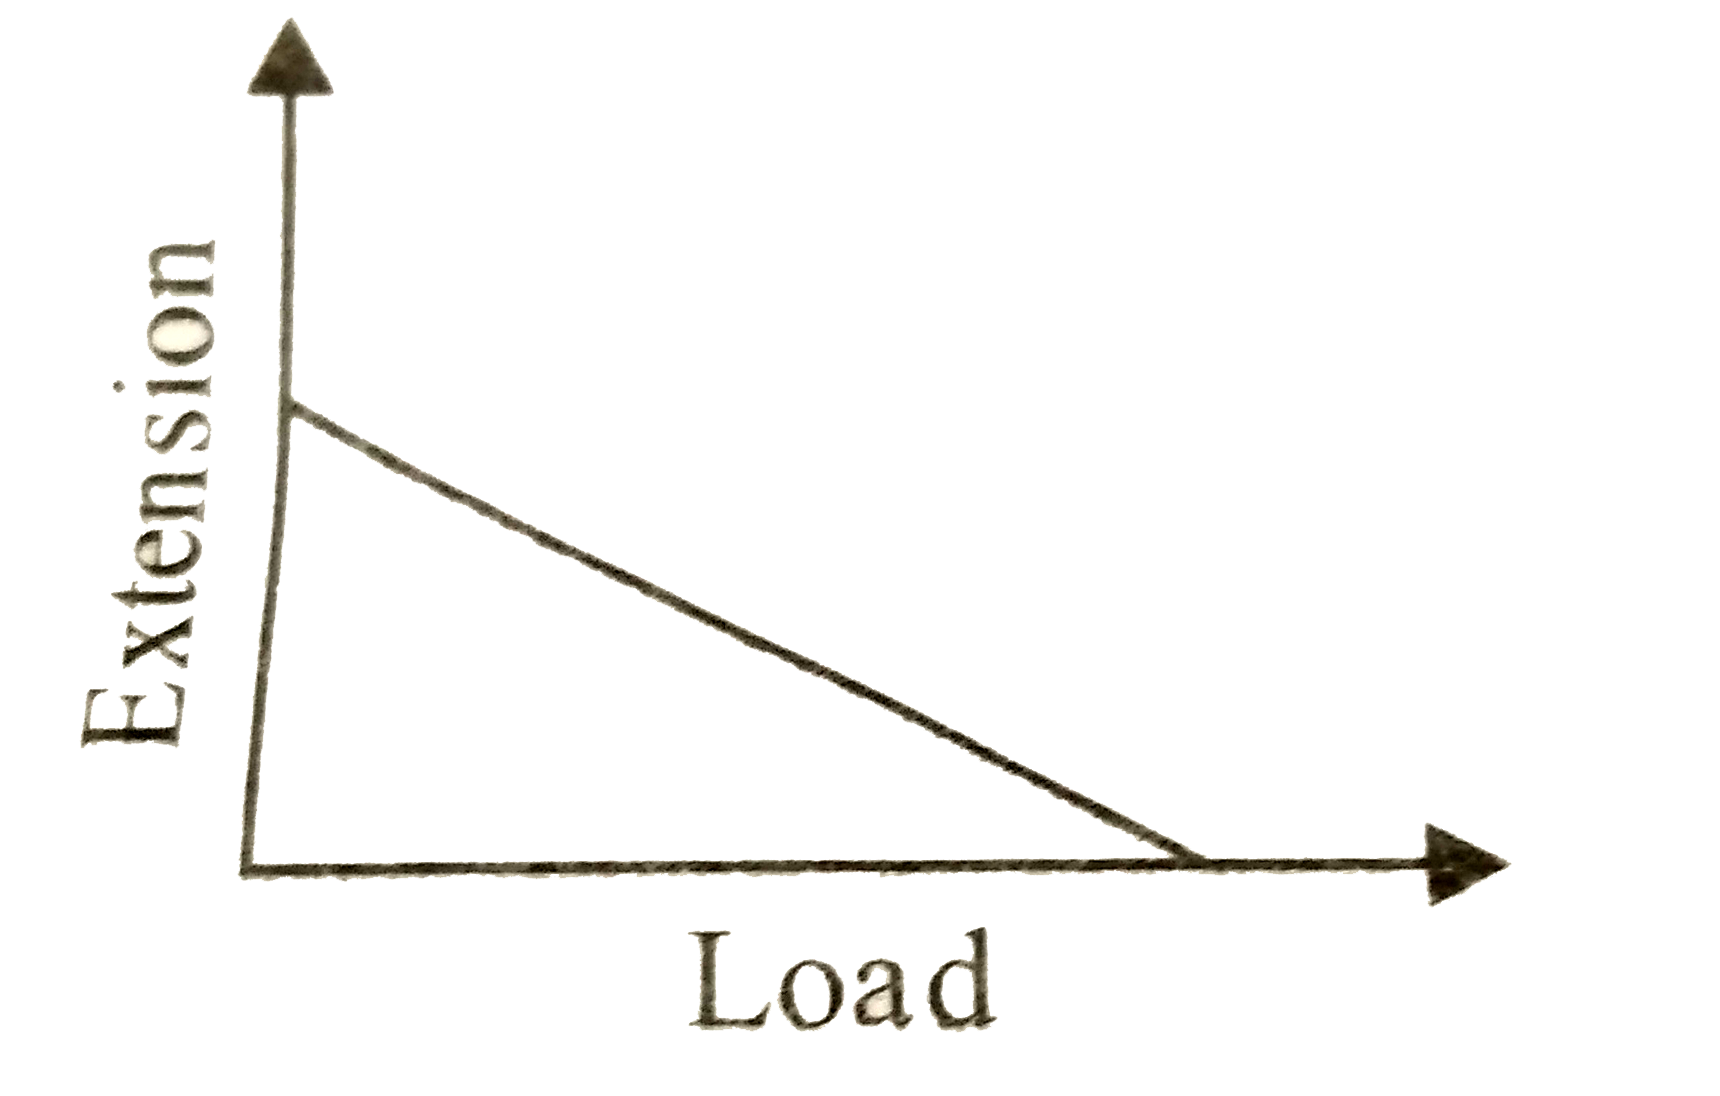
The conductivity of a strong electrolyte:
View SolutionWhich of the following graphs best represents the variation of acceleration 'a' with displacement x?
View SolutionWhich of the following graphs correctly represents the variation of β=−dV/dPV
with P for an ideal gas at constant temperature?
View SolutionWhich of the following graphs correctly represents the variation of β=−dV/dPV
with P for an ideal gas at constant temperature?
View SolutionWhich of the following graphs correctly represents the variation of β=−(dVdP)/V with P for an ideal gas at constant temperature
View SolutionWhich of the following curves correctly represent the variation of capacitve reactance (XC) with frequency (f) ?
View Solution
