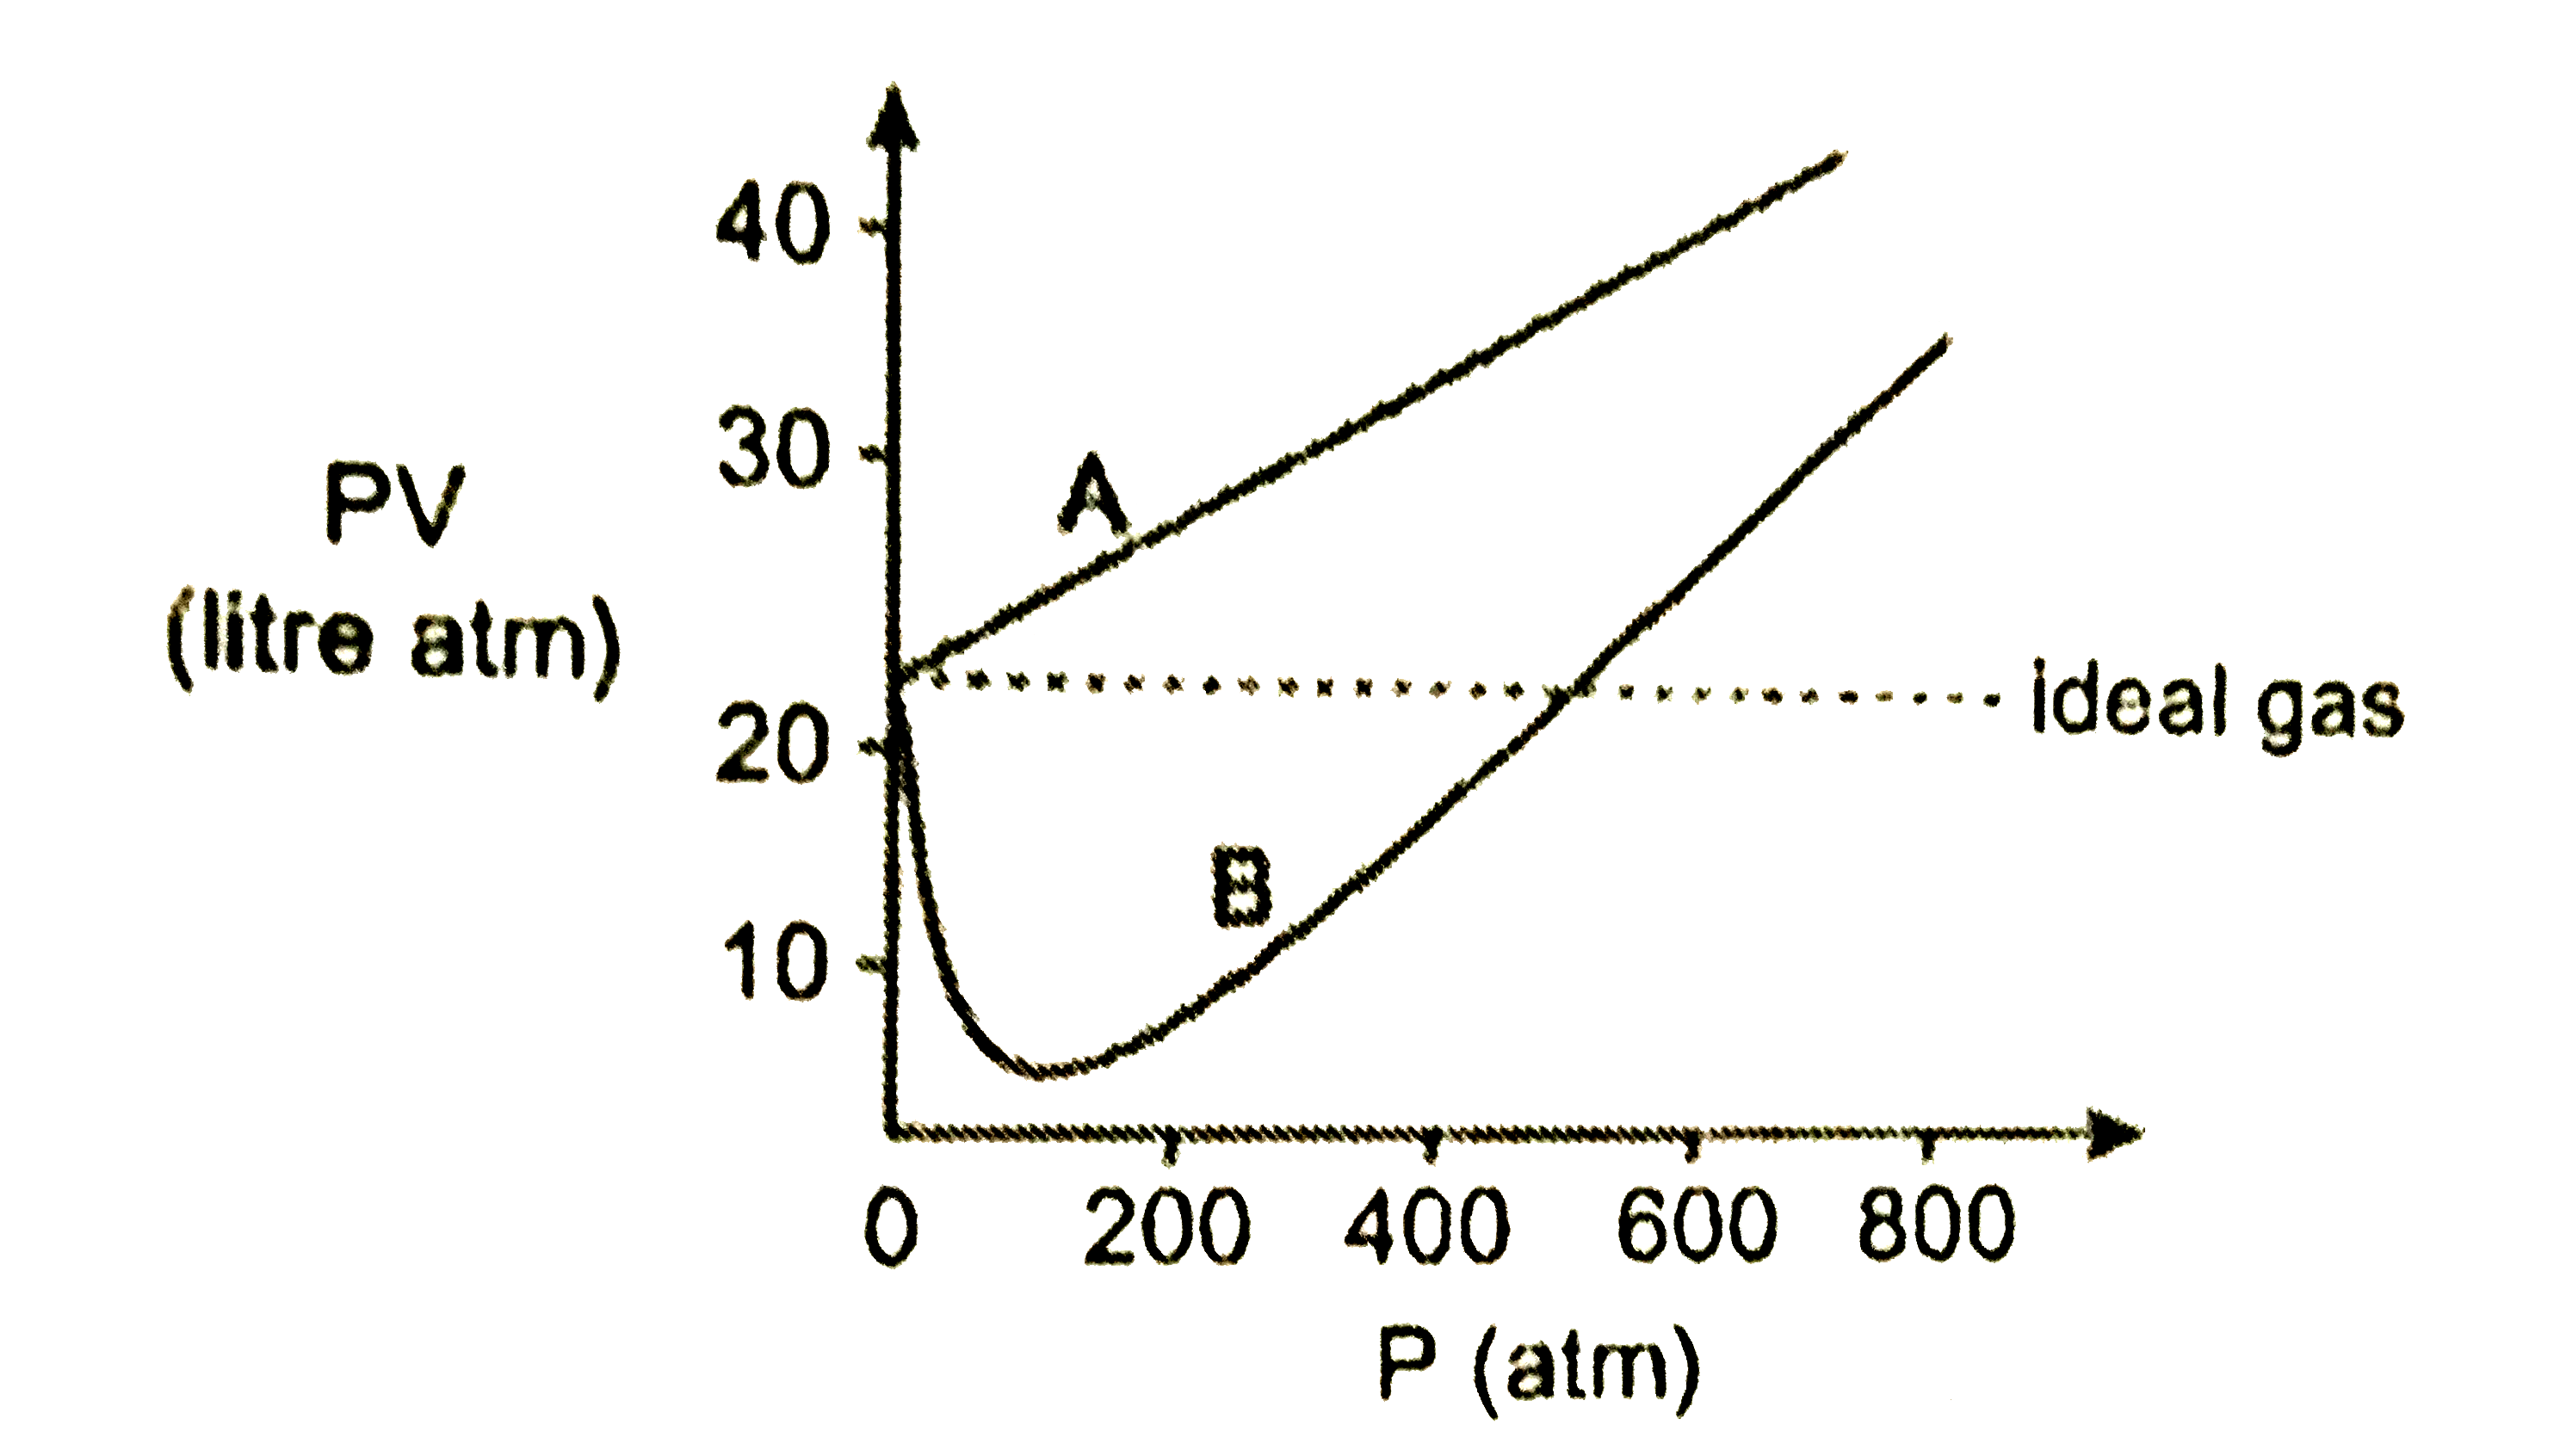
From the graph given below compare the intermolecular forces of attraction in A and B.

Text Solution
At extermely low pressure, all the gases behave almost ideally. From the graph, it is known that as pressure increases, PV decreases showing that with increasein pressure the intermolecular spaces between molecules of B can be decreased to a great extent. This is possible when the intermolecular forces between the molecules are more. At a certian stage PV reaches minimum and then increases showing that further increase in pressure cannot decreae the volume to that extent. While in A though the intermolecular spaces are more, the decrease in volume of'A ' with the increase of pressure is lesser than ideal gas. This shows that intermolecular forces of attraction of A are less.
|
Topper's Solved these Questions
- MOLE CONCEPT, STOICHIOMETRY AND BEHAVIOUR OF GASES BOOK - PEARSON IIT JEE FOUNDATIONCHAPTER - MOLE CONCEPT, STOICHIOMETRY AND BEHAVIOUR OF GASES EXERCISE - Level 2
23 Videos
- METALLURGYBOOK - PEARSON IIT JEE FOUNDATIONCHAPTER - METALLURGYEXERCISE - LEVEL 3
10 Videos
- PERIODIC TABLEBOOK - PEARSON IIT JEE FOUNDATIONCHAPTER - PERIODIC TABLEEXERCISE - LEVEL 3 APPLICATION-BASED QUESTIONS
5 Videos
Similar Questions
Knowledge Check
Intermolecular forces of attraction are more in
AFluorineBIodineCBromineDChlorineWhich of the following is intermolecular force of attraction?
AIonic bondBcovalent bondCmetallic bondingDdipole-dipoleWhich characterises the weak intermolecular forces of attraction in a liquid?
AHigh boiling pointBHigh vapour pressureCHigh critical temperatureDHigh heat of vaporization
Maximum intermolecular forces of attraction exists in
View SolutionWhich state of matter has least intermolecular forces of attraction?
View SolutionWhich state of matter has least intermolecular forces of attraction?
View SolutionWhich characterises the weak intermolecular forces of attraction in a liquid?
View SolutionAttractive intermolecular forces are known as
View Solution
