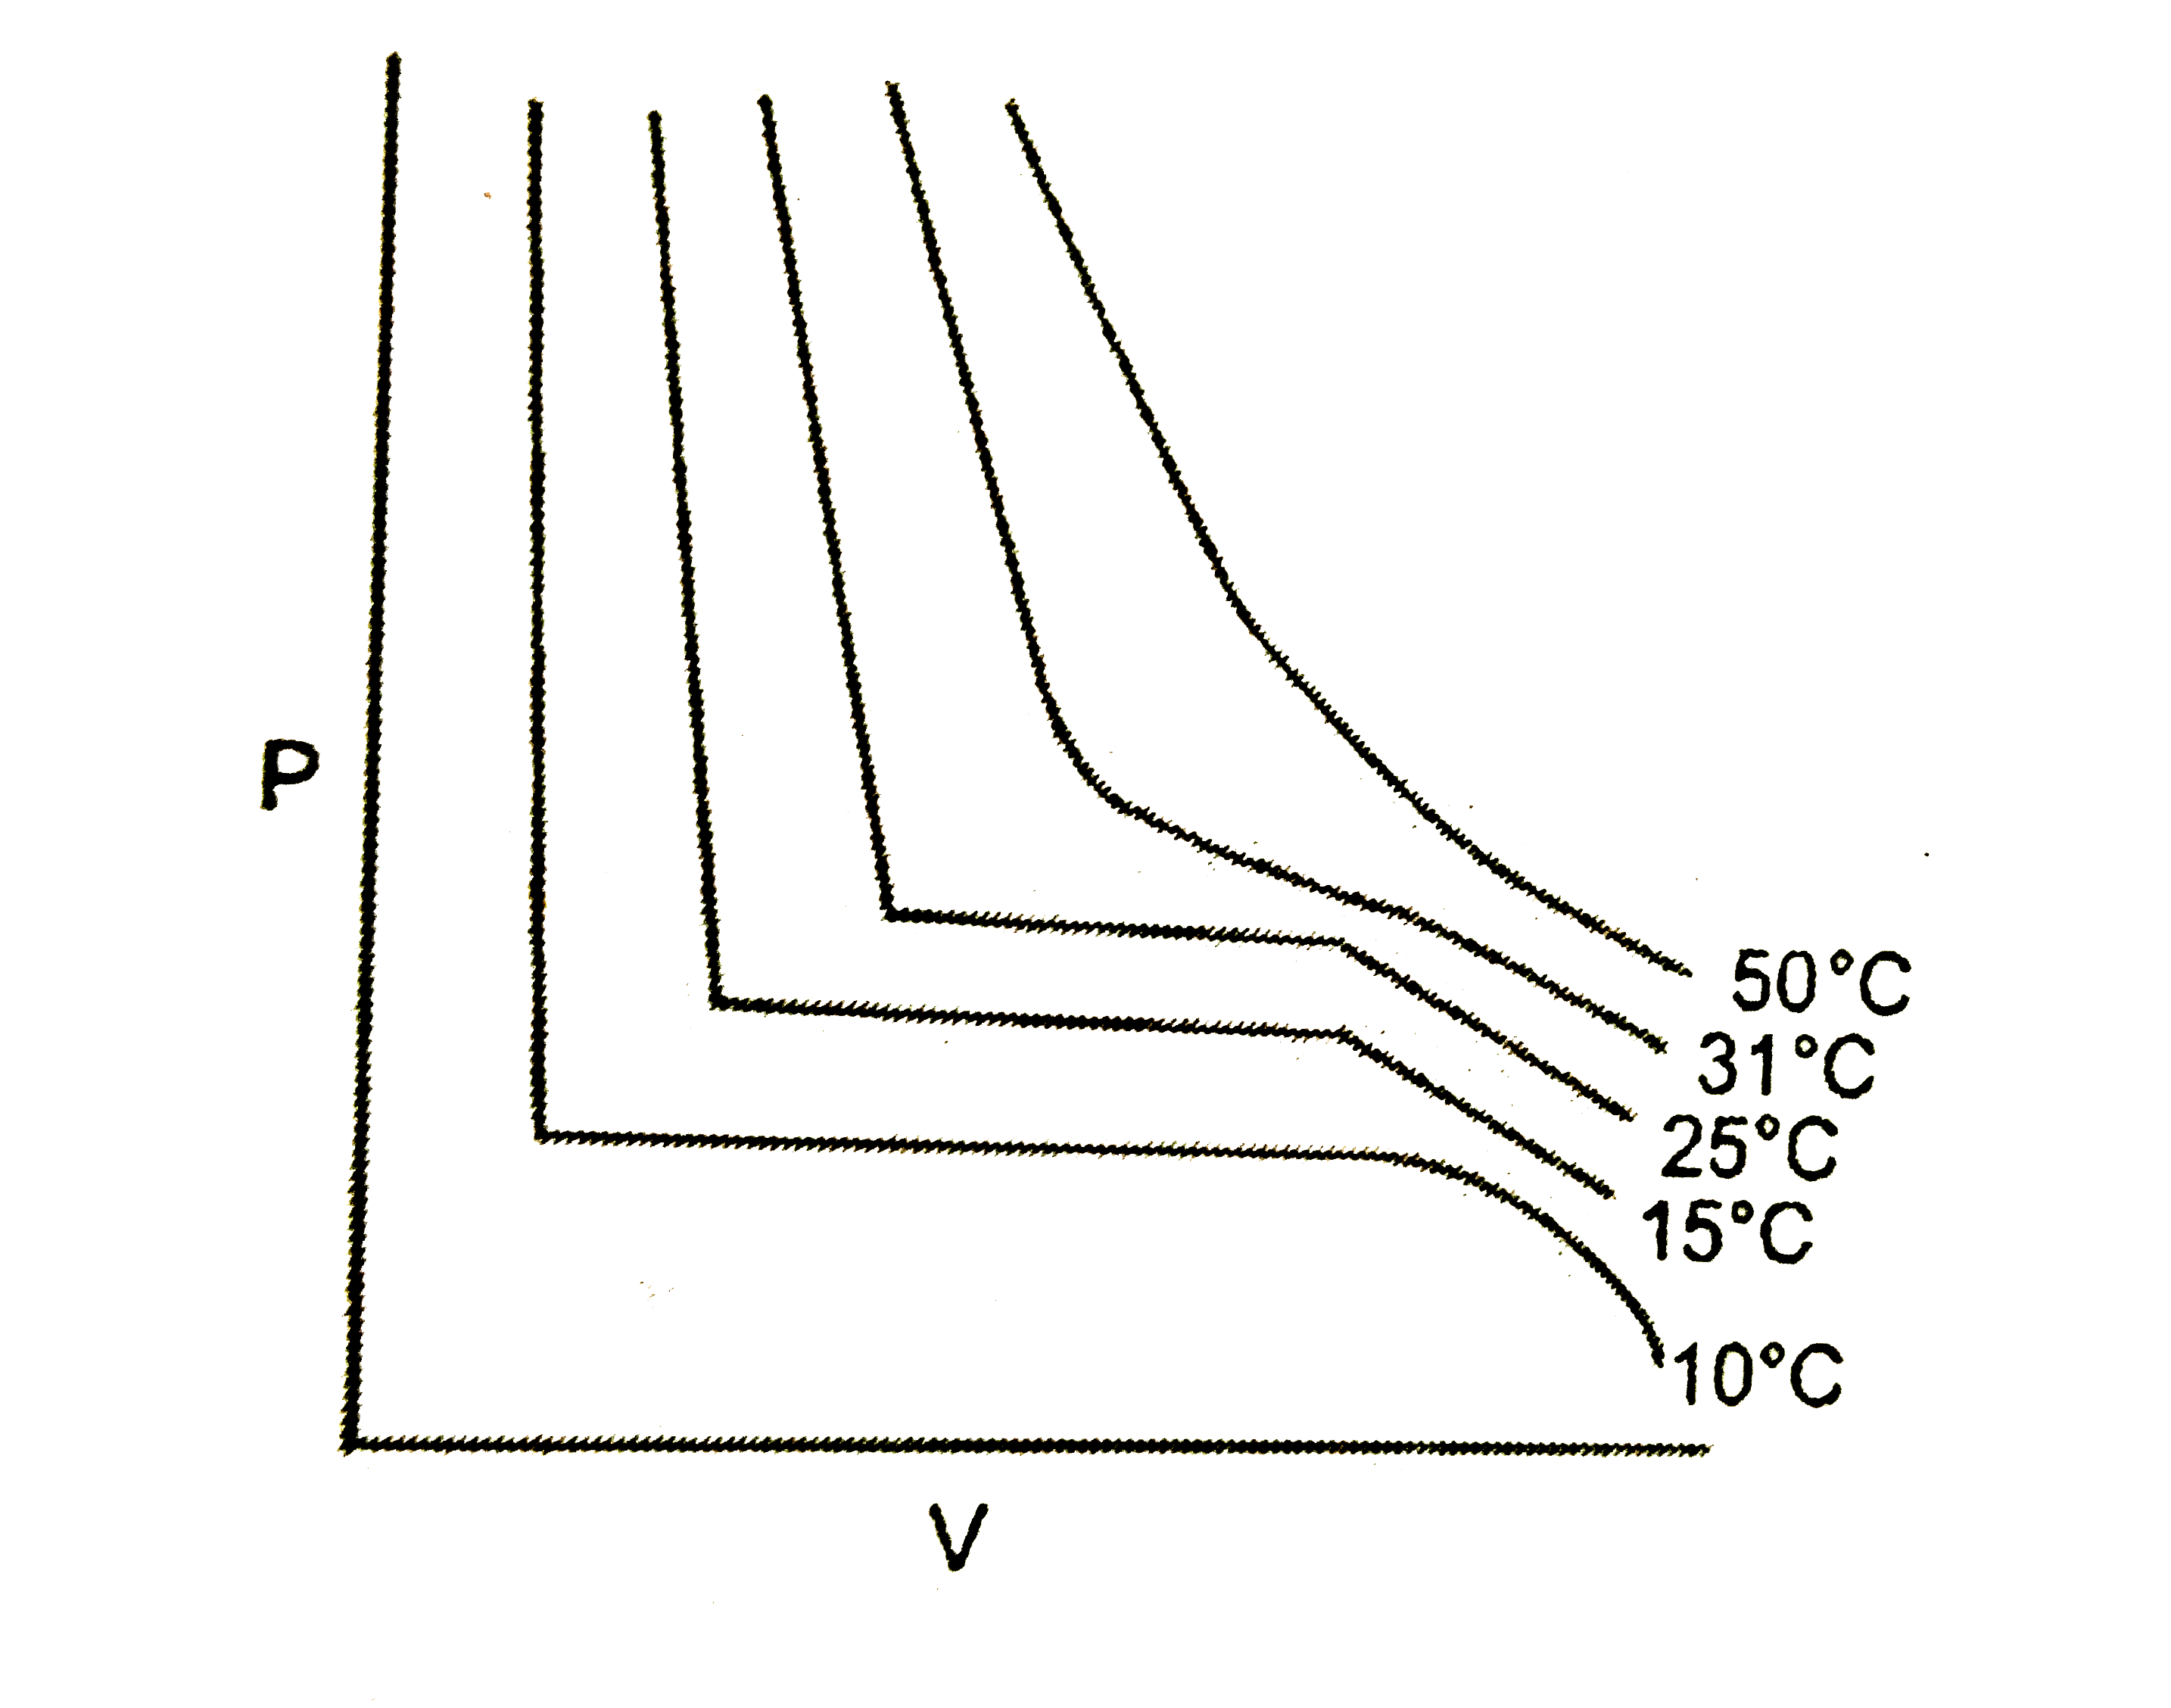
In the P vs V graph of CO2 gas given below, account for the reduction in the horizontal portion of the graph with increase in temperature.
Text Solution
(i) difference between real gas and ideal gas
(ii) analysis of the pattern of the curves given in the graph
(iii) analysis of the kind of gradual change in the curves with the change of temperature
(iv) analysis of the change in volume with the change in pressure in case of each curve
(v) analysis of the reason behind the change
|
Topper's Solved these Questions
- MOLE CONCEPT, STOICHIOMETRY AND BEHAVIOUR OF GASES Book:PEARSON IIT JEE FOUNDATIONChapter:MOLE CONCEPT, STOICHIOMETRY AND BEHAVIOUR OF GASES Exercise:Level 2
Explore 23 Videos
- METALLURGYBook:PEARSON IIT JEE FOUNDATIONChapter:METALLURGYExercise:LEVEL 3
Explore 10 Videos
- PERIODIC TABLEBook:PEARSON IIT JEE FOUNDATIONChapter:PERIODIC TABLEExercise:LEVEL 3 APPLICATION-BASED QUESTIONS
Explore 5 Videos
Similar Questions
Knowledge Check
From the given P−T graph of CO2, you may conclude that it will be
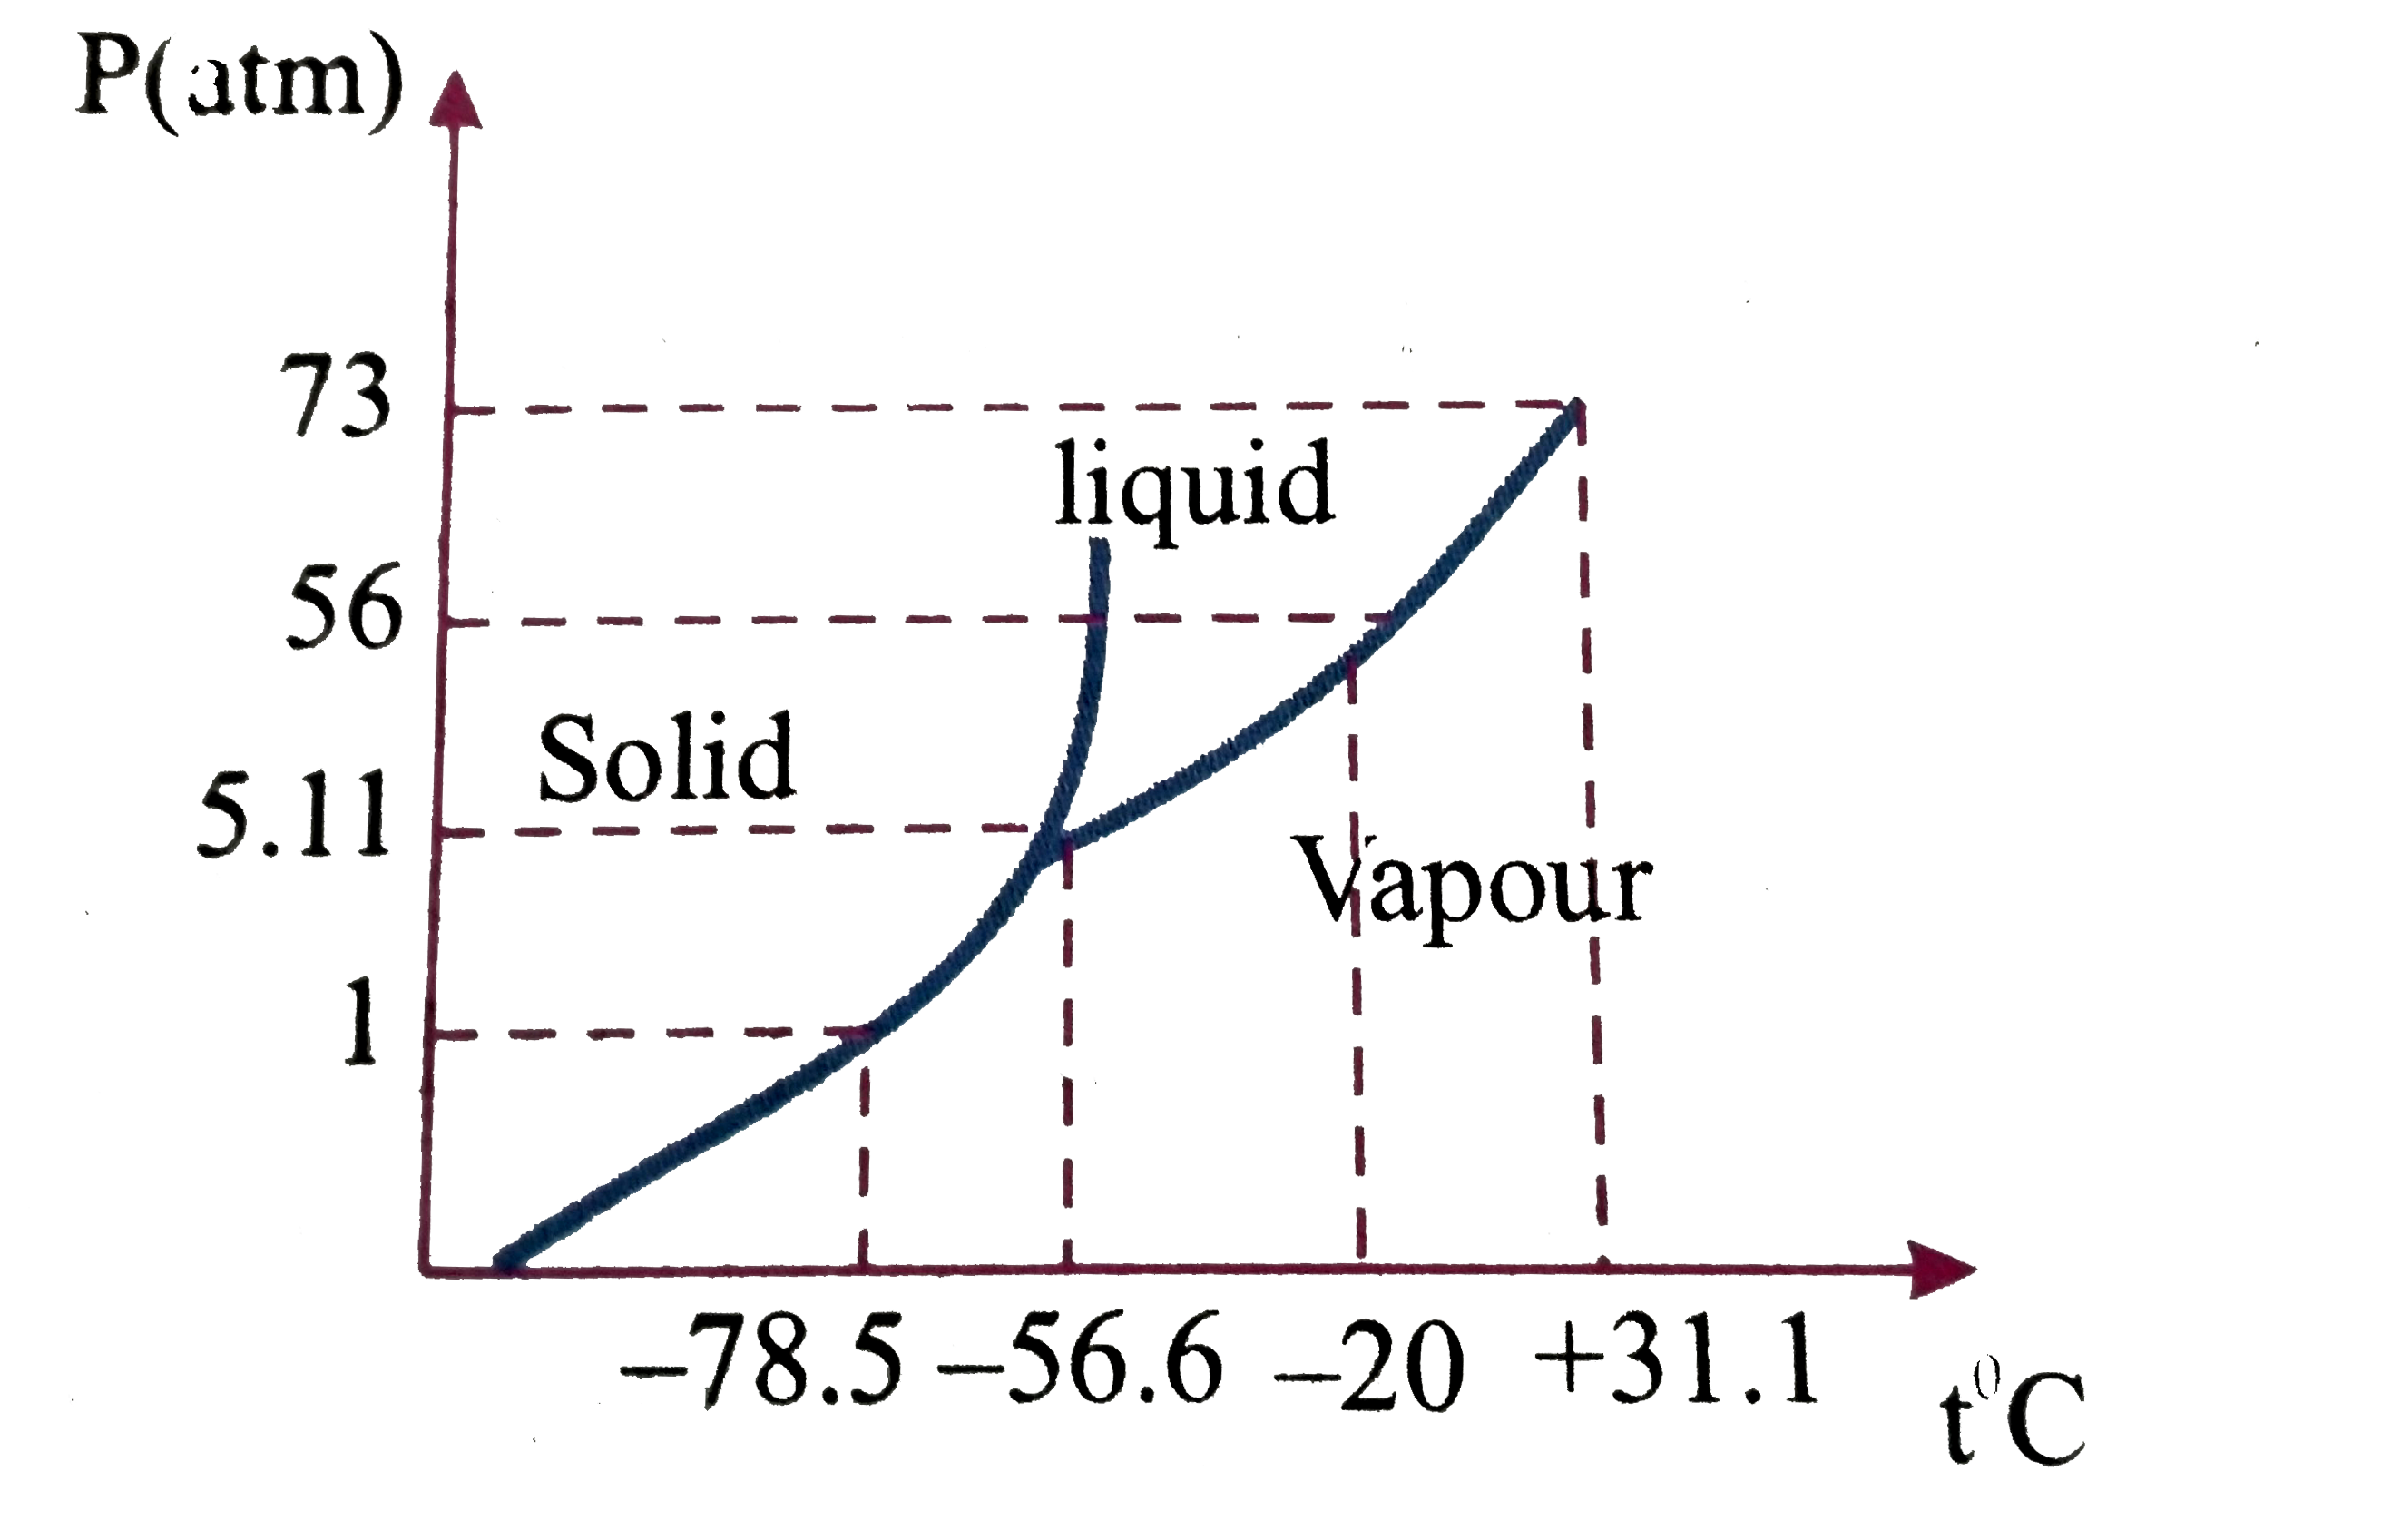 .AVapour at −79∘C under 1 atmBLiquid at −20∘C and 56 atmCsolid at −60∘C and 70 atmDCo-existing in three phase at −56.6∘C and 5.11 atm.
Graph between P & V below critical temperature is
A B
B C
C D
D
The graph given below shows the P-V plot for a process on an ideal gas. Select the correct statement.
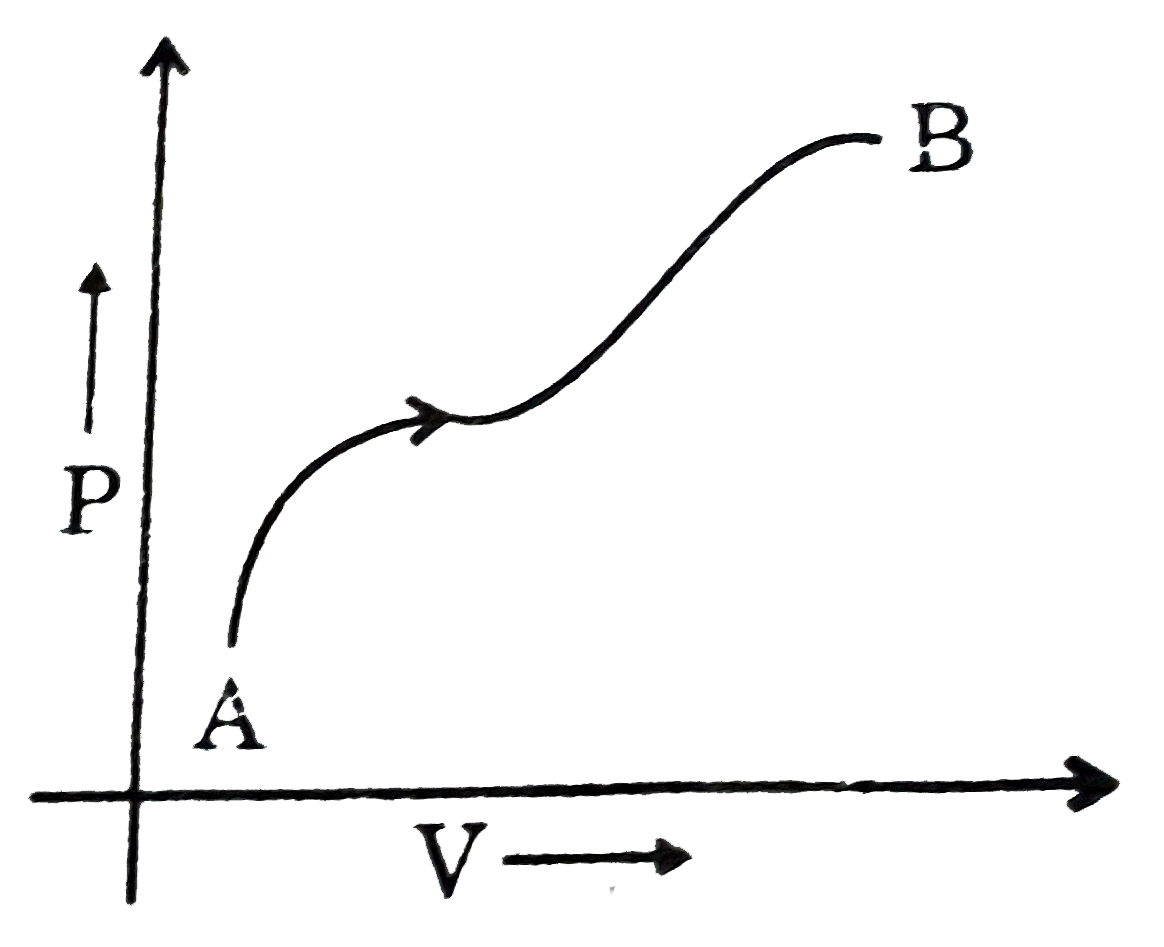 AEnthalpy content of the gas is constantly increasing and the process is carried out slowlyBEnthalpy content of the gas first increases then decreases and the process is quasistaticlyCEnthalpy content of the gas is constant and the process taken infinite amount of time for completionDEnthalpy content first decreases then increases and the process is reversible
For a given mass of a gas what is the shape of (p) versus (1V) graph at constant temperature ?
View SolutionExplain the following temperature Vs. time graph:
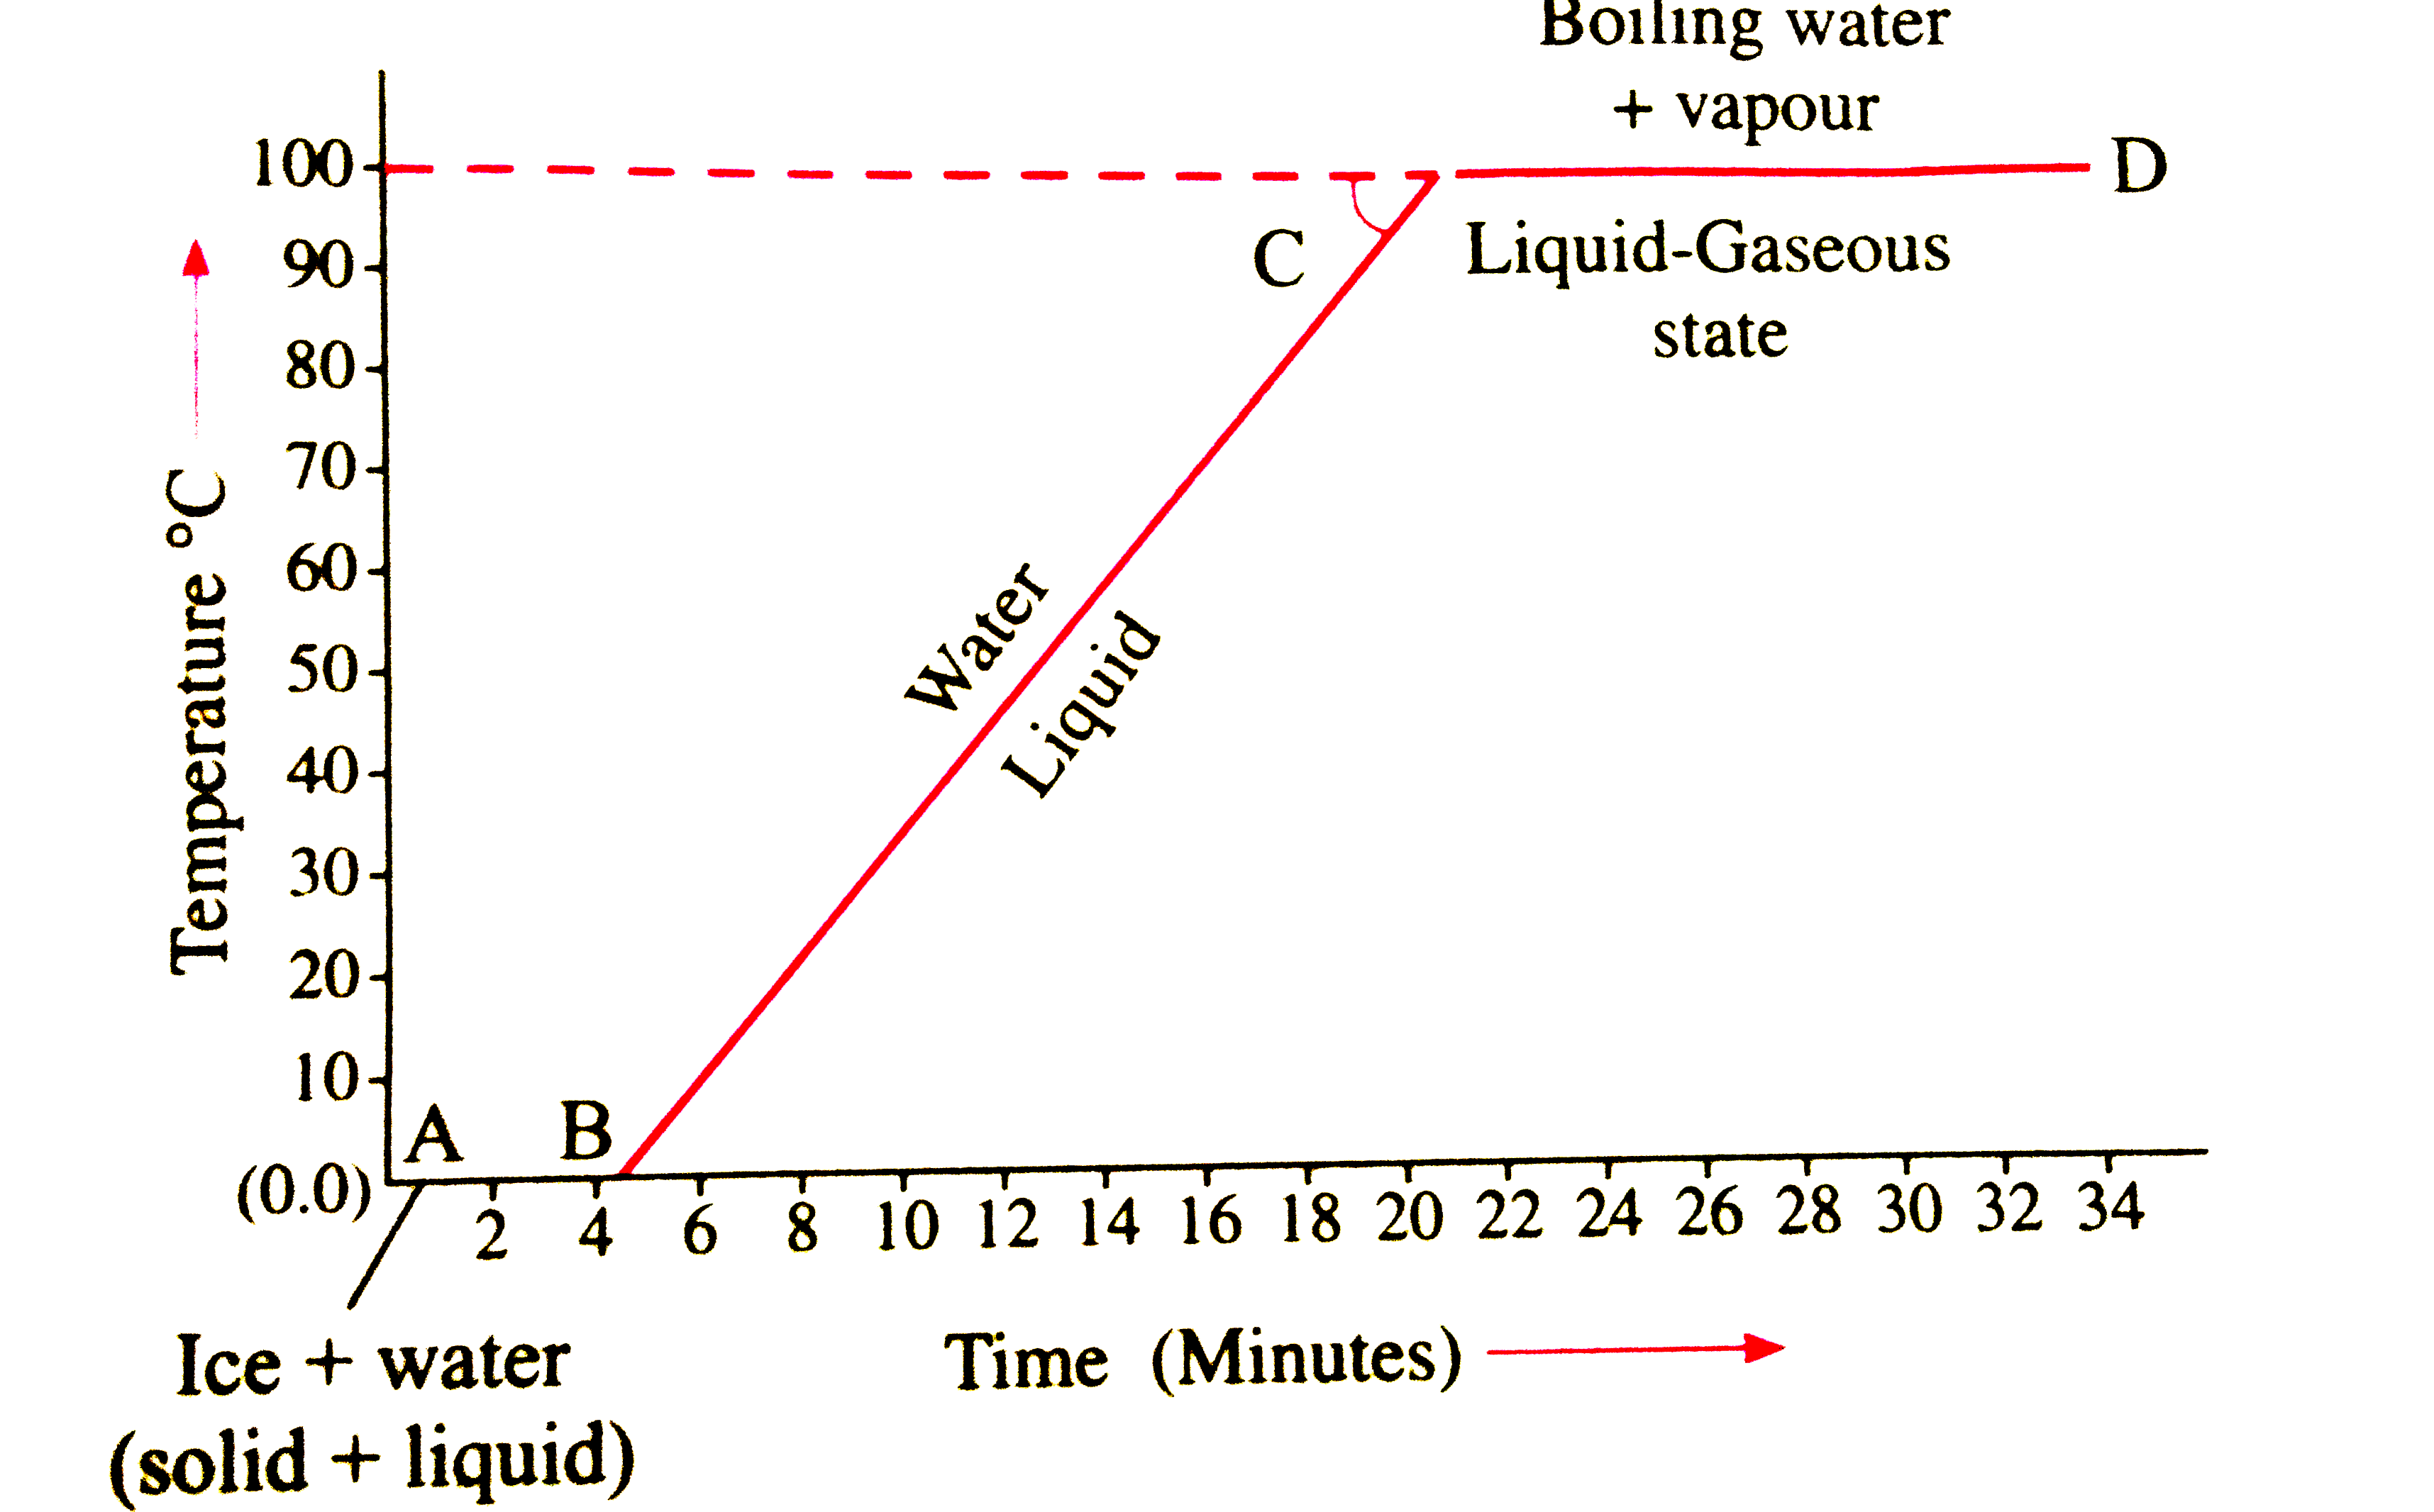
View SolutionPressure vs volume graph at constant temperature is known as…………….
View SolutionGraph between p and V at constant temperature is
View SolutionGraph between p and V at constant temperature is
View Solution

