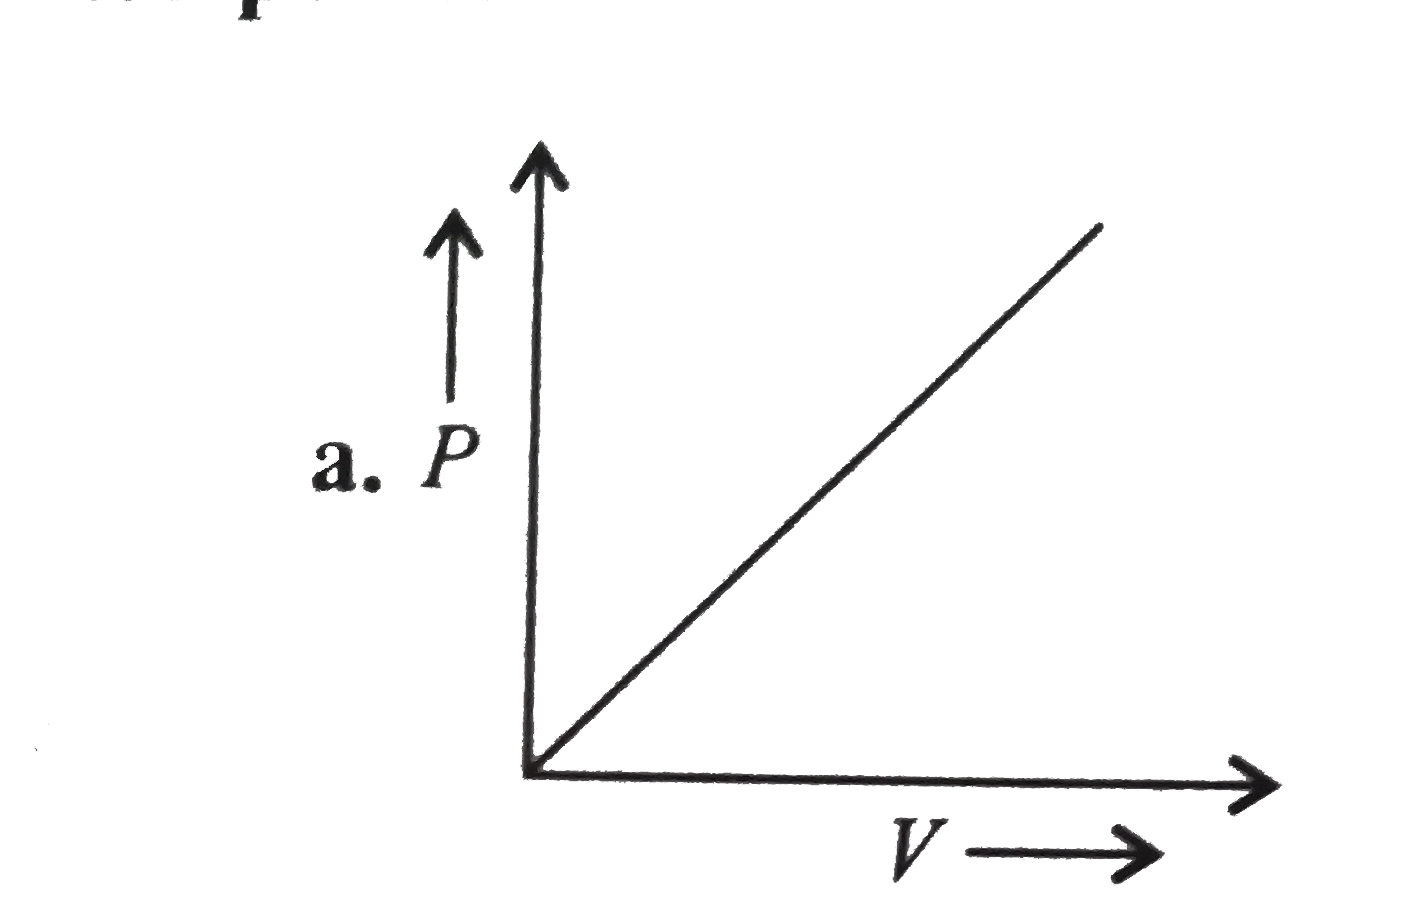
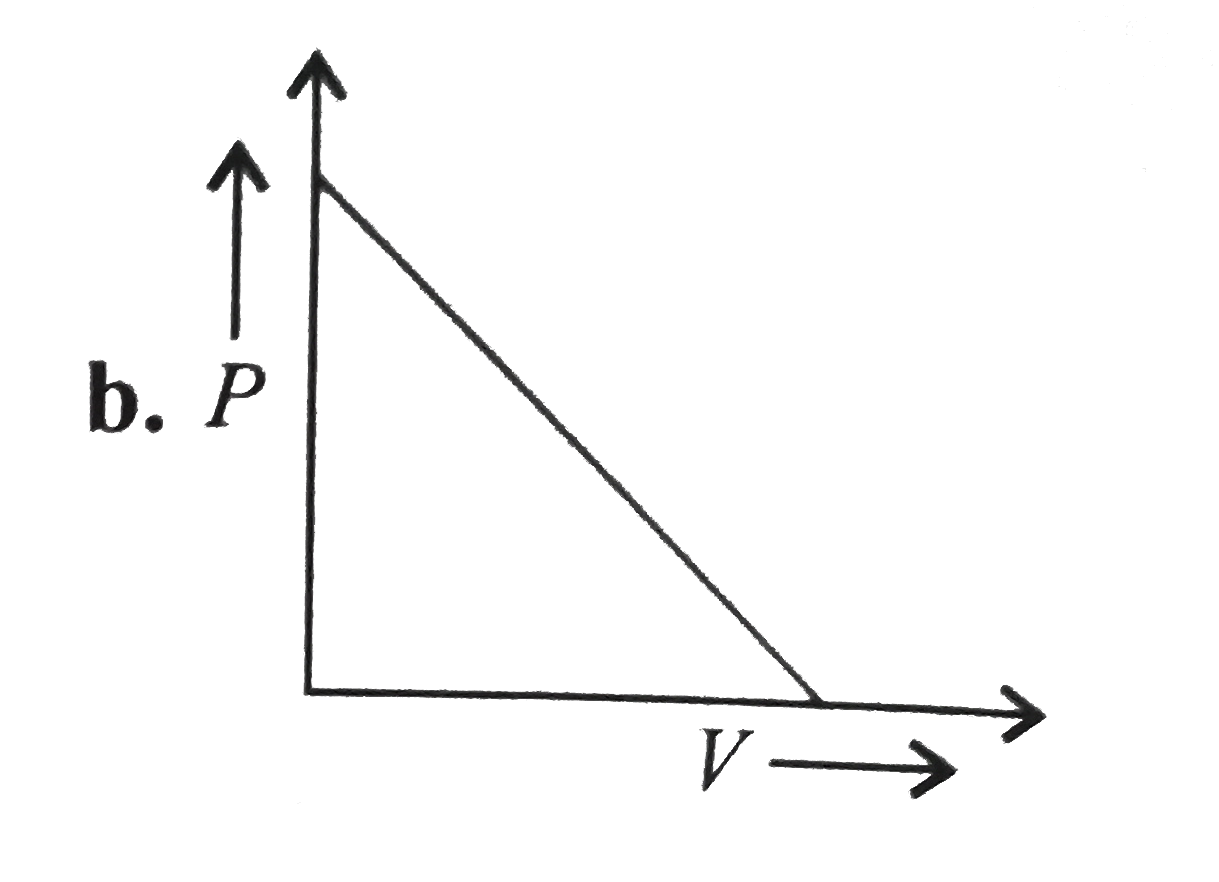
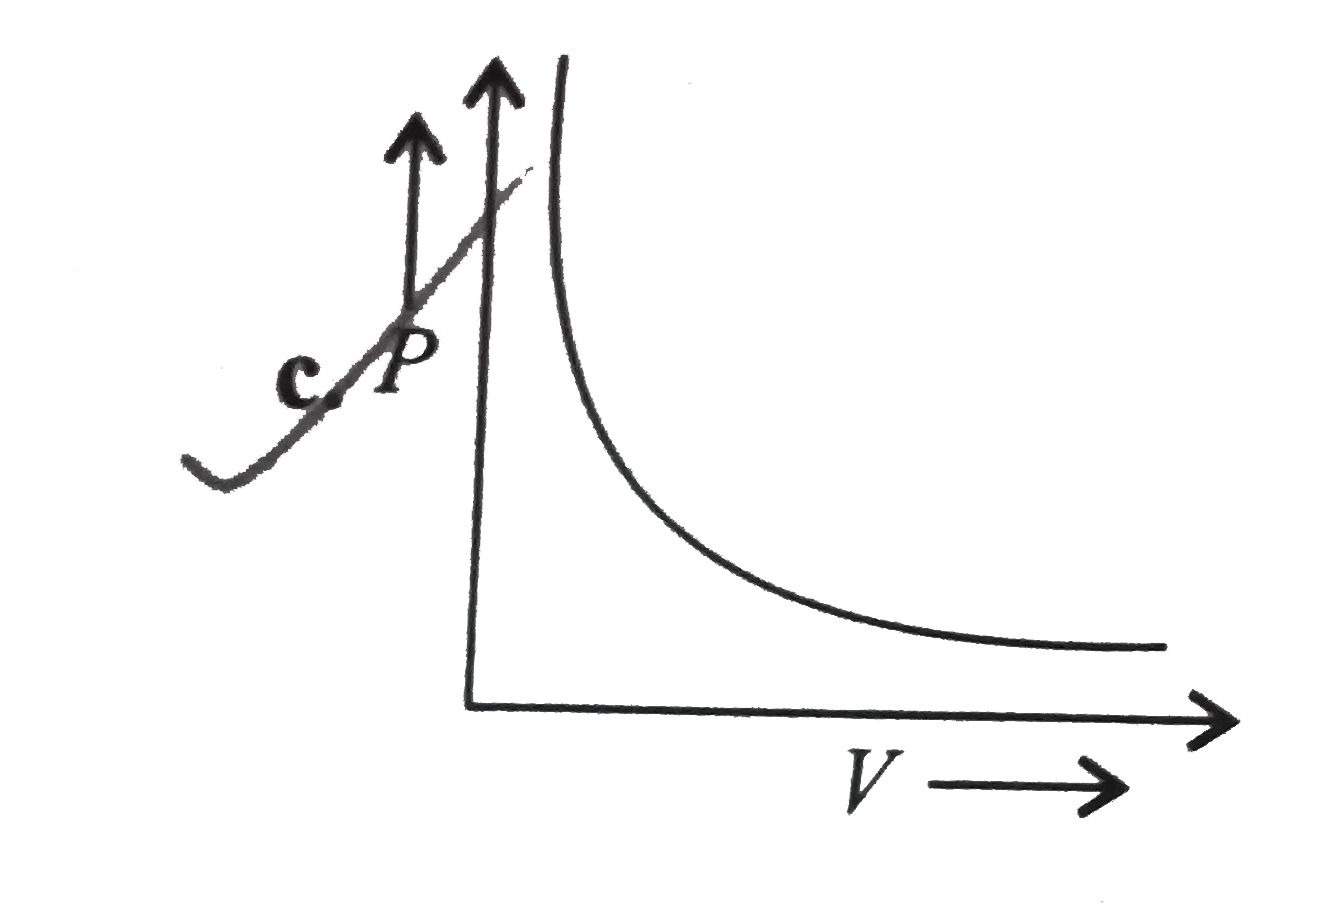
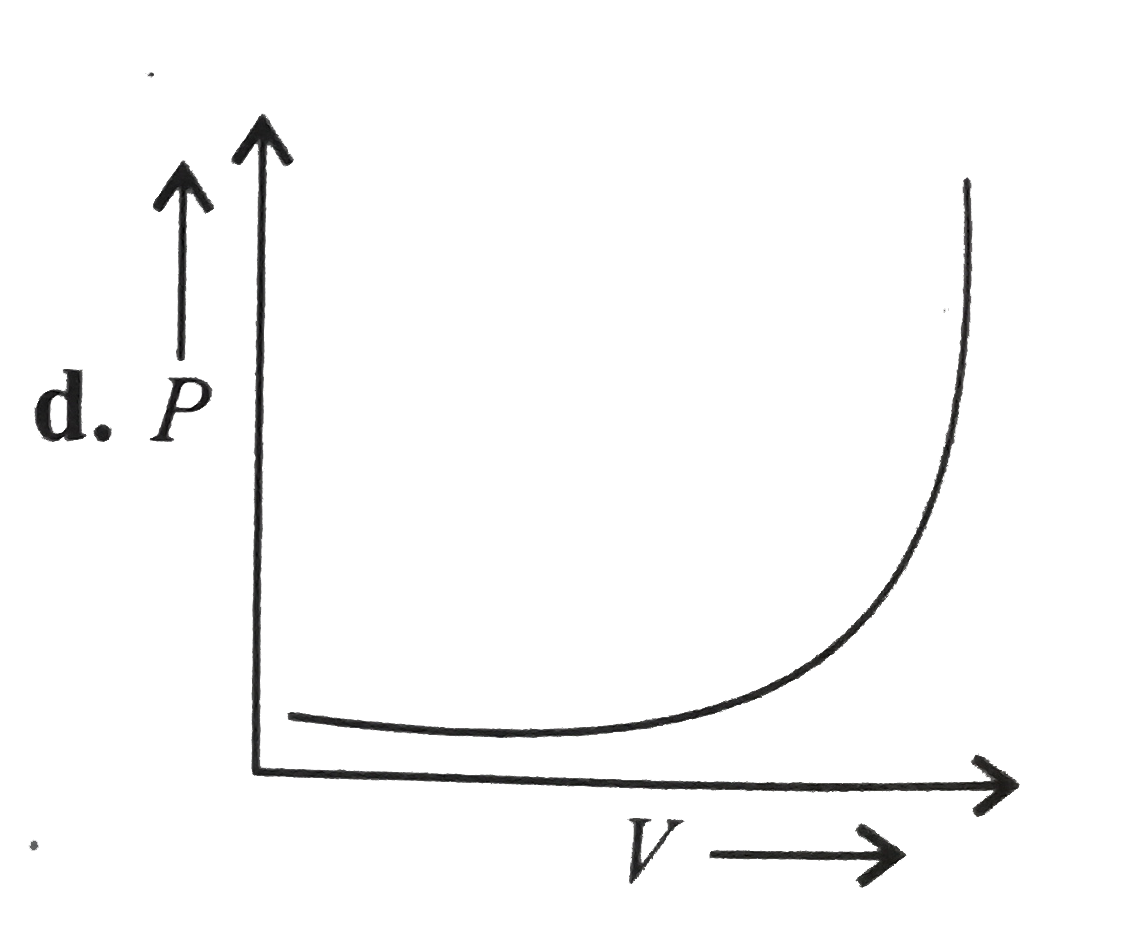
Graph between p and V at constant temperature is
straight
curved increasing
straight line with slope
none of these
The correct Answer is:D
Since p∝1/V(constant T,n) according to Boyle's law , the graph is a rectangular hyperbola:

Topper's Solved these Questions
- STATES OF MATTERBOOK - R SHARMACHAPTER - STATES OF MATTEREXERCISE - Question Bank Level - IV
6 Videos
- SOME BASIC CONCEPTS OF CHEMISTRYBOOK - R SHARMACHAPTER - SOME BASIC CONCEPTS OF CHEMISTRYEXERCISE - Archives
26 Videos
- STRUCTURE OF ATOMBOOK - R SHARMACHAPTER - STRUCTURE OF ATOMEXERCISE - ARCHIVES
55 Videos
Similar Questions
Single option match maxtix :
Column-IColumn-II(A)(Vm−b)(P+aV2m)=RT(p)isotherm(B)R/N(q)Isobar(C)Molar volume(r)Equation for real gases(D)Graph between P and V at constant temperature(s)22.4litre at STP(E)Graph between V and T at constant pressure(t)Boltzmann's constant
View SolutionWhat is the type of graph between log P and log V at constant temperature?
View Solution
Knowledge Check
Slop between pV and p at constant temperature is
Aslope between pV and p is zeroBslope between pV and p is 1Cslope between pV and p is 12Dslope between pV and p is 1√2The graph betwene P and V at constant temperature should look like
A B
B C
C D
D
The slope of the plot between pV and p at constant temperature is
AnegativeBpositiveC1/2Dzero
The slope of the graph between log P and log V at constant temperature for a given mass of gas is
View SolutionThe graph between PV vs P at constant temperature is linear parallel to the pressure axis.
View SolutionThe slope of the plot between pV and p at constant temperature is
View SolutionThe slope of the plot between pV and p at constant temperature is
View SolutionSlope of the plot between V and P at constant temperature
View Solution
