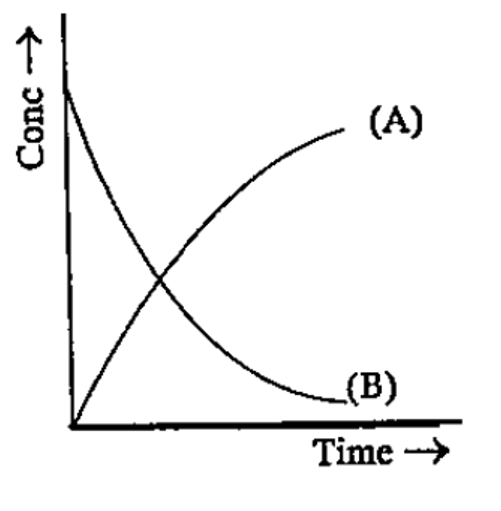
Identity the graph (A or B), represents the change in concentration of reactant with time.
 Solution in Malayalam
Step by step video & image solution for Identity the graph (A or B), represents the change in concentration of reactant with time. by Chemistry experts to help you in doubts & scoring excellent marks in Class 12 exams.
Topper's Solved these Questions
Similar Questions
Sanger’s reagent is used for the identification of_______.
02:01View SolutionWhich category of the synthetic detergent is used in tooth paste?
01:35View SolutionConsider the reaction A→B. The concentration of both the reactants and the products varies exponentially with time. Which of the following figure correctly describes the change in concentration of reactants and products with time ?
02:01View Solutionसमय के किसी विशेष क्षण पर किसी अभिकारक के सान्द्रण में परिवर्तन की दर उस समय दर………….कहलाती है।
02:05View SolutionConsider the reaction A→B. The concentration of both the reactants and the products varies exponentially with time. Which of the following figure correctly describes the change in concentration of reactants and products with time ?
03:32View SolutionAt the equilibrium of a reversible reaction , the concentration of the reactants and the products will be equal .
04:18View SolutionReactant A is placed in a beaker, to which Reactant B will be added. Reactants A and B will not react unless B gets to a certain concentration. Once the reaction starts, both concentrations decreases until B has been consumed . Which of the following graphs showing concentration in moles as a function of time in seconds, represent the reaction?
08:29View SolutionWhat will be the nature of the graph showing the concentration of the reactant and time of a first order reaction ?
05:25View SolutionPlot a graph of concentration of a reactant at time t, [ (a-x)] against time for a first order reaction .Here a = initial concentration of the reactant an x = change in concentration of the reactant at any time 1 during the reaction.
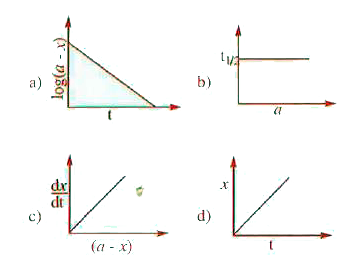
05:25View SolutionWhich of the following graphs represent a first order reaction (a=initial concentration of reactant, x=concentration of reactant consumed, t=time)
 05:16View Solution
Which of the following graphs represent a first order reaction (a=initial concentration of reactant, x=concentration of reactant consumed, t=time)
02:54View SolutionConsider the reaction A→B. The concentration of both the reactants and the products varies exponentially with time. Which of the following figure correctly describes the change in concentration of reactants and products with time ?
03:20View SolutionConsider the reaction A→B. The concentration of both the reactants and the products varies exponentially with time. Which of the following figure correctly describes the change in concentration of reactants and products with time ?
01:41View SolutionThe slope of concentration of reactant versus time graph for a zero order reaction gives ____.
View SolutionDraw a Schematic graph showing how the rate of reaction changes with change in concentration of reactant for zero order reaction.
03:20View Solution

