Consider the reaction A→B. The concentration of both the reactants and the products varies exponentially with time. Which of the following figure correctly describes the change in concentration of reactants and products with time ?
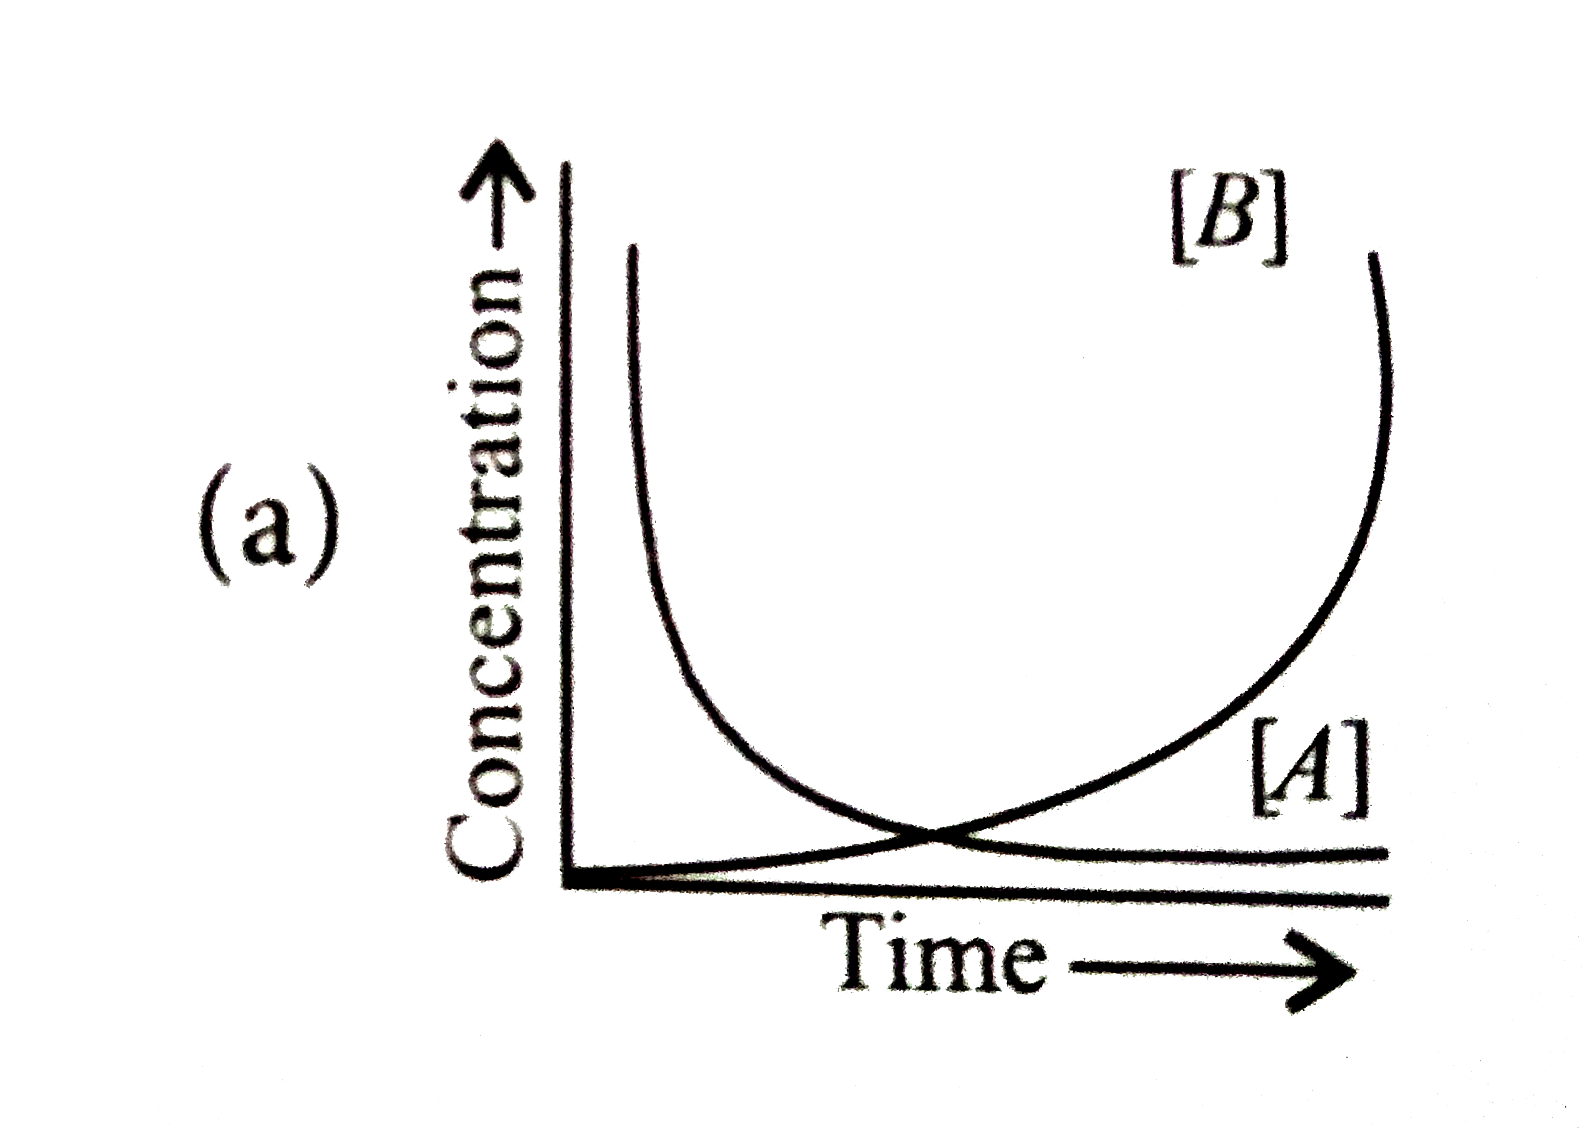
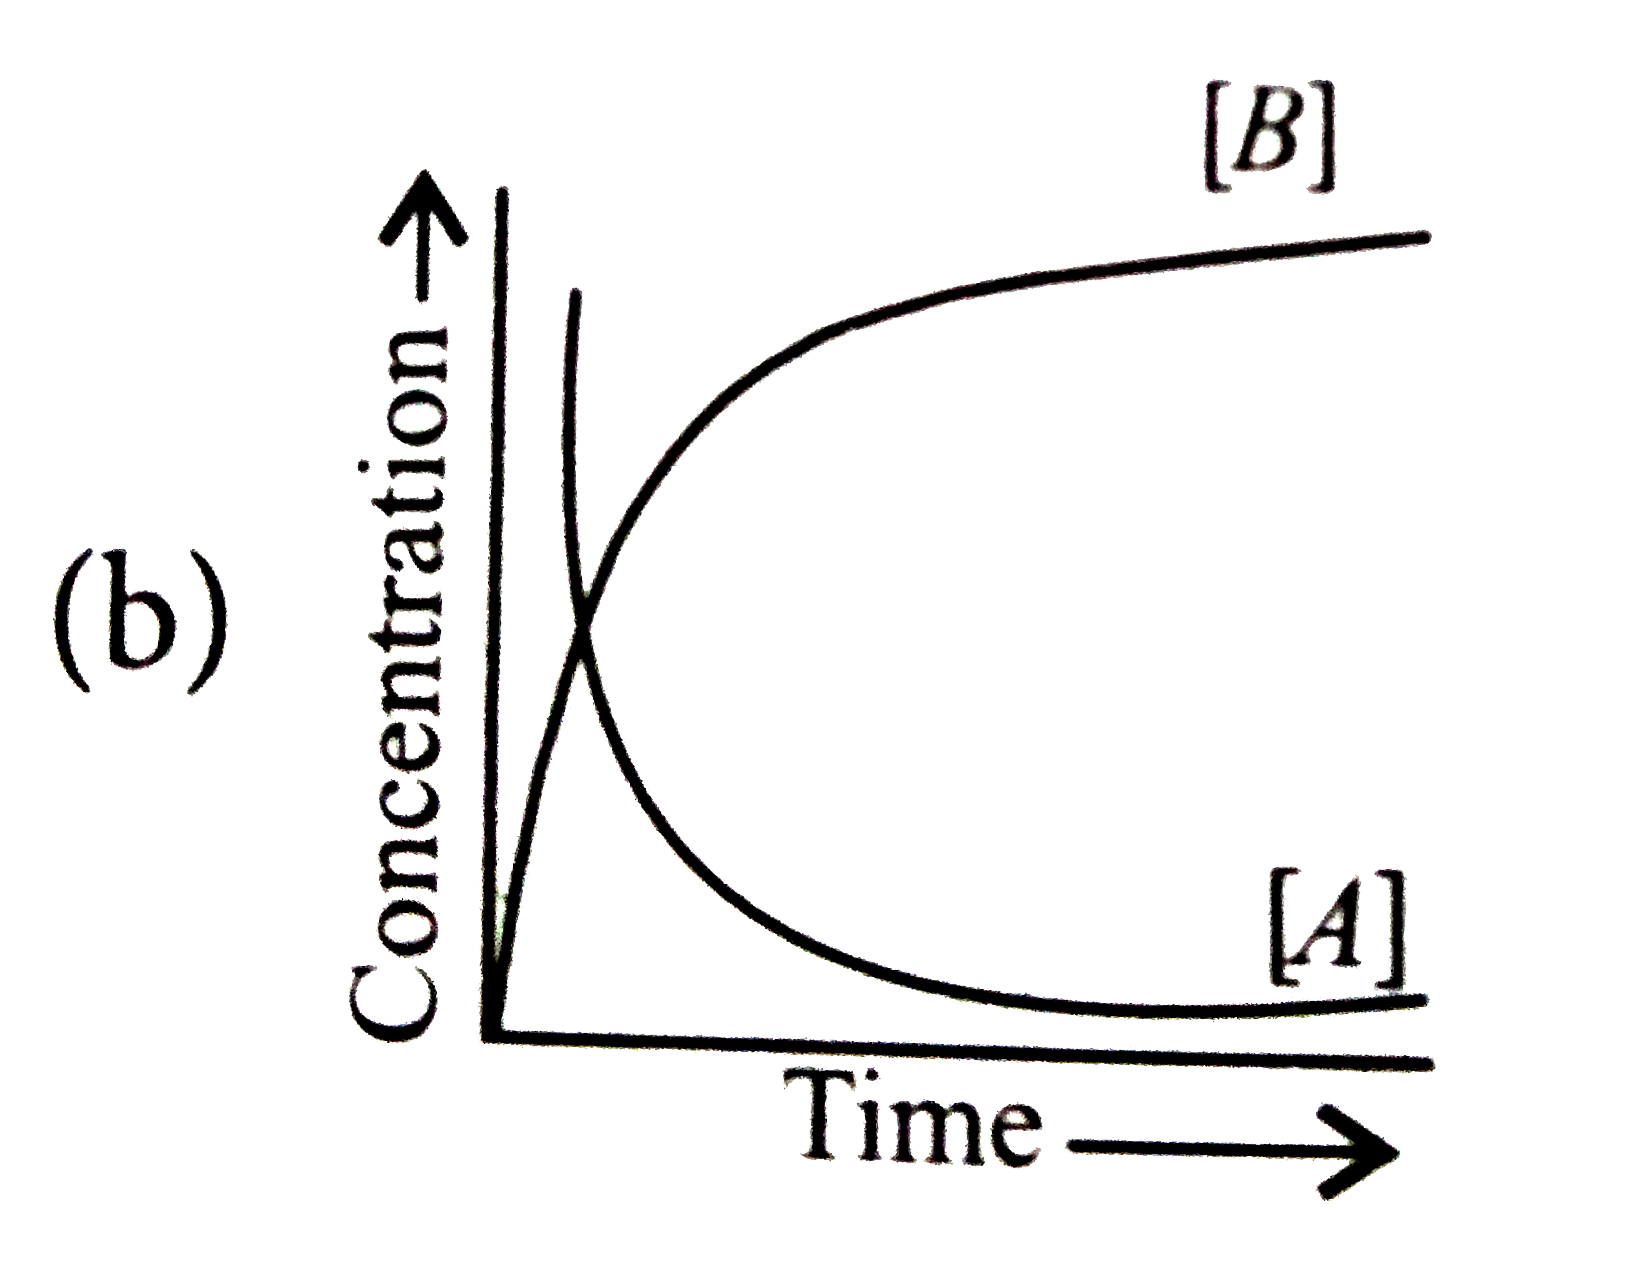
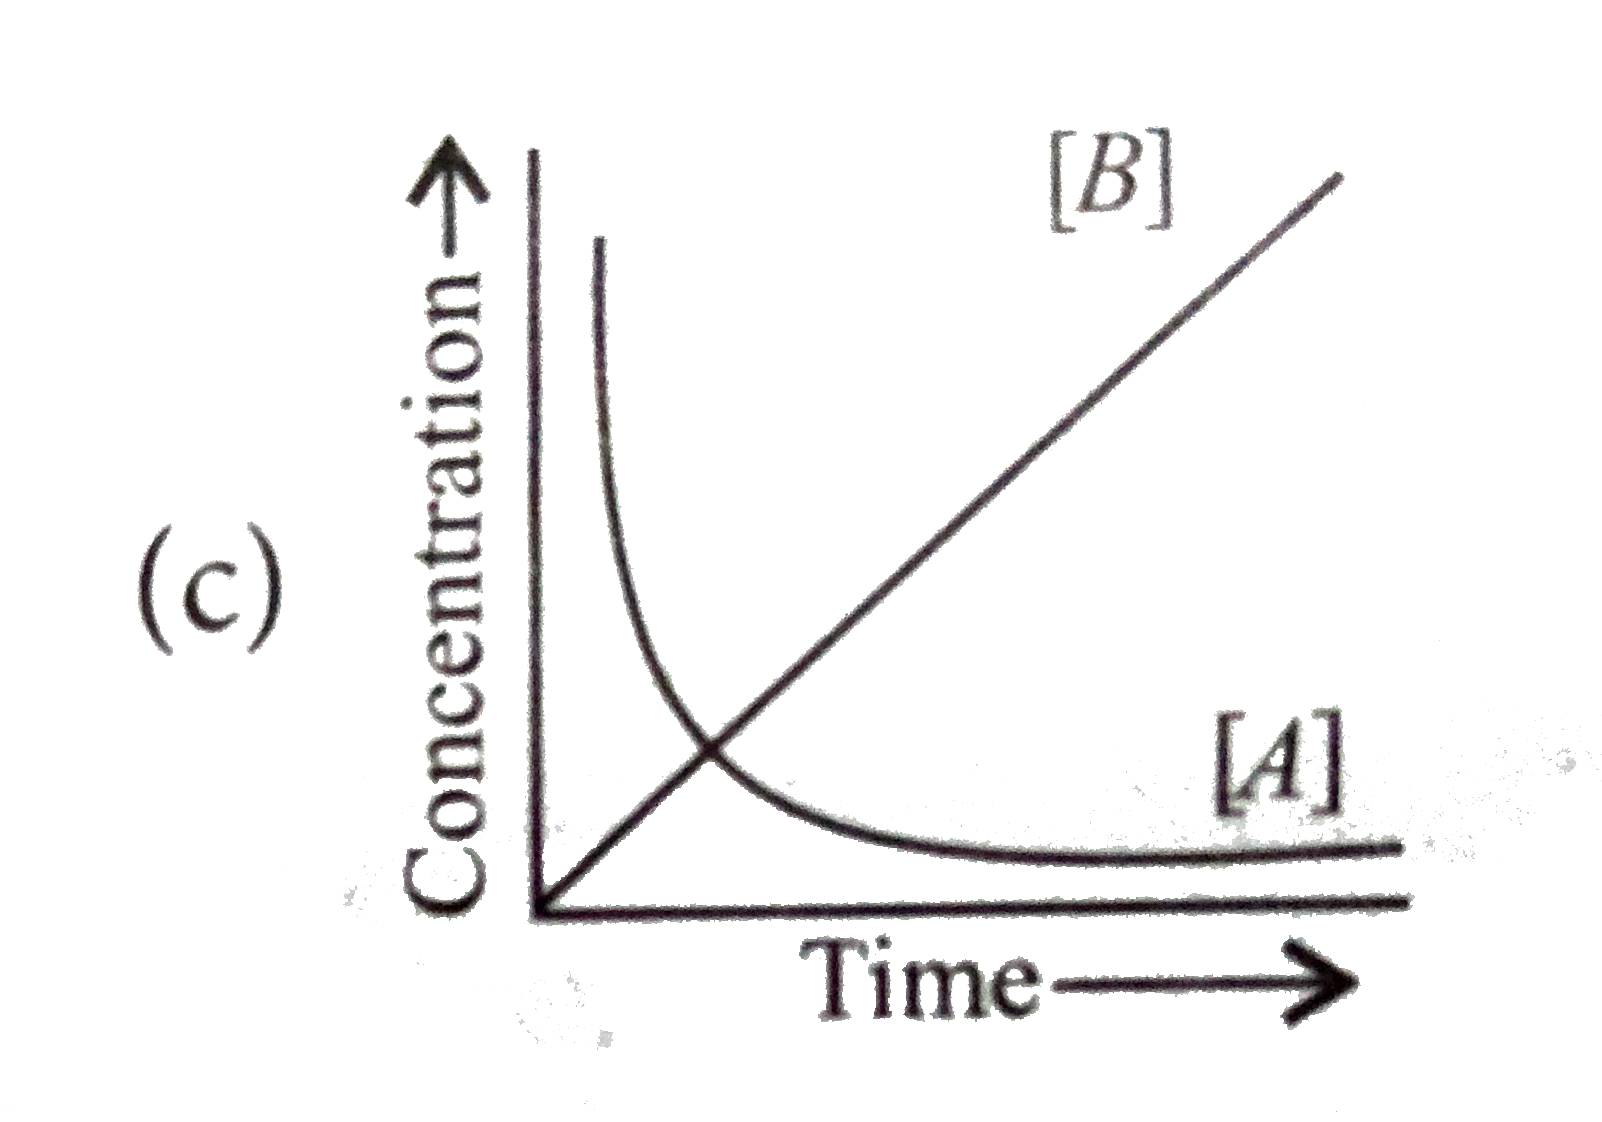
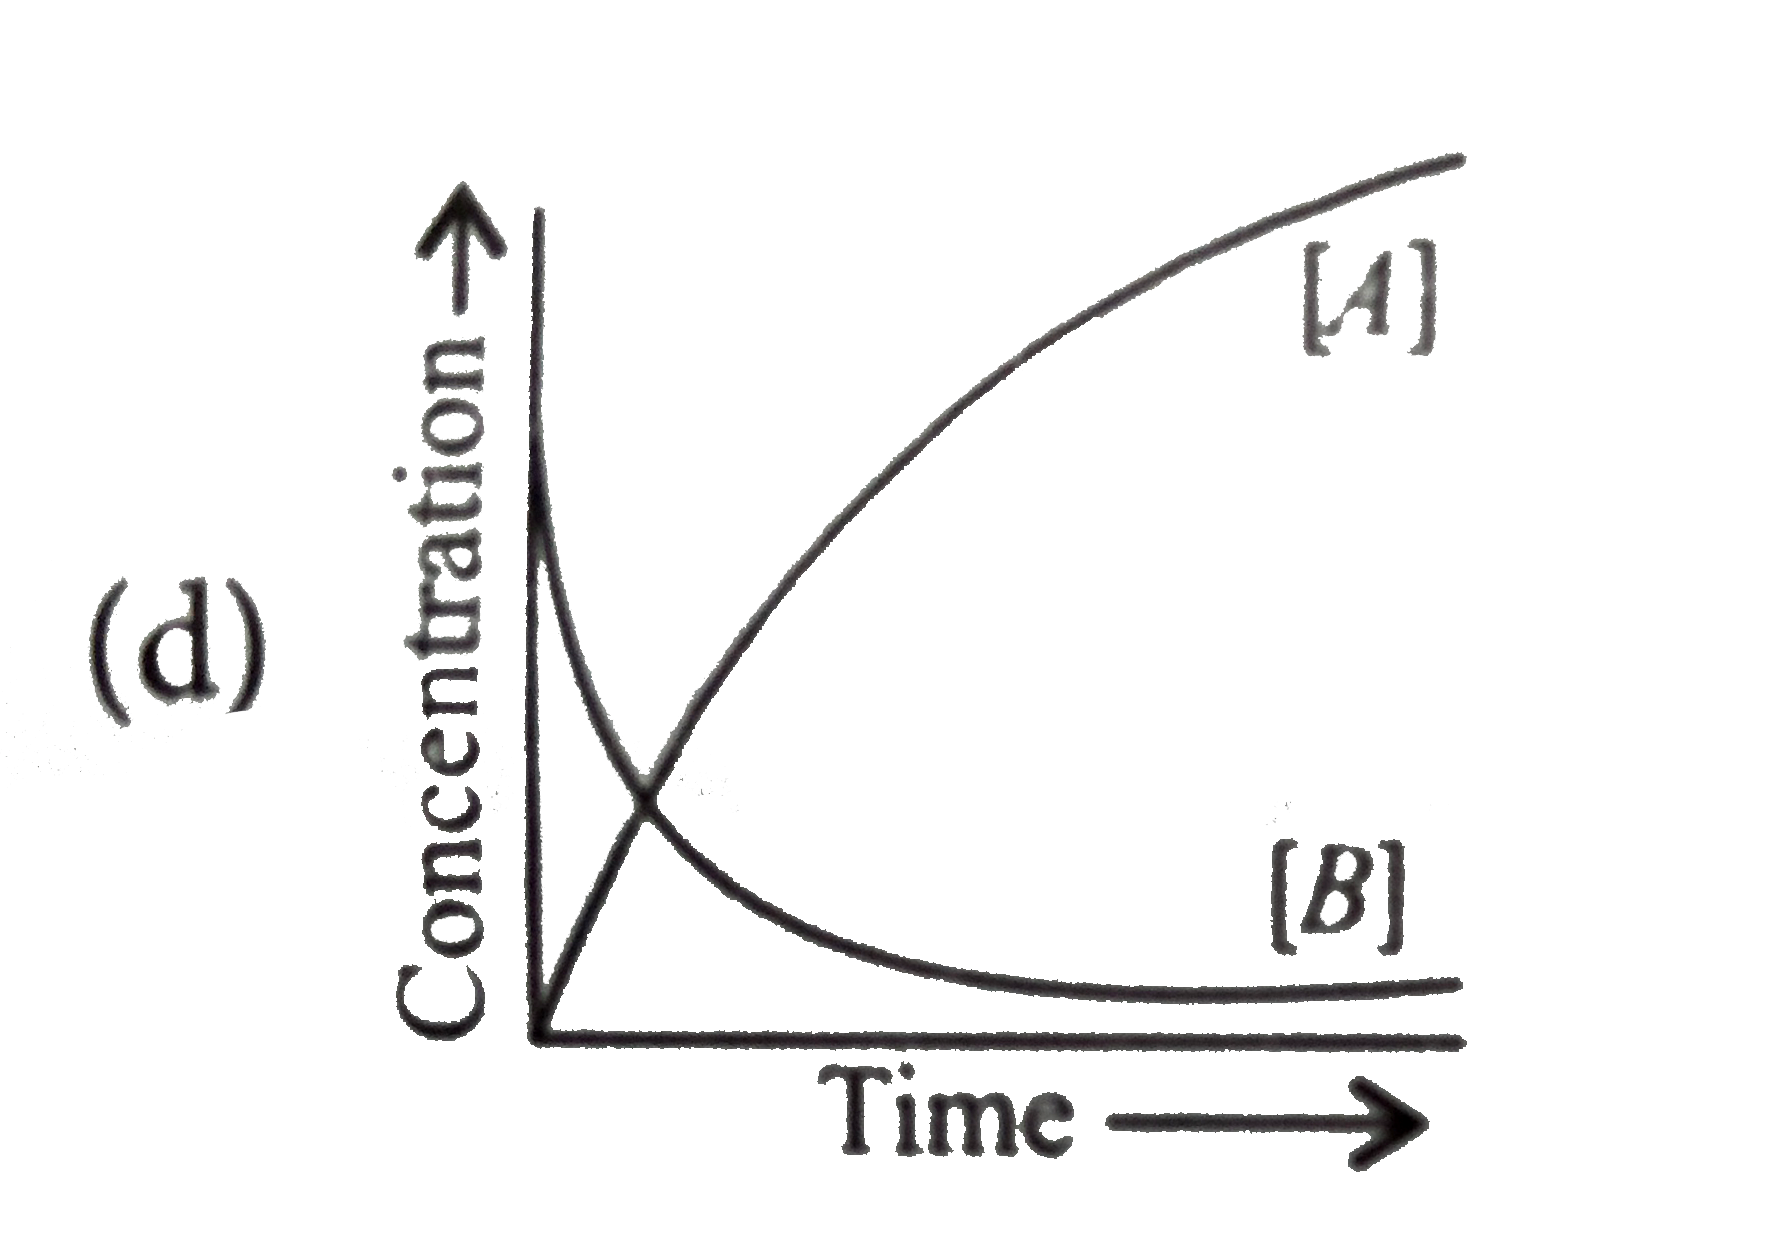
The correct Answer is:B
To solve the question regarding the reaction A→B and the change in concentration of reactants and products over time, we can follow these steps:
1. Understand the Reaction:
The reaction is represented as A→B, where A is the reactant and B is the product. As the reaction proceeds, A is converted into B.
2. Concentration Changes:
- Initially, the concentration of reactant A is at its maximum.
- As the reaction progresses, the concentration of A decreases while the concentration of B increases.
3. Graphical Representation:
- The x-axis represents time, while the y-axis represents concentration.
- The concentration of reactant A will show a decreasing exponential trend as the reaction proceeds.
- Conversely, the concentration of product B will show an increasing exponential trend.
4. Rate of Reaction:
- The rate of reaction is directly proportional to the concentration of the reactant. Therefore, as the concentration of A decreases, the rate of reaction also decreases.
- This means that the slope of the graph for A will become less steep over time.
5. Identifying the Correct Graph:
- We need to look for a graph where:
- The concentration of A starts high and decreases over time.
- The concentration of B starts low and increases over time.
- The correct graph will depict these trends accurately.
6. Conclusion:
- After analyzing the provided graphs, we determine that Graph B correctly represents the change in concentration of reactants and products with time.
The reaction is represented as A→B, where A is the reactant and B is the product. As the reaction proceeds, A is converted into B.
- Initially, the concentration of reactant A is at its maximum.
- As the reaction progresses, the concentration of A decreases while the concentration of B increases.
- The x-axis represents time, while the y-axis represents concentration.
- The concentration of reactant A will show a decreasing exponential trend as the reaction proceeds.
- Conversely, the concentration of product B will show an increasing exponential trend.
- The rate of reaction is directly proportional to the concentration of the reactant. Therefore, as the concentration of A decreases, the rate of reaction also decreases.
- This means that the slope of the graph for A will become less steep over time.
- We need to look for a graph where:
- The concentration of A starts high and decreases over time.
- The concentration of B starts low and increases over time.
- The correct graph will depict these trends accurately.
- After analyzing the provided graphs, we determine that Graph B correctly represents the change in concentration of reactants and products with time.
Topper's Solved these Questions
- CHEMICAL KINETICSBOOK - NCERT FINGERTPS ENGLISHCHAPTER - CHEMICAL KINETICSEXERCISE - ASSERTION & REASON
15 Videos
- CHEMICAL KINETICSBOOK - NCERT FINGERTPS ENGLISHCHAPTER - CHEMICAL KINETICSEXERCISE - Rate Of A Chemical Reaction
17 Videos
- CHEMICAL KINETICSBOOK - NCERT FINGERTPS ENGLISHCHAPTER - CHEMICAL KINETICSEXERCISE - Higher Order Thinking Skills
9 Videos
- BIOMOLECULESBOOK - NCERT FINGERTPS ENGLISHCHAPTER - BIOMOLECULESEXERCISE - Assertion And Reason
15 Videos
- CHEMISTRY IN EVERYDAY LIFE BOOK - NCERT FINGERTPS ENGLISHCHAPTER - CHEMISTRY IN EVERYDAY LIFE EXERCISE - NCERT Exemplar
15 Videos
Similar Questions
Knowledge Check
Consider the reaction A→B. The concentration of both the reactants and the products varies exponentially with time. Which of the following figure correctly describes the change in concentration of reactants and products with time ?
A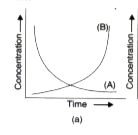 B
B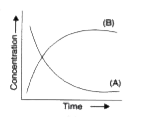 C
C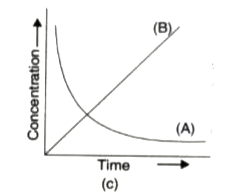 D
D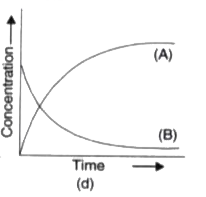
Consider the reaction A→B. The concentration of both the reactants and the products varies exponentially with time. Which of the following figure correctly describes the change in concentration of reactants and products with time ?
A B
B C
C D
D
Consider the reaction A→B. The concentration of both the reactants and the products varies exponentially with time. Which of the following figure correctly describes the change in concentration of reactants and products with time ?
A B
B C
C D
D
An increse in the concentration of the reactants of a reaction leads to change in:
View SolutionAssertion (A) : For a first order, the concentration of a reaction decreases exponentially with time.
Reason (R ): The rate of reaction at any time depends upon the concentration of the reactant at that time.
View SolutionIf concentration of reactant is increased by 2 times then K
becomes :-
View SolutionThe configurations of the reactant and the product in the following reaction, respectively, are
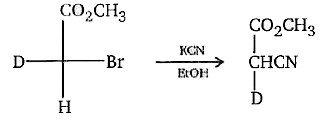
View SolutionAssertion : Order of a reaction with respect to any reactant can be zero, positive negative of fractional.
Reason : Rate of a reaction cannot decrease with increase in concentration of a reactant or a product.
View Solution
