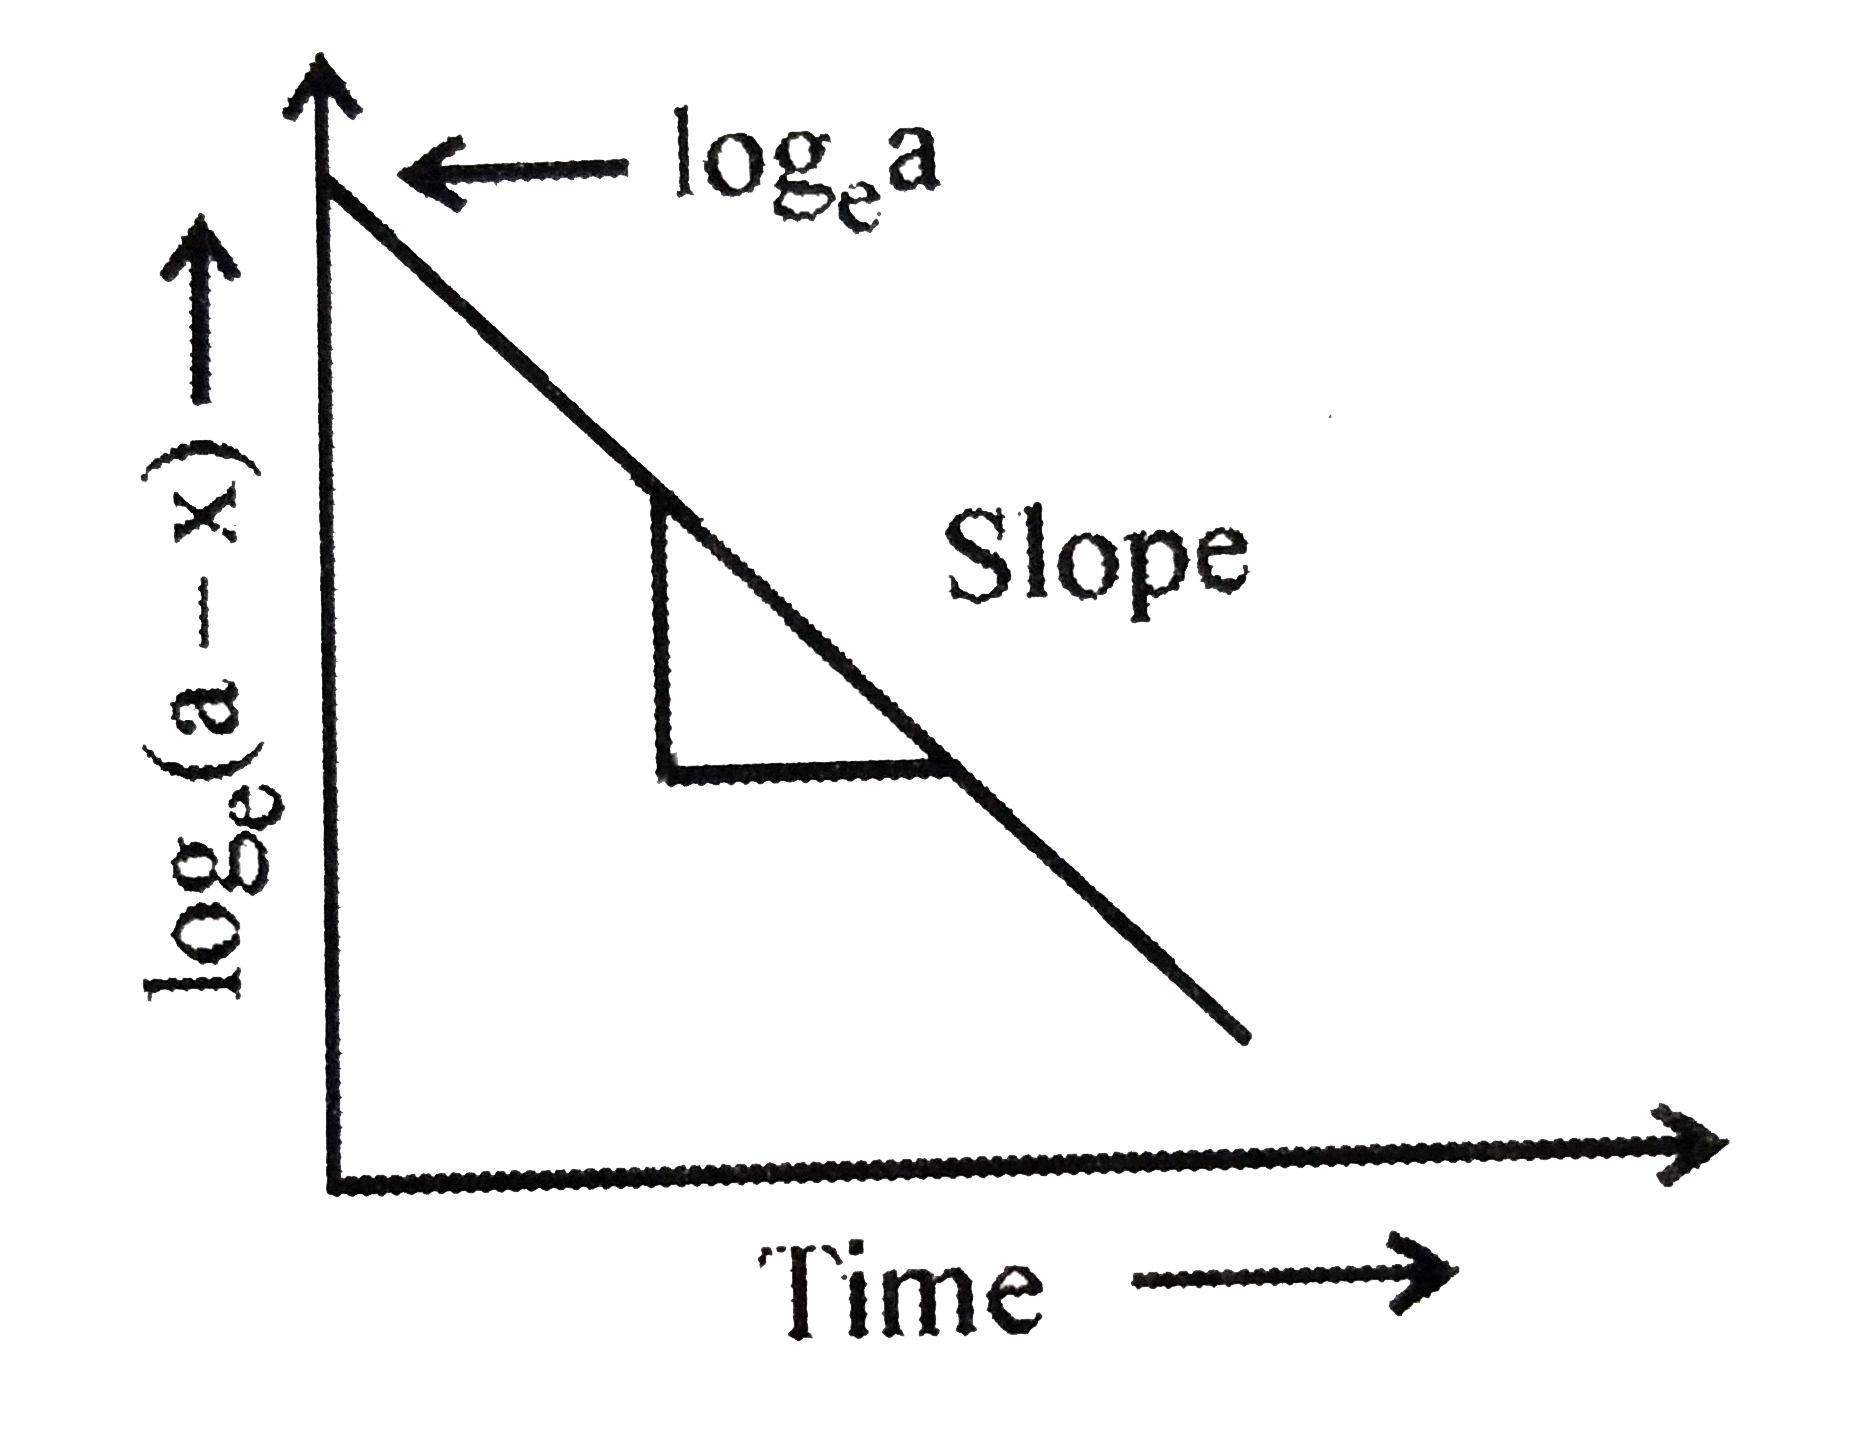
If a graph is plotted between ln k and 1/T for the first order reaction, the slope of the straight line so obtained is given by
−EaR
−Ea2.303R
−2.303EaR
−Ea2.303
The correct Answer is:A
To find the slope of the graph plotted between ln k and 1T for a first-order reaction, we can follow these steps:
Step 1: Understand the Arrhenius Equation
The Arrhenius equation relates the rate constant k of a reaction to the temperature T:
k=Ae−EaRT
where:
- k is the rate constant,
- A is the pre-exponential factor,
- Ea is the activation energy,
- R is the universal gas constant,
- T is the absolute temperature in Kelvin.
Step 2: Take the Natural Logarithm
To linearize the Arrhenius equation, take the natural logarithm of both sides:
lnk=lnA−EaRT
Step 3: Rearrange the Equation
Rearranging the equation gives us:
lnk=lnA−EaR⋅1T
This equation is in the form of y=mx+c, where:
- y=lnk,
- m=−EaR (the slope),
- x=1T,
- c=lnA (the y-intercept).
Step 4: Identify the Slope
From the rearranged equation, we can see that the slope of the line when plotting lnk against 1T is:
slope=−EaR
Conclusion
Thus, the slope of the straight line obtained from the graph of lnk versus 1T for a first-order reaction is given by:
−EaR
---
The Arrhenius equation relates the rate constant k of a reaction to the temperature T:
k=Ae−EaRT
where:
- k is the rate constant,
- A is the pre-exponential factor,
- Ea is the activation energy,
- R is the universal gas constant,
- T is the absolute temperature in Kelvin.
To linearize the Arrhenius equation, take the natural logarithm of both sides:
lnk=lnA−EaRT
Rearranging the equation gives us:
lnk=lnA−EaR⋅1T
This equation is in the form of y=mx+c, where:
- y=lnk,
- m=−EaR (the slope),
- x=1T,
- c=lnA (the y-intercept).
From the rearranged equation, we can see that the slope of the line when plotting lnk against 1T is:
slope=−EaR
Thus, the slope of the straight line obtained from the graph of lnk versus 1T for a first-order reaction is given by:
−EaR
Topper's Solved these Questions
- BOOK - PRADEEPCHAPTER - CHEMICAL KINETICSEXERCISE - TEST YOUR GRIP (FILL IN THE BLANK)23videos
CHEMICAL KINETICS
- BOOK - PRADEEPCHAPTER - CHEMICAL KINETICSEXERCISE - CONCEPTUAL QUESTIONS (I. General introduction and rates of reactions)6videos
CHEMICAL KINETICS
- BOOK - PRADEEPCHAPTER - CHEMICAL KINETICSEXERCISE - CURIOSITY QUESTION2videos
CHEMICAL KINETICS
- BOOK - PRADEEPCHAPTER - BIOMOLECULES EXERCISE - IMPORTANT QUESTIONS (FOR BOARD EXAMINATION)25videos
BIOMOLECULES
- BOOK - PRADEEPCHAPTER - CHEMISTRY IN EVERYDAY LIFE EXERCISE - IMPORTANT QUESTION FOR BOARD EXAMINATION30videos
CHEMISTRY IN EVERYDAY LIFE
Similar Questions
Knowledge Check
- Question 1 - Select One
For a lst order reaction , a straight line is obtained if you plot
Alog conc. vs timeBconc. vs timeC1/conc. vs timeDlog conc. vs 1/time - Question 2 - Select One
For a first order reaction, the plot of log[A]tvs t is linear with a
Apositive slope and zero interceptBpositive slope and non zero interceptCnegative slope and zero interceptDnegative slope and non zero intercept - Question 3 - Select One
A graph plotted between log k vs 1T is represented by
A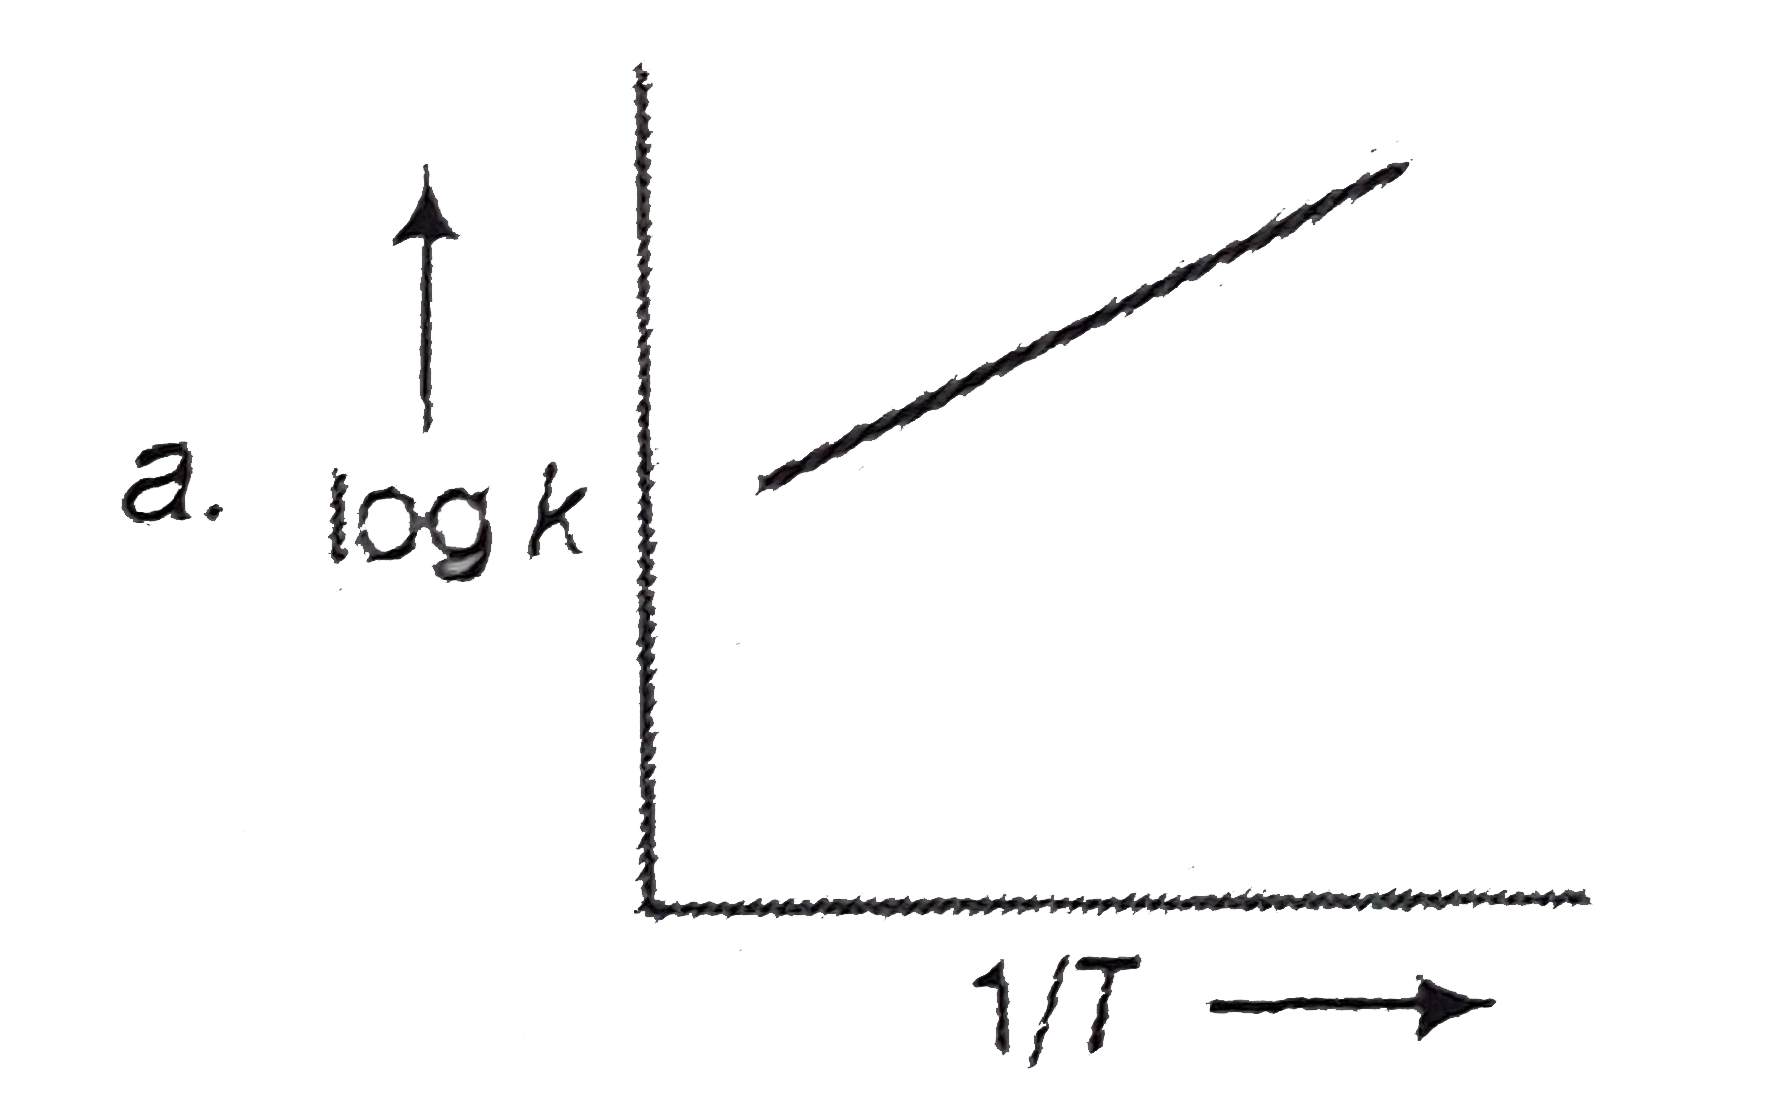 B
B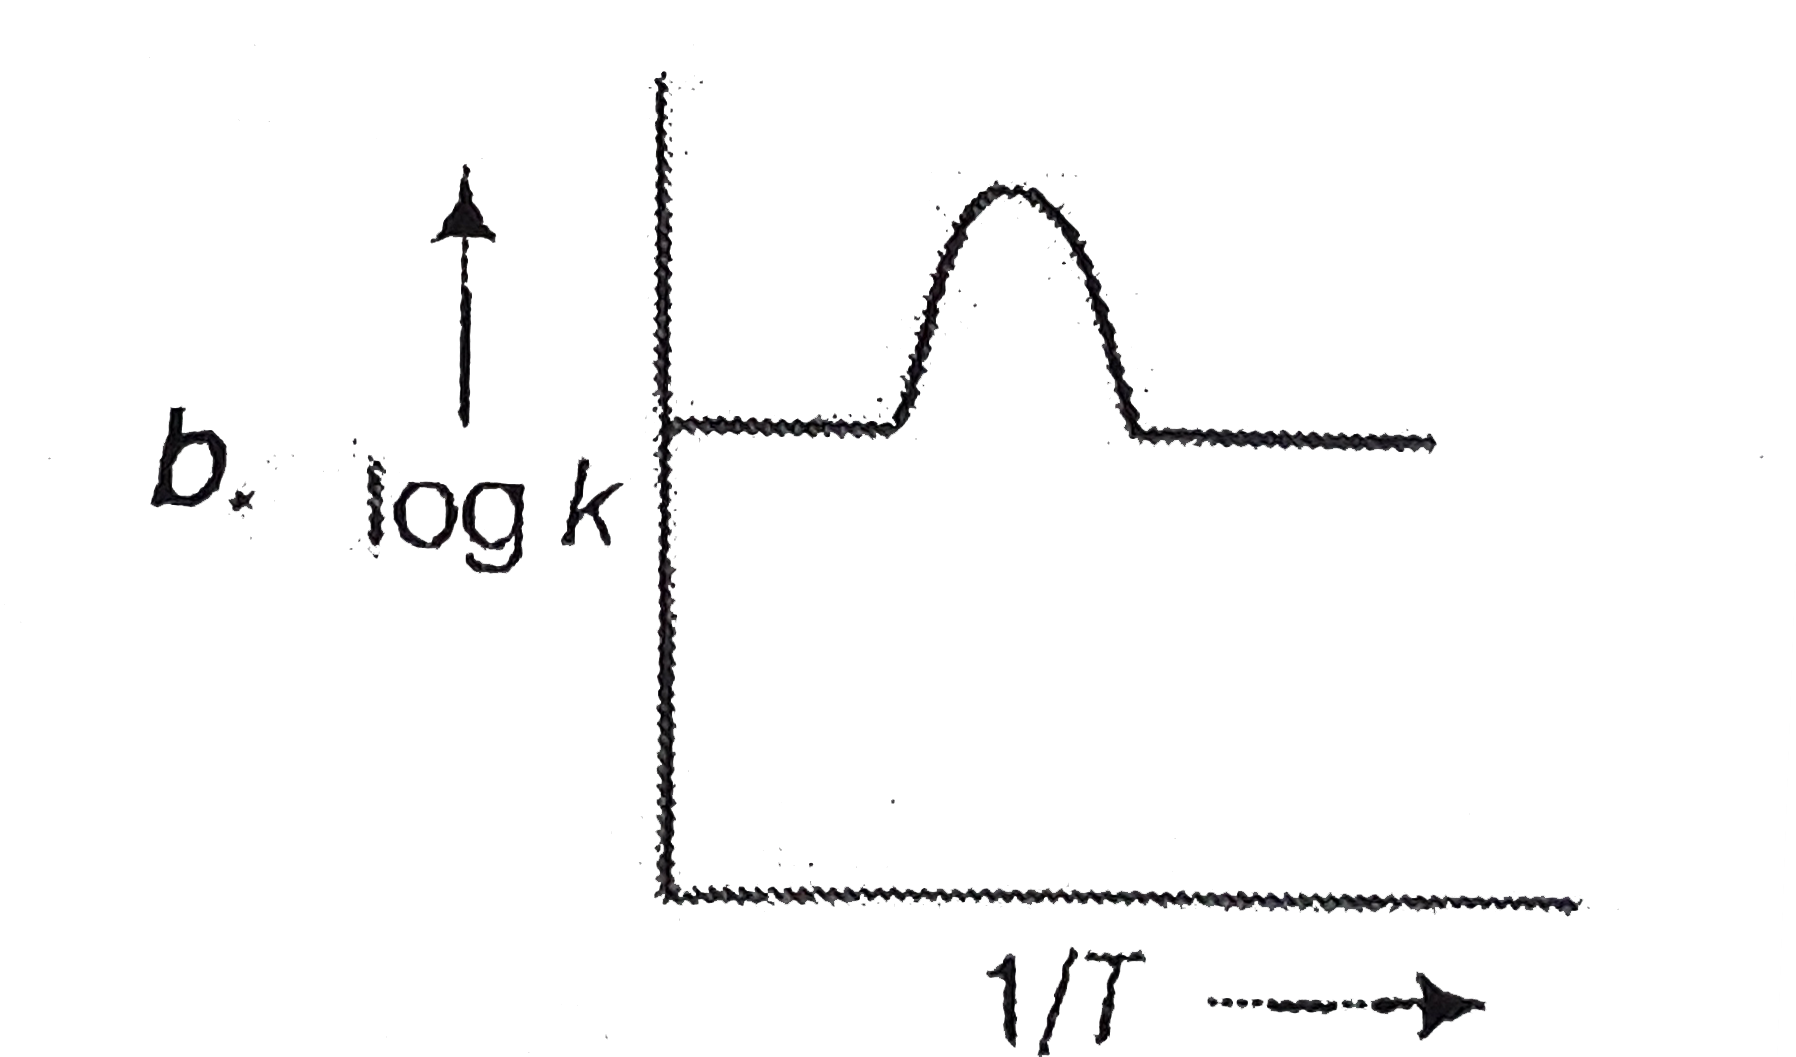 C
C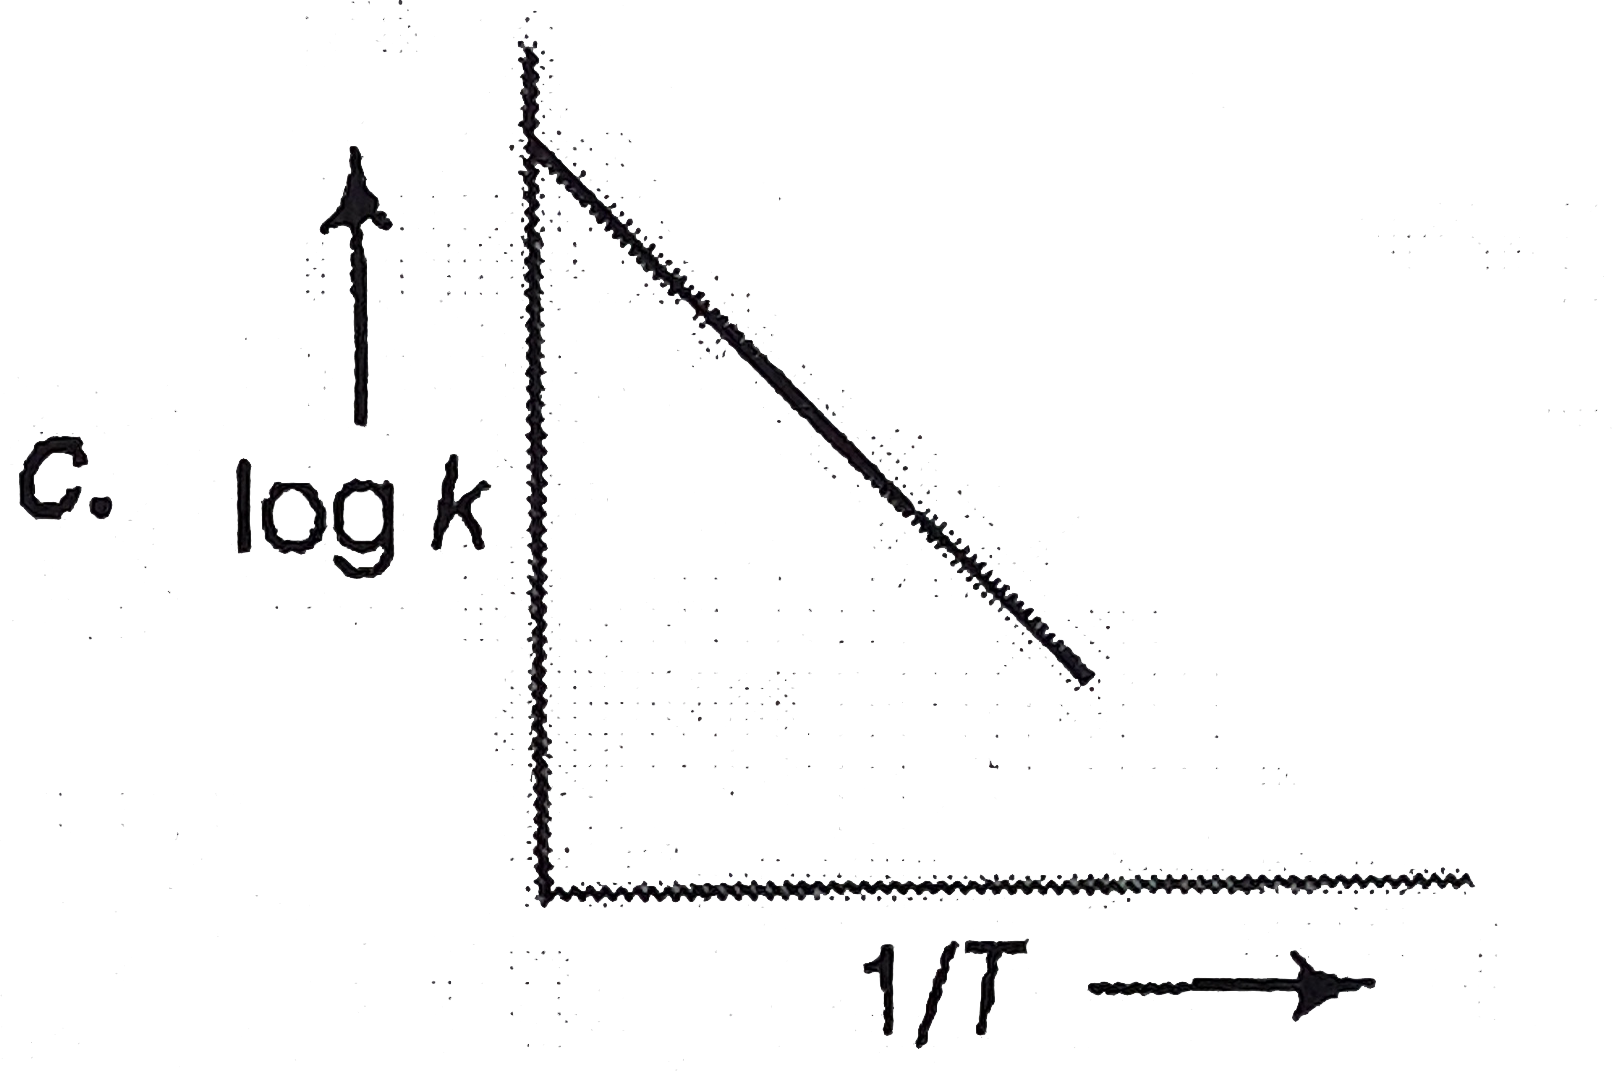 D
D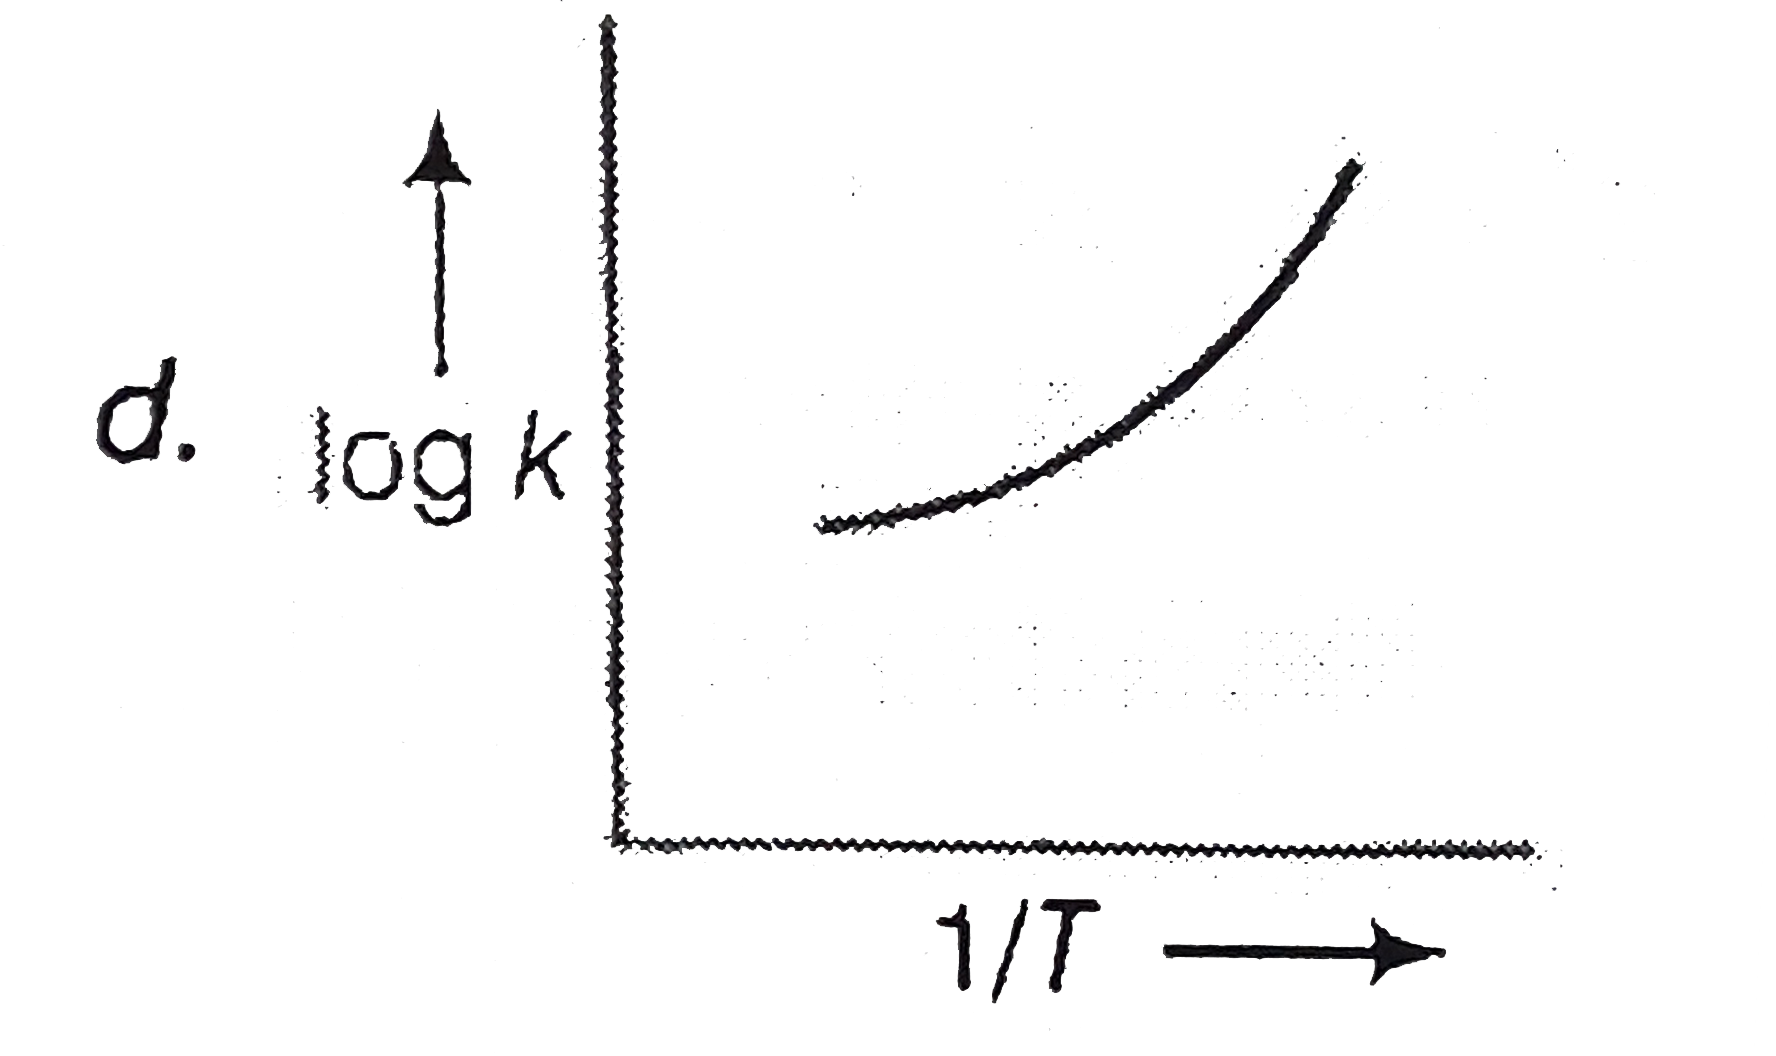
If a graph is plotted between log(a−x) and t, the slope of the straight line is equal to −0.03. The specific reaction rate will be
View SolutionIn the following plot, for a first order reaction, slope is equal to
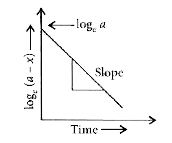 View Solution
For a first order reaction, the plot of log k against 1/T is a straight line. The slope of the line is equal to
View SolutionIf we plot a graph between log K and 1T by Arrhenius equation , the slope is
View SolutionIn Arrehenius equation if a graph is plotted between logK and 1/T, the slope of the curve will be:
View Solution

