In Arrehenius equation if a graph is plotted between logK and 1/T, the slope of the curve will be:
−EaR
−Ea2.303R
EaR
Ea2.303R
The correct Answer is:B
Step by step video, text & image solution for In Arrehenius equation if a graph is plotted between logK and 1/T, the slope of the curve will be: by Chemistry experts to help you in doubts & scoring excellent marks in Class 12 exams.
Topper's Solved these Questions
- BOOK - CBSE COMPLEMENTARY MATERIALCHAPTER - CHEMICAL KINETICSEXERCISE - VERY SHORT ANSWER TYPE QUESTIONS24videos
CHEMICAL KINETICS
- BOOK - CBSE COMPLEMENTARY MATERIALCHAPTER - CHEMICAL KINETICSEXERCISE - SHORT ANSWER-I TYPE QUESTIONS26videos
CHEMICAL KINETICS
- BOOK - CBSE COMPLEMENTARY MATERIALCHAPTER - BIOMOLECULESEXERCISE - SHORT ANSWER-II TYPE QUESTION13videos
BIOMOLECULES
- BOOK - CBSE COMPLEMENTARY MATERIALCHAPTER - CHEMISTRY IN EVERYDAY LIFEEXERCISE - LONG ANSWER TYPE QUESTIONS2videos
CHEMISTRY IN EVERYDAY LIFE
Similar Questions
Knowledge Check
- Question 1 - Select One
In Searl's experiment a graph is plotted between
Aload on hanger and radius of wireBload on hanger and mean value of spherometer screw readingCradius of the wire and spherometer screw readingDnone of these - Question 2 - Select One
A graph plotted between log k vs 1T is represented by
A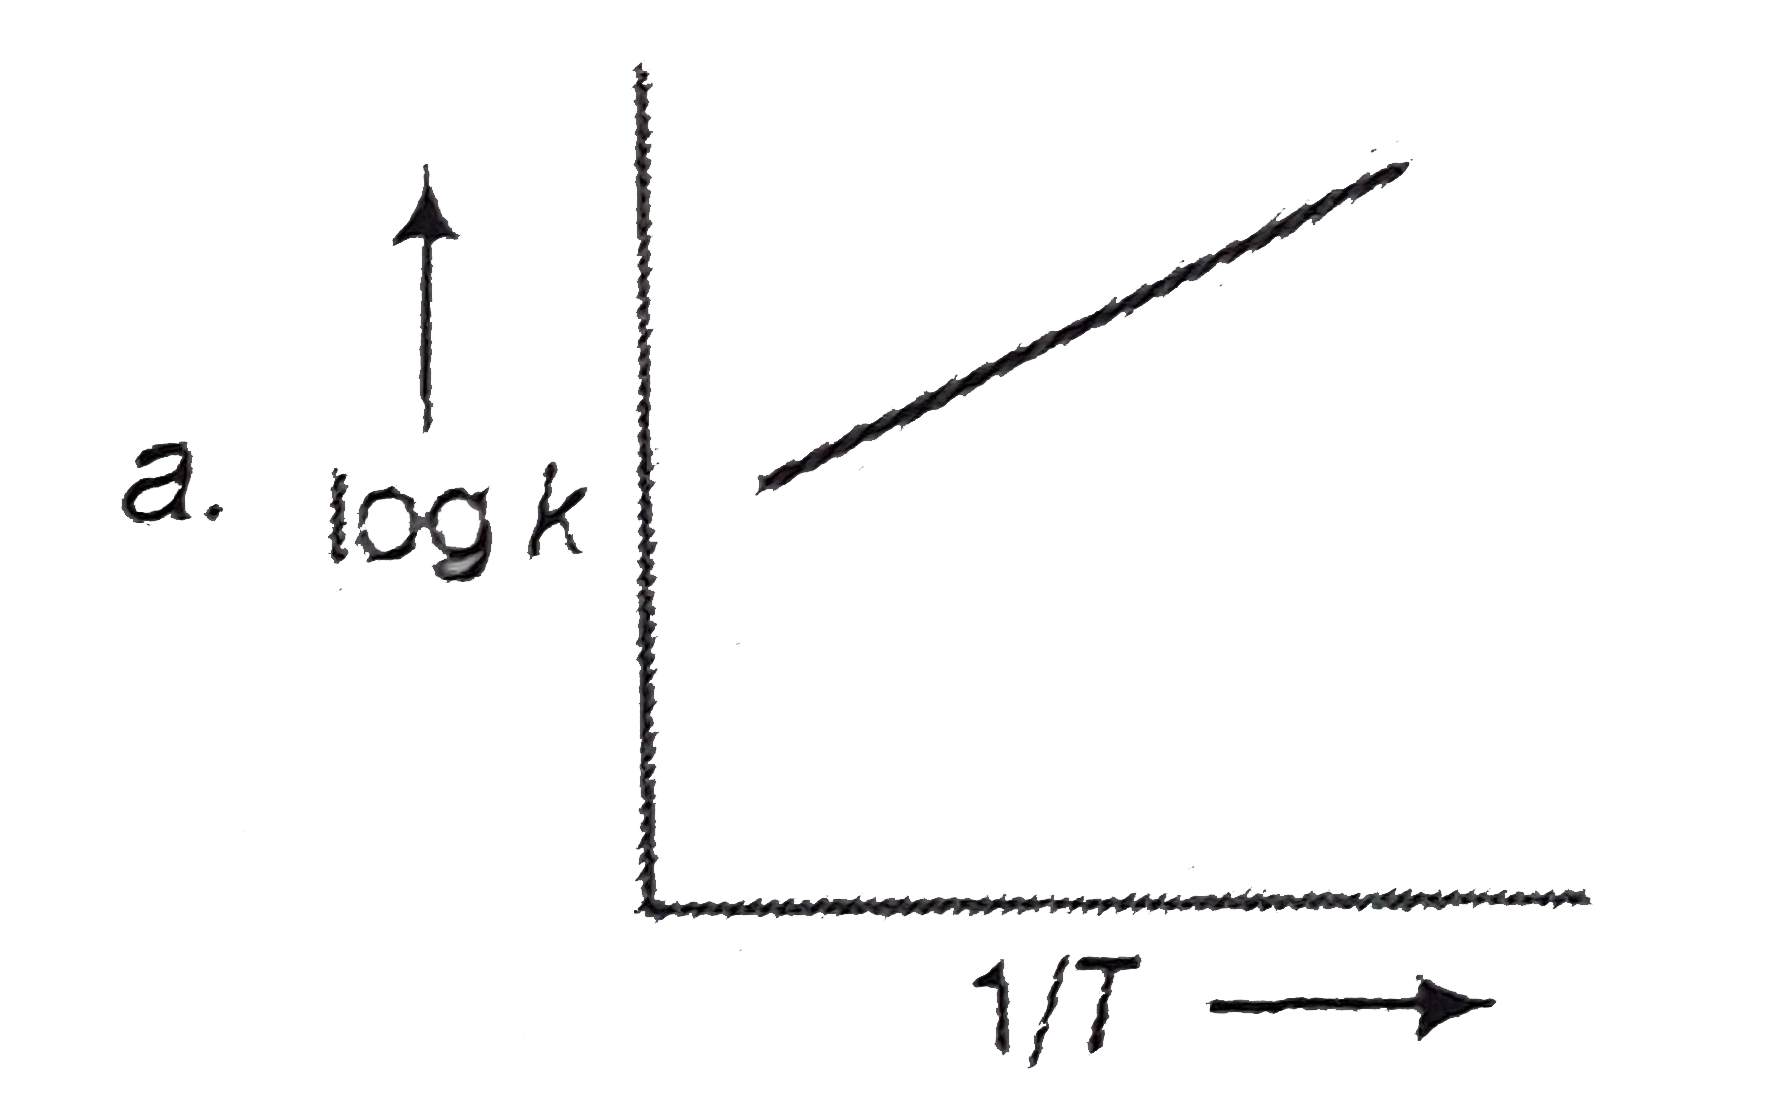 B
B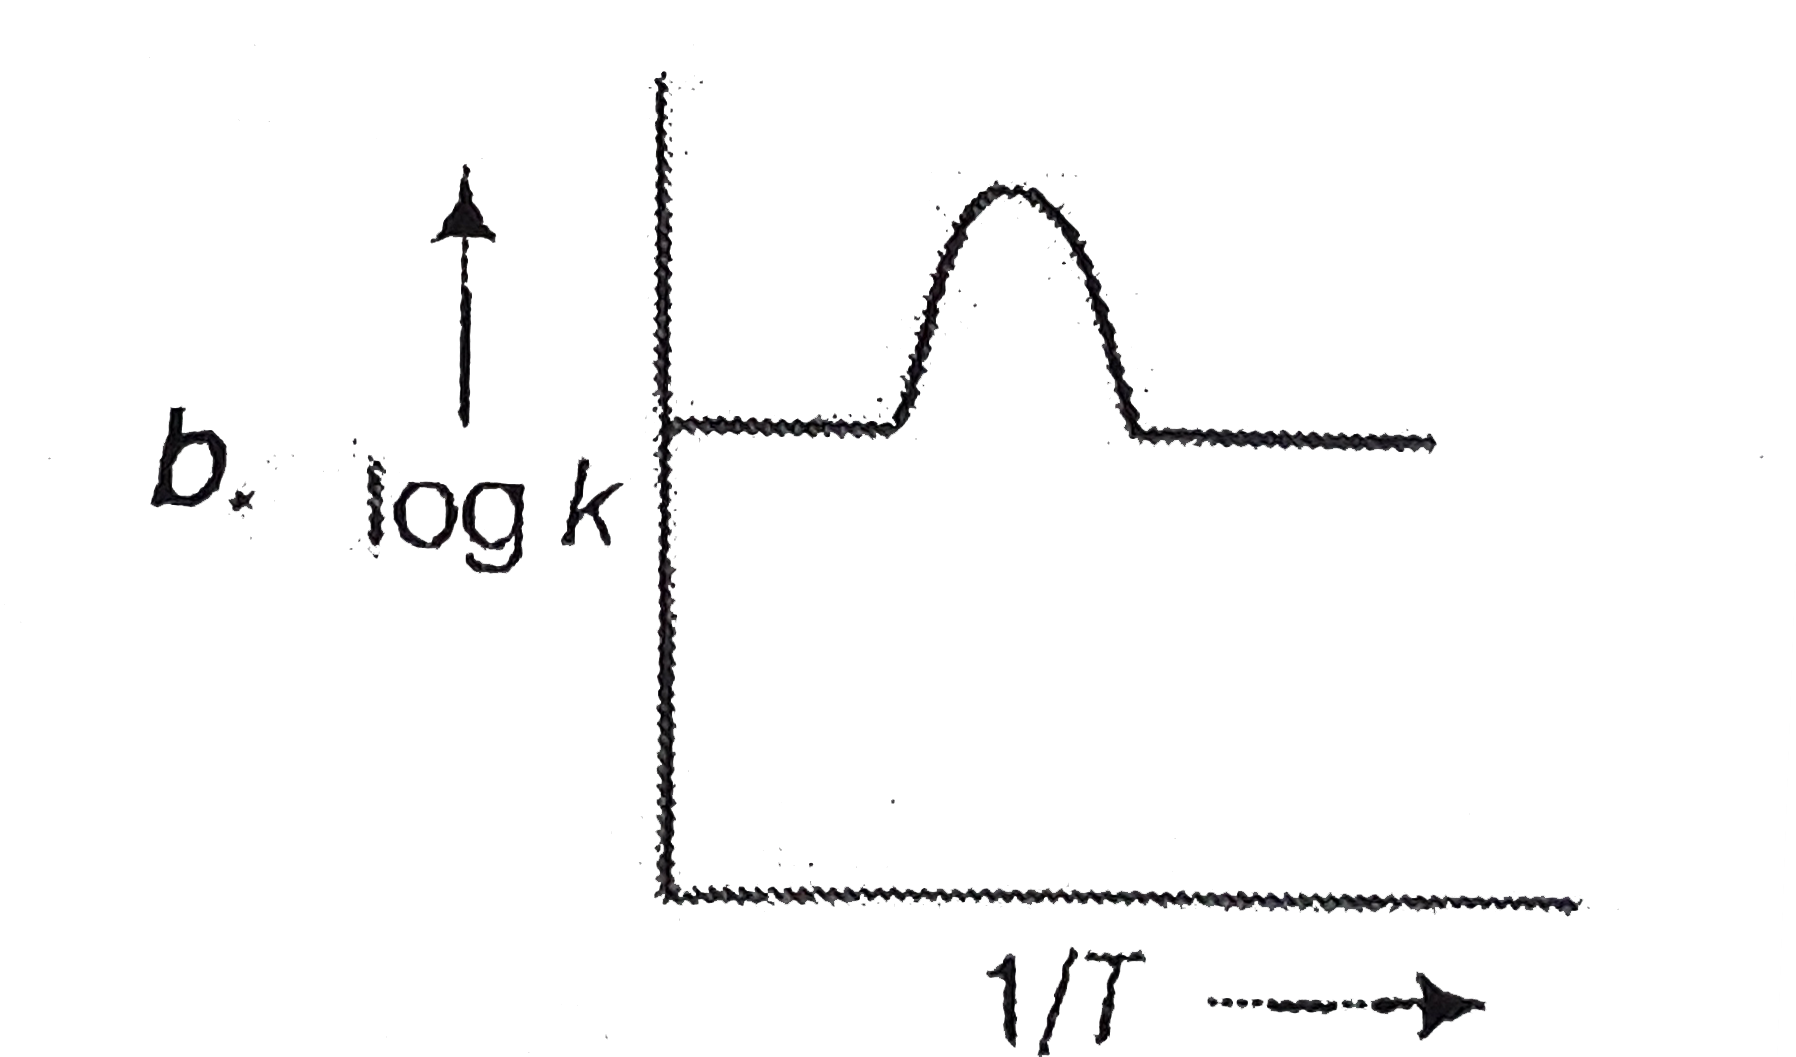 C
C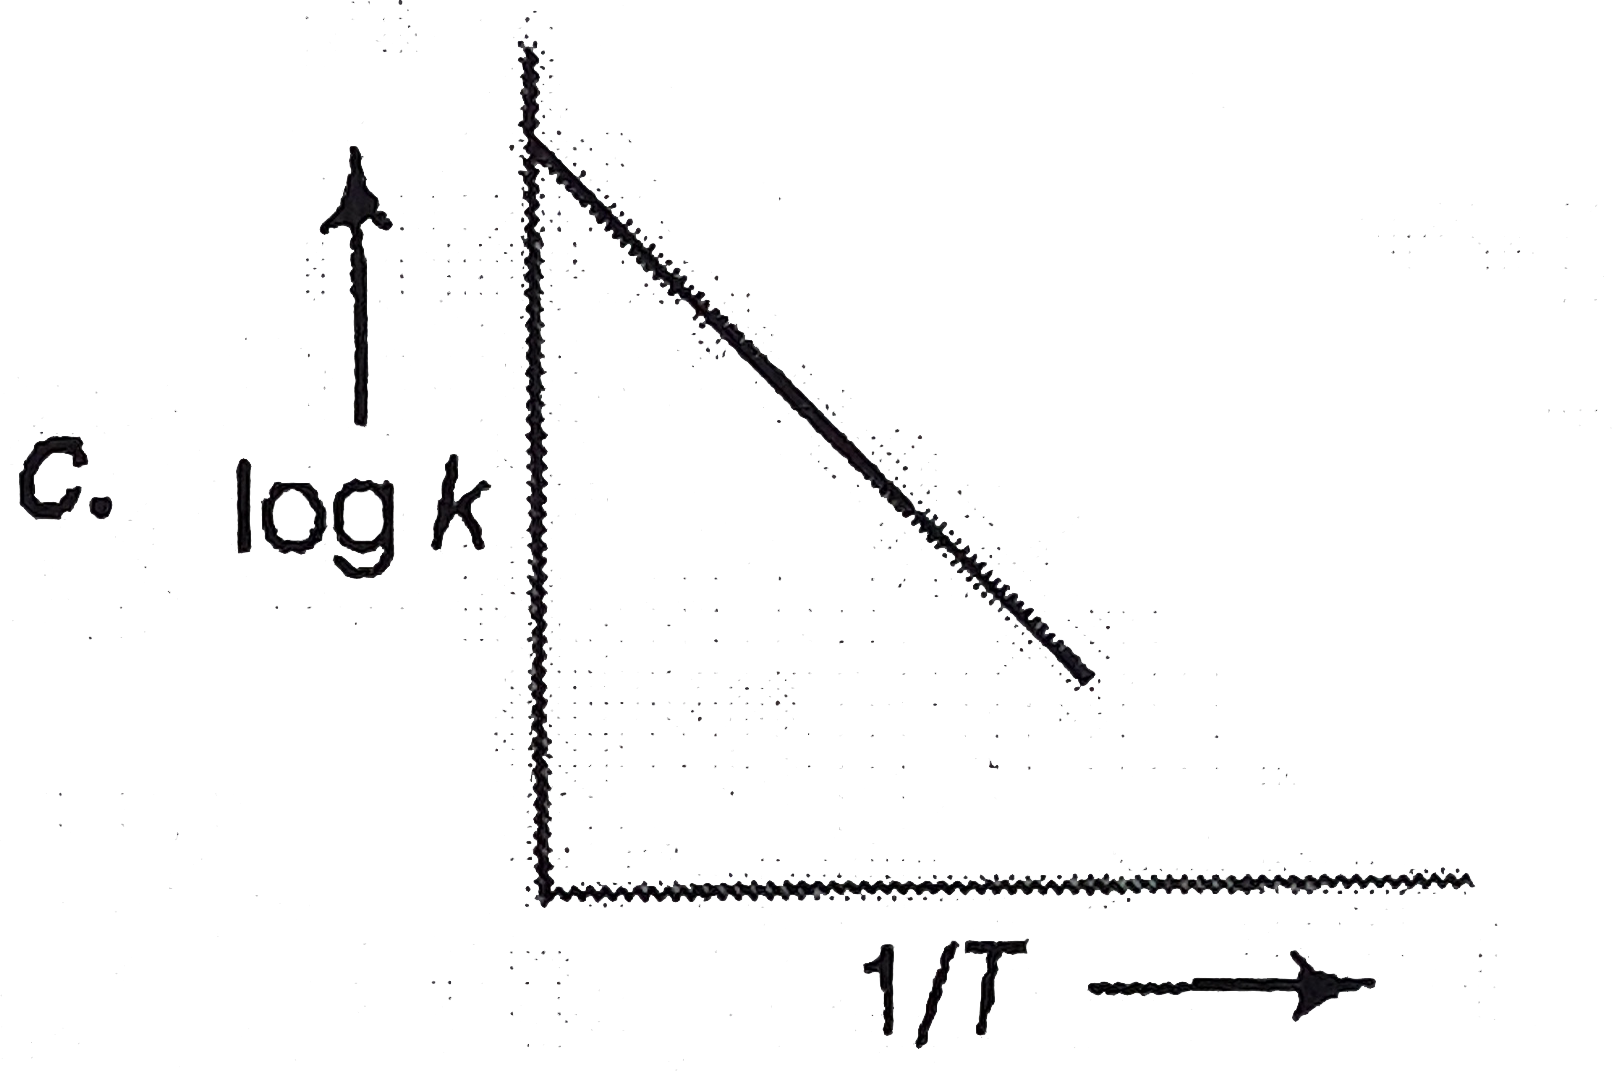 D
D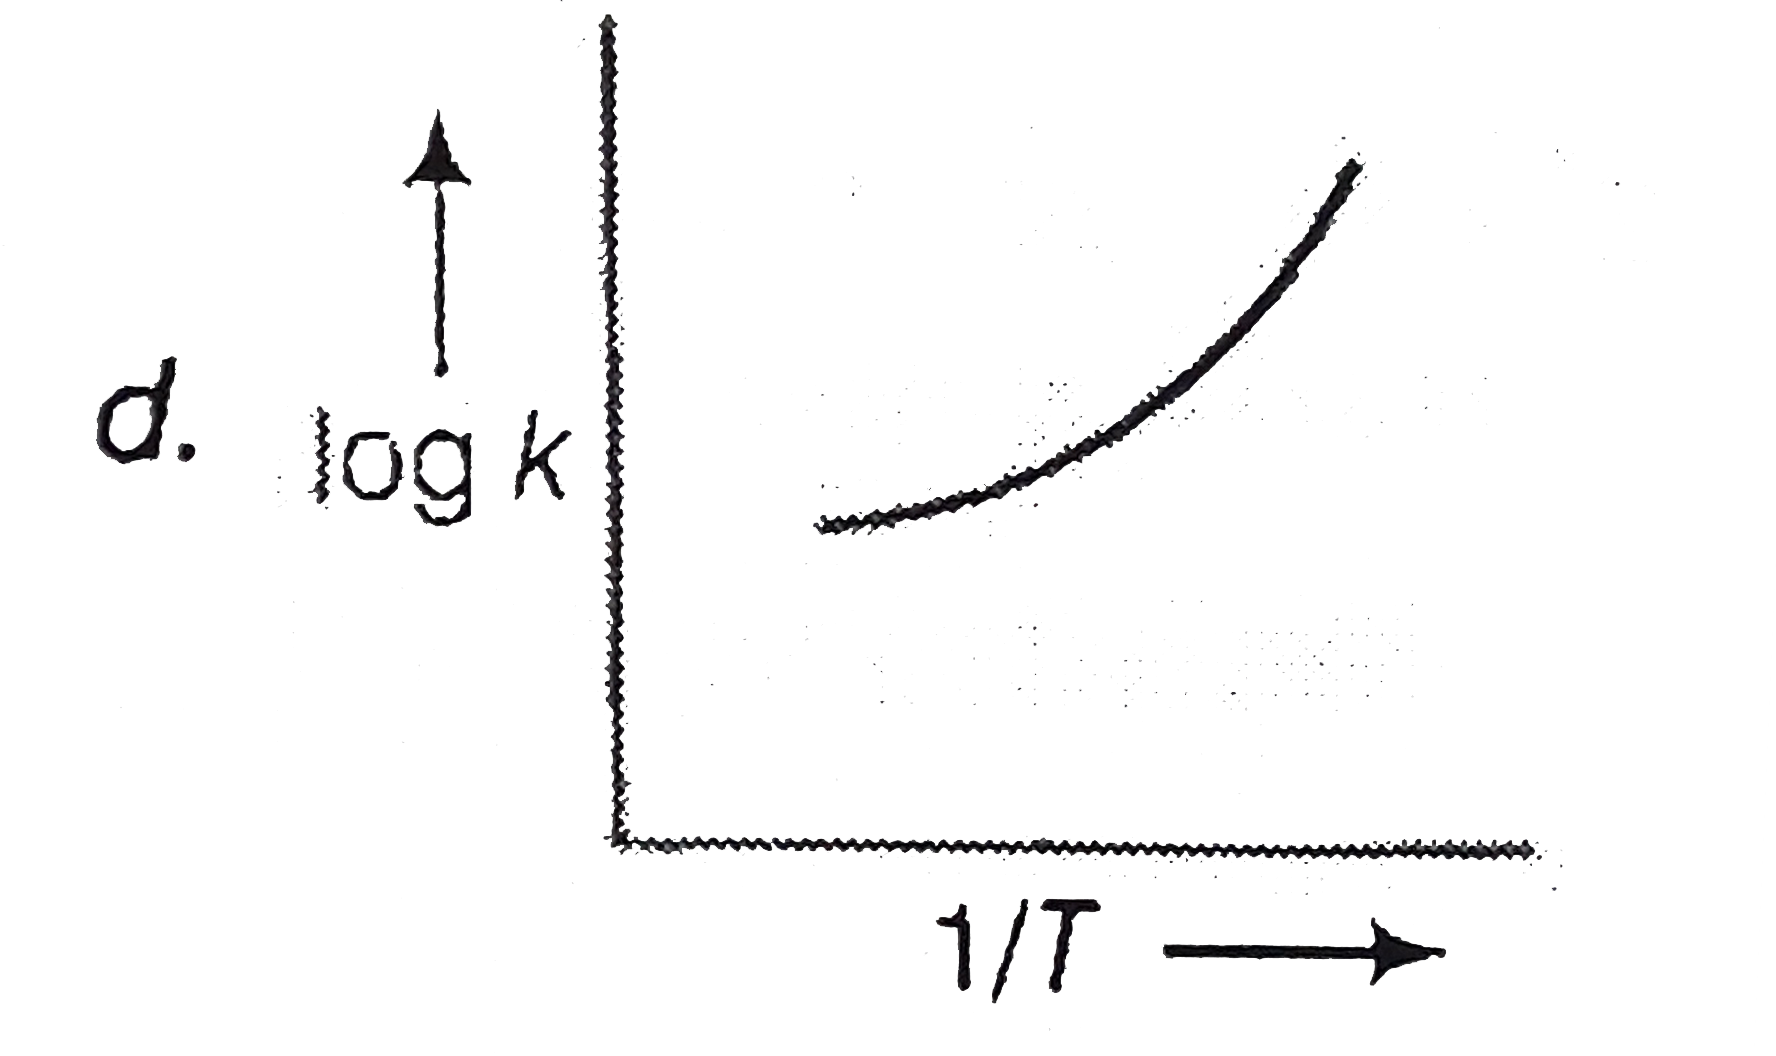
- Question 3 - Select One
A graph plotted between log N vs, time gives a slope and intercept equal to:
A−λ2.303,logN0Bλ2.303,logN0C−λ2.303,N0Dλ2.303,N0
If a graph is plotted between ln k and 1/T for the first order reaction, the slope of the straight line so obtained is given by
View SolutionIn accordance to Arrhenius equation, the plot of log k against 1T is a straight line. The slope of the line is equal to
View SolutionThe plot of In 1/T is linear with slope of :
View SolutionA solenoid is connected to a cell. There is no resistance in the circuit. If the current I flowing in the circuit is plotted against time t, the slope of the curve (dI/dt) will
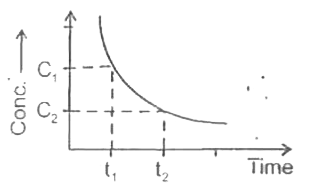
View SolutionThe graph plotted between concentration versus time
 View Solution
